In the last decade, the number of attempts to assess the state of the environment by modeling its components has increased. Three papers in this issue of Clean Air exemplify the range of modeling and. Models are imperfect descriptors of the environment, so their limitations and problems should always be acknowledged.
Former Victorian Premier, Sir Rupert Hamer, "father" of the Environmental Protection Act, advocate of the Environmental Protection Authority and initiator of the Garden State program. He guided the development of the Gippsland Central Watershed Strategy, the first community-based strategy to be developed and a model to be followed by the Yarra and others. Ken Verrall of the Queensland Department of Environment has kindly agreed to act as Chair.
Ken was instrumental in organizing the very successful OSIG Workshop on the Gold Coast in 1995. If any members are interested they can contact Neville Bofinger or any member of the Executive to discuss the required proposal content.
AUSTRALIAN / NEW ZEALAND STANDARDS
CANCER DISINFORMATION SEMINARS
O. Box 155
P.O. Box 2457 Brisbane Qld 4001
BENZENE
Project value under $1 million
Project value
Project value in excess of $10 million
Taxes in the Illawarra and Hunter areas start at $4 a tonne and rise to $8 a tonne in 1997. Mr McGauran welcomed the industry's participation in the program and congratulated the companies and associations that signed up to their co-operative. agreement today for their leadership and commitment to achieving sustainable economic growth. Senator Purer acknowledged the role that industry associations are playing in encouraging their members to participate in the Challenge.
Dr. Penman said: 'We have seen a steady decline in air pollution over the past twenty years, but even at current low levels there are important health impacts. While there is no longer a single major initiative that will reduce air pollution, small gains can be made through a wide range of programs, some of which are included in the AQMP. Comments and contributions to this discussion paper are now being sought from the community and industry as we develop a range of air pollution solutions.
Thematic and informative seminars will be held in the adjacent meeting rooms while the exhibition is in progress. As the leading supplier of Hi-Vols in the US, Andersen through LSA can offer excellent distribution and a competitive product range. The Environmental Education thesis explored agenda setting in television news, believes that the introduction of 'environmental' rounds reflects a shift in the concept of what news is.
He changed the philosophy of what news is by joining the so-called 'hard' news (politics, business, traffic accidents or murders)'. The only potential danger, but with a low risk, is a catastrophic release of coolant, where the ignition then ignites and causes an explosion in the engine compartment. This is a practical 'hands-on' description of how companies can implement a comprehensive system to meet the requirements of the ISO 14000 and ISO 9000 environmental management standards.
Prepared for the EPA by the Climate Impacts Group of the CSIRO Atmospheric Research Division. Handbook of Water and Wastewater Sampling and Analysis, Publication Critical Review of the Biological Indicator Systems Program, Publication 429, $5.00. The largest fabric filter company has no more than 10% of the market on any continent.
OZONE IN THE NORTH OF ITALY
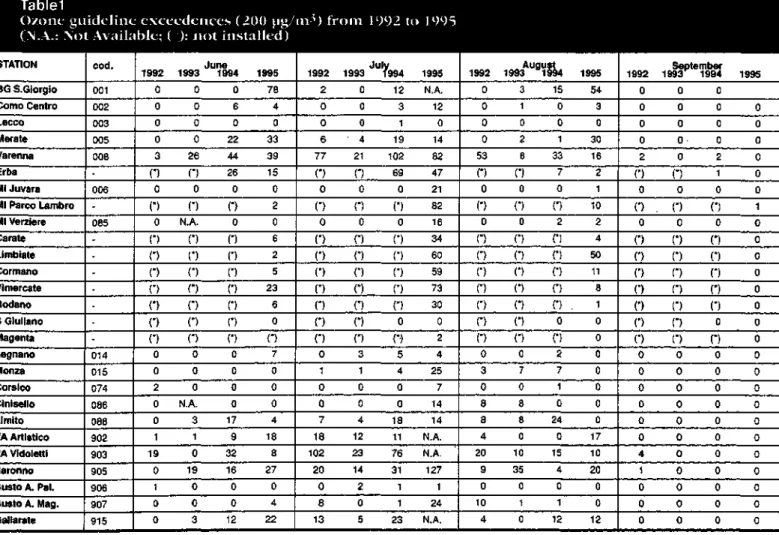
OZONE MEASUREMENTS AND THE OBJECTS OF THE STUDY The provinces of Milan, Bergamo, Varese and Como are equipped with air pollution recording networks for the measurement of both the concentration of chemical parameters (O3 but also CO, PTS, NOx, SO2) and weather parameters, such as e.g. such as temperature, wind speed and direction, rainfall, relative humidity and solar radiation. In particular, ozone in was measured in 18 monitoring sites, located in many different areas, mainly characterized by increased population density or heavy traffic. In this area, frequent exceedances of the air quality standard ozone value occur during summer time (June to September).
The goal of investigating the processes that cause high ozone concentrations has been pursued in various ways. In fact, some stations, located in the north, show high concentration levels at night, with nighttime maxima between 60 and 100-120 ug/m3, especially in June-August. Finally, we applied a quantitative method to analyze the distribution of ozone in the study area.
Applying cluster analysis showed similar results for the 24-hour period and the daily period. The southern region, including the province of Milan, Bergamo and the south of the province of Como;. Comparison of the clusters included in the three regions shows an increasing gradient of ozone concentrations going from South to North.
The analysis is extended to 22 monitoring stations, adding 4 located in Switzerland, on the Italian border, and the results are reported in Figures 2 and 3 as an example. The group with the lowest ozone concentrations groups the stations located in the cities of Milan, Como and Lecco, near roads with heavy traffic. Not much higher values characterize the members belonging to group 4, referring to the stations located in the south of the study area.
At the bottom of Figure 2, ozone concentrations calculated for the centroids of the 5 clusters during the weekly period are reported. This analysis describes the spatial distribution of station clusters based on hourly ozone data, and the general relationship with transport from the main precursor source areas, in the northern part of Italy. This first step of research will conclude with a descriptive characterization of the photochemical smog and summer anemological fields responsible for ozone and.
INTERPRETATION OF THE AIRTRAK DATA FROM LIVERPOOL MONITORING STATION USING THE
This section reports Airtrak monitoring data collected on the following summer days of 10, 11 and 12 February 1994 at Liverpool Station, located in the south-west area of Sydney Airport. Airtrak determined concentrations of NO, NOy, O3, and Rs m o g were used to calculate various IER parameters according to version 2.2 of the Johnson and Azzi [1992] model. On the 12th, the concentration of produced smog was lower than 0.03 ppm throughout the day, which means that no pollution episodes were detected that day.
In the NOx-restricted regime, where there is no new smog production, the concn. The modeling results given in Figure 2 show for each selected day four different plots labeled A, B, C and D. The first, second and third were obtained using SP/Rsmog. Time steps are quantified on the abscissa, indicating how much time has passed before or after midnight on the selected day.
For example, let's consider plot A at 11 o'clock of plot 10, calculations show that the average time of precursor emissions was about 11 hours before midnight, e.g. Graphs A, B, ancl C show the sensitivity of the method to the accuracy of the SPback concentration. Since plot A has no SPb a c k correction, the age predictions of the selected air parcels will be overestimated.
The relationships shown in Figure 2 indicate that whatever value was used for SPback on the 10th, air parcels sampled between about 930 h and 1200 h would be emitted in the afternoon of the previous day. At date 11 and in the range of SPback variability selected, all three plots show that the polluted episodes, ranging from 1000 h to 1200 h, originated from. In the accepted confidence range SPb a c k 12t, all plots can be fitted to have the corresponding cumulative sunlight profile s h a p e without showing any time lag.
Three selected Airtrak data from the Liverpool area were fed into the IER model to assess air quality in the area. The IER parameters have provided information on the ambient air quality, including the age of the photochemical e p i s o d e s precursors. Notes on the derivation of the integrated empirical rate model, version 2.2 CSIRO (20 March 1992), internal report.
FIELD EVALUATION OF AN URBAN CANYON AIRFLOW AND SCALAR DISPERSION MODEL
Air from each of the intakes was bought back along separate PVC pipes to the two NOx analyzers. As in FP1, PVC pipes were used to bring air from gas intakes back to the NOx analyzers, which were housed inside one of the demountable cars. All data were averaged in one-minute blocks for the initial analysis of the flow regimes.
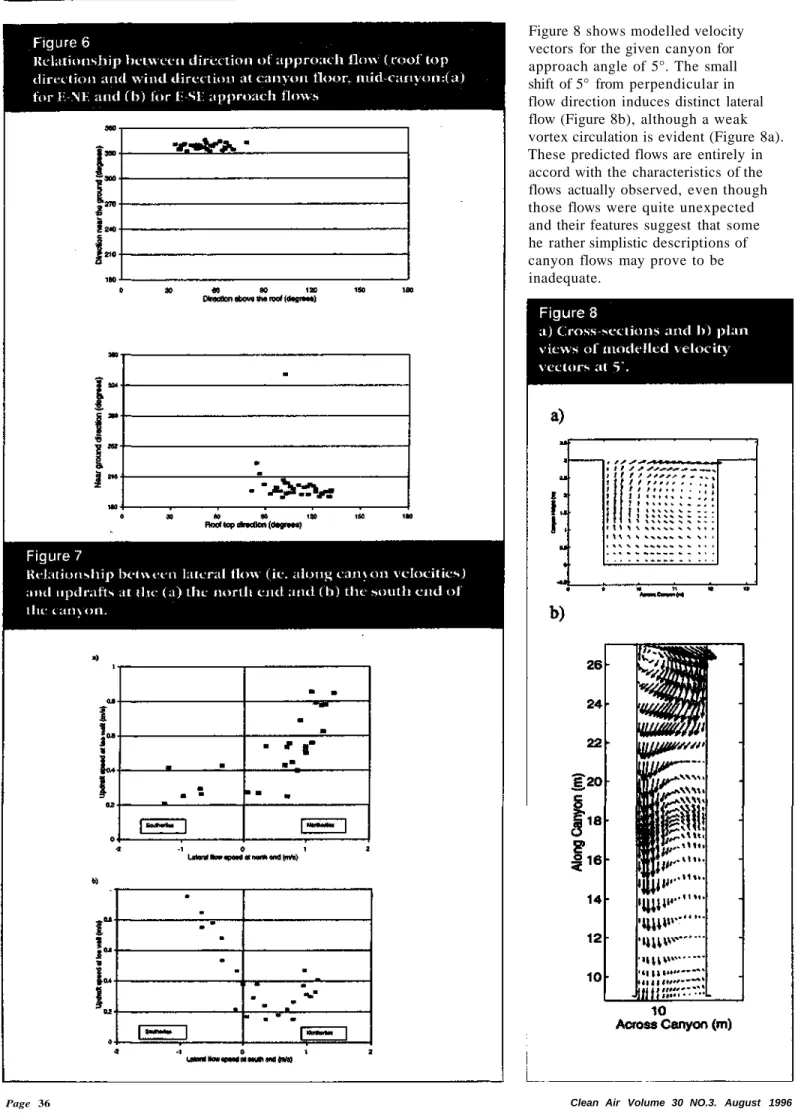
First, the modeled gas concentrations will be incorrect if the predicted flow regime is incorrect, so an evaluation of the airflow. An average cross-canyon eddy will be characterized by a reversal in flow direction at the base of the urban canyon. For normal approach flows, downflow observed at the base of the wind wall (MW) was correlated with upflow.
These grants were provided through the Cleaner Production Partnerships program, a joint activity of the Australian Chamber of. Inspect the book randomly and judge it based on the treasures or the dross that appears. The environment is increasingly topical, concerns a growing part of the population and attracts almost daily interest from the media.
It is also quickly apparent that the editors and the majority of the authors are North American, and the book is very much written from a North American perspective. The book provides a comprehensive overview of the design techniques used to provide occupant comfort in the diverse climates found in Australia, without wasting energy. The second chapter 'Design principles for comfort' gives a brief overview of the measurement of comfort.
Uncertainties (CCS) must contribute to such a consensus and review the current knowledge of the science of climate change. CCS begins with a summary of the report's findings and their implications for Australia. In addition to the introduction (chapter 1), the main part of the report is divided into 4 chapters, each with a main theme.
A very good summary of the carbon cycle made me want to do something similar for the nitrogen cycle. The report ends with a brief plea for further research, summarizing the National Greenhouse Response.
A REPORT ON THE 13TH OLYMPIAD sorry
CONFERENCE