The remainder of the paper is organized as follows: Section 2 provides relevant literature on the relationship between AC and EM and discusses the issue of endogeneity in CG studies; Section 3 describes the data and methods; Section 4 provides empirical results; and the last part concludes the paper. According to legitimacy theory, managers manage earnings to meet the expectation of internal stakeholders and the public to gain and maintain legitimacy. Managers (ie, agents) tend to be interested in pursuing their own objectives, rather than always maximizing the benefits of shareholders (ie, the principal).
AC was considered one of the fundamental problems in improving the mechanism of corporate governance (Shleifer & Vishny, 1997). 1 The state is the major shareholder in many public companies in China, the managers/agents of the state-. In practice, government officials may also pursue their own welfare (e.g., job promotion or salary and other benefits) at the expense of the country's interests (Lin, Ming, & Xu, 2006).
Therefore, it is important to investigate whether EM reduces or impairs AC in a country like China with severe agency problems despite the concentrated state ownership. Another disadvantage of the time series approach is that the variables used for time series estimation and the coefficient generated may not be stationary. The disadvantage of the cross-sectional approach is that it assumes that the coefficients are the same for all firms within a particular year and industry (Kasznik, 1999).
The estimated DA for the firm is a proxy for the quality of the firm's earnings.
Control variables
For example, time series analysis requires a relatively longer length of observation periods to obtain reliable parameter estimates for a linear regression (DeFond & Jiambalvo, 1994). A large absolute value of DA indicates active EM behavior, while signs of DA indicate the strategy adopted by firms (Ding, Zhang, & Zhang, 2007).
Model specification
To control for unobserved heterogeneity and to address the potential bias caused by omitted variables, we include industry dummy, stock exchange dummy and year dummy in the model. The definitions and acronyms of the variables used are summarized in Table 1. Where: i indexes firms in sample and t indexes time;. 2012) suggest that a dynamic model in which lagged performance is used as one of the explanatory variables should be the appropriate empirical model in the context of internal corporate governance research. To capture the impact of the previous characteristics of corporate governance, Wintoki et al. 2012), we first added two lags of dependent variables and found that the coefficients on the second lag were not statistically significant.
Empirical Results 1 Summary statistics
- Correlation
- Static model
- Fixed-effect OLS and GLS
- Dynamic model
- Two-step system GMM
- Robustness check
- Discretionary accruals using a cross-sectional approach
- Earnings management as dependent variable
Where: i indexes the firms in the sample and t indexes time;. 2012) suggest that a dynamic model where lagged performance is used as one of the explanatory variables should be an appropriate empirical model in the context of internal corporate governance research. The mean of the CEO duality dummy variable is about 20 percent, suggesting that only a small number of firms in the sample have a CEO who is also the chairman of the board. The correlation matrix shows that most of the independent variables are not highly correlated with each other (ie, less than 0.30).
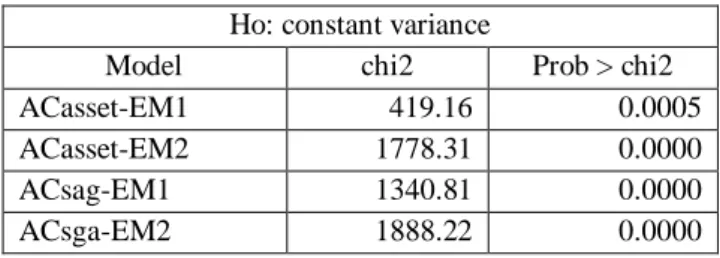
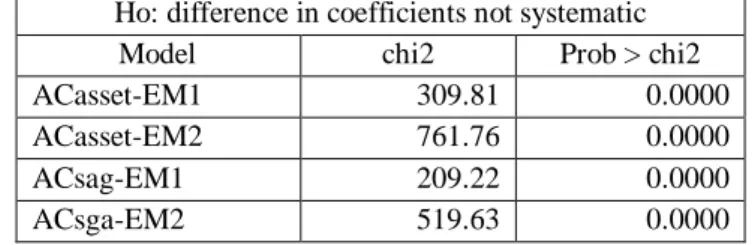
One of the assumptions of ordinary least squares (OLS) is that the variance of the error term is constant. We used Breusch and Pagan's (1979) and Cook and Weisberg's (1983) tests to examine the presence of heteroskedasticity and report the results in Table 4. All p-values of the Hausman test are lower than the 1 percent significance level; thus rejecting the null hypothesis.
Rejection of the null hypothesis of the Hausman test suggests the use of fixed-effect OLS estimation. The literature (e.g., Asteriou & Hall, 2015; Dougherty, 2011; Greene, 2012) also recommends using the General Least Squares (GLS) estimator to address the issue of heteroskedasticity. The GLS estimation results reported in Table 7 are consistent with the fixed effect OLS estimation results reported in Table 6.
Thus, the OLS and GLS estimation of the static model may be biased due to the presence of endogeneity. The consistency of the system GMM estimator is highly dependent on the validity of the instrument set. Therefore, we used two sets of specification tests to check the validity of the instrument sets.
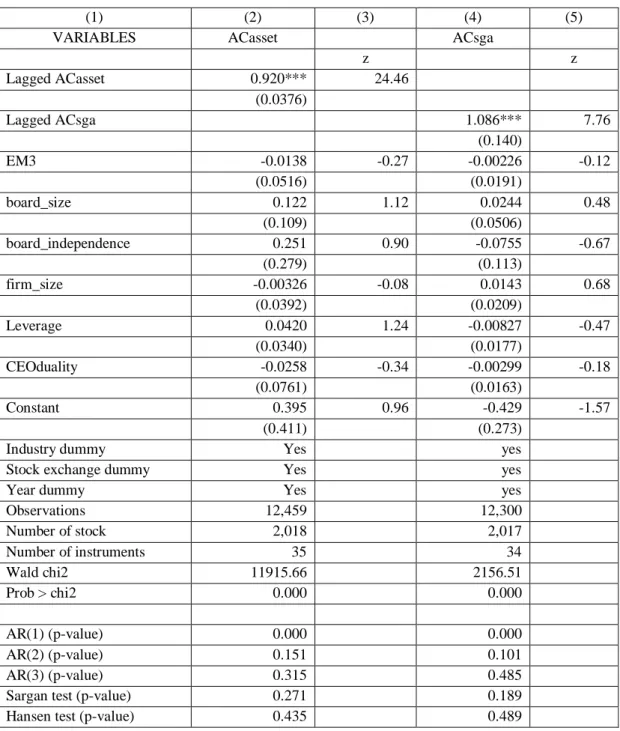
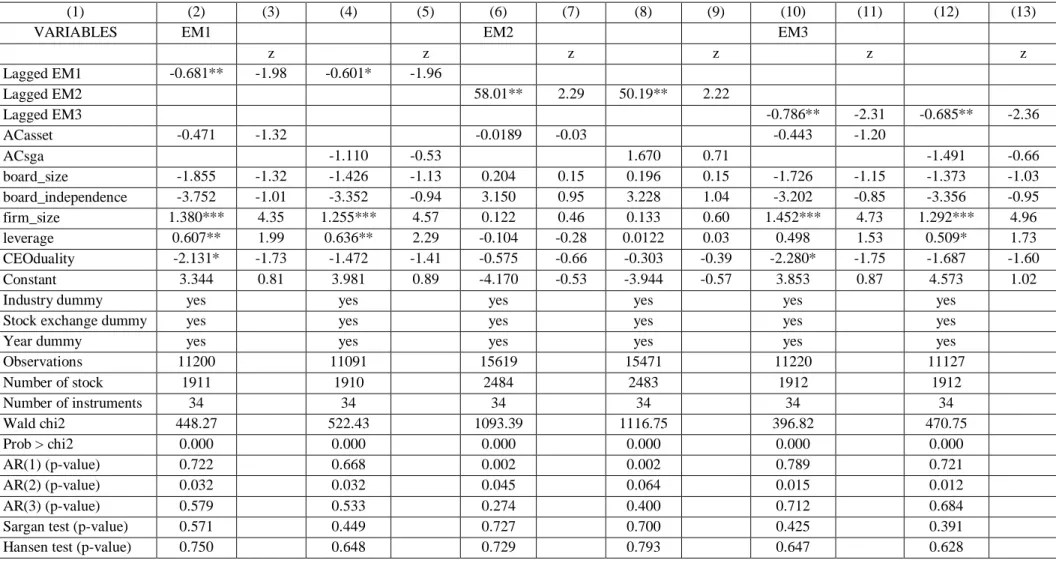
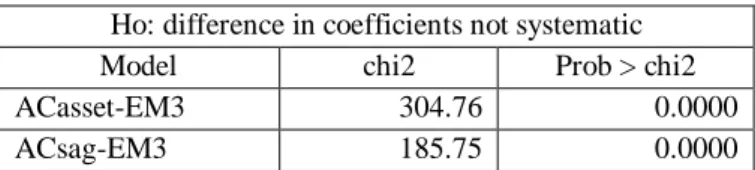
However, the results based on the dynamic model show that none of the EM proxies have a significant influence on AC. To check the robustness of the estimates from Table 9 and Table 10, we reestimated our model according to Jiraporn et al. 2008) and use EM as the dependent variables, with AC and other CG variables as explanatory variables. The results of adjusted model using dynamic two-step system GMM are reported in Table 11.
Concluding Remarks
Second, we add new empirical evidence to support the growing literature on the concerns of endogeneity issues in corporate governance studies. Agency costs, corporate governance mechanisms and ownership structure in large UK listed companies: A panel data analysis. The effectiveness of principle-based corporate governance practices and corporate financial performance: An empirical investigation.
EM3 Discretionary accruals estimated using the cross-sectional approach (absolute value) board_size Natural log of the total number of directors on the board. Industry type A dummy variable for each of five industries: property, conglomerates, industries, trade and utilities. A dummy variable for each type of stock market, including the Shanghai Stock Exchange share, the Shenzhen Stock Exchange share, and the GEM5.
For interpretation purposes, the logarithmic form of the variables is not used as a basis for descriptive statistics. Rejection of the null hypothesis of the Breusch-Pagan/Cook-Weisberg test for heteroscedasticity suggests the presence of heteroscedasticity, and pooled OLS is suboptimal. Note: This table shows the result of the dynamic two-step GMM regression of AC on lagged AC, EM proxies, and other control variables.
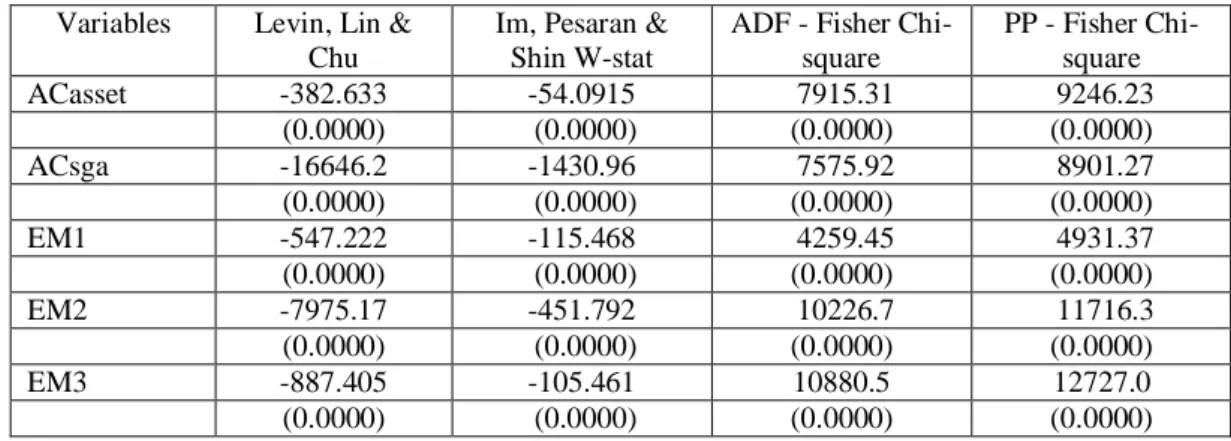
Note: This table reports the result of the dynamic two-stage system GMM regression of AC (ie, ACasset and ACsga) on lagged AC, EM proxy, and other control variables. Note: This table reports the result of the dynamic two-stage system GMM regression of EM (ie, EM1, EM2, and EM3) on lagged EM, AC proxies, and other control variables. Note: This table shows the result of unit root test on the basis of levels.
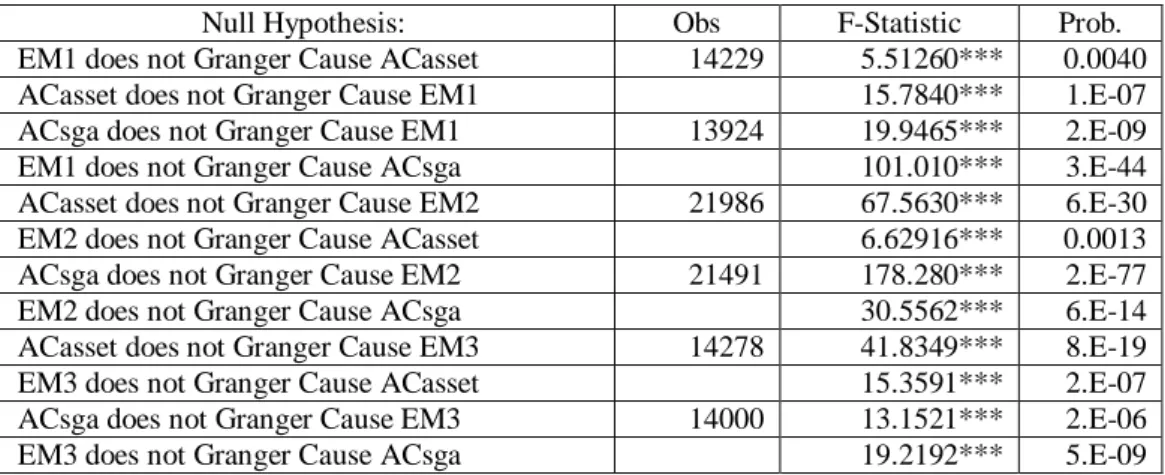
Note: This table reports the result of the Granger causality test between EM1 and AC proxies.