Avondale University Avondale University
ResearchOnline@Avondale ResearchOnline@Avondale
Nursing and Health Creative Works School of Nursing and Health
2015
Tasmanian Acute Public Hospitals Healthcare Associated Tasmanian Acute Public Hospitals Healthcare Associated Infection Surveillance Report 26 - Annual Report 2014-2015 Infection Surveillance Report 26 - Annual Report 2014-2015
Anne Wells
Department of Health and Human Services TAS Fiona Wilson
Department of Health and Human Services TAS Alistair McGregor
Department of Health and Human Services TAS Brett G. Mitchell
Avondale College of Higher Education, [email protected]
Follow this and additional works at: https://research.avondale.edu.au/nh_creativeworks Part of the Other Medicine and Health Sciences Commons
Recommended Citation Recommended Citation
Wells, A., Wilson, F., McGregor, A., & Mitchell, B. (2015). Tasmanian Acute Public Hospitals Healthcare Associated Infection Report No 26 – Annual Report 2014- 2015. Hobart, Australia: Department of Health and Human Services.
This Research Report is brought to you for free and open access by the School of Nursing and Health at ResearchOnline@Avondale. It has been accepted for inclusion in Nursing and Health Creative Works by an authorized administrator of ResearchOnline@Avondale. For more information, please contact
Tasmanian Acute Public Hospitals
Healthcare Associated Infection Surveillance Report
Report 26 – Annual Report 2014-2015
2 Tasmanian Acute Public Hospitals Healthcare Associated Infection Surveillance Report Public Health Services
Department of Health and Human Services, Tasmania Published 2015
Copyright—Department of Health and Human Services
Permission to copy is granted provided the source is acknowledged
Editors
Ms Anne Wells, TIPCU
Ms Fiona Wilson, TIPCU
Dr Alistair McGregor, TIPCU
Dr Brett Mitchell, Avondale College, Faculty of Nursing and Health, Wahroonga, NSW Suggested reference: Wells, A., Wilson, F., McGregor, A., Mitchell, B. (2015). Tasmanian Acute Public Hospitals Healthcare Associated Infection Report No 25 – Quarter 1 2015. Hobart:
Department of Health and Human Services.
Peer reviewed and approved by the Tasmanian Healthcare Associated Infection Advisory Committee and the Acting Director of Public Health, DHHS Tasmania.
Notes
Data from previous reports should not be relied upon. Use the most up to date report when quoting/using data.
Tasmanian Infection Prevention and Control Unit Public Health Services
Department of Health and Human Services GPO Box 125 Hobart 7001
www.dhhs.tas.gov.au/tipcu
[email protected] hs.tas.gov.au
3
Contents
Index of figures and tables 4
Progress 6
Staphylococcus aureus bacteraemia (SAB) 8
Tasmanian rates 8
Hospital rates 10
HCA SAB related to MSSA or MRSA 11
HCA SAB related to IV devices 12
Clostridium difficile infection 14
Tasmanian rates 14
Hospital rates – by quarter 16
Hospital rates – by financial year 17
Vancomycin resistant enterococcus (VRE) 18
Hand hygiene compliance data 20
Tasmanian rates 20
Antibiotic utilisation surveillance 23
Hospital rates 24
Appendix 1 29
Explanatory notes 29
Appendix 2 32
Staphylococcus aureus bacteraemia (SAB) 32
Clostridium difficile infection (CDI) 35
Vancomycin resistant enterococcus (VRE) data 38
Hand hygiene compliance data June 2015 39
4
Index of figures and tables
Figure 1 Healthcare associated Staphylococcus aureus bacteraemia rate by quarter. ... 8
Figure 2 Healthcare associated Staphylococcus aureus bacteraemia rate by financial year ... 9
Figure 3 Healthcare associated Staphylococcus aureus bacteraemia - rate by quarter. ... 10
Figure 4 Healthcare associated Staphylococcus aureus bacteraemia - rate by financial year. ... 10
Figure 5 Health care associated MSSA and MRSA SAB – number by financial year ... 11
Figure 6 Total IV device related HCA – SAB – number by financial year ... 12
Figure 7 Community associated CA-SAB – number and incidence/100 000 population ... 13
Figure 8 Community associated CA-SAB – number of MSSA and MRSA/financial year ... 13
Figure 9 Hospital identified and HCA-HCF CDI - rate by quarter. ... 14
Figure 10 Hospital identified and HCA-HCF CDI - rate by financial year. ... 15
Figure 11 Hospital identified CDI by quarter ... 16
Figure 12 HCA-HCF CDI by quarter ... 16
Figure 13 Individual hospital identified CDI by financial year ... 17
Figure 14 Individual hospital HCA-HCF CDI by financial year ... 17
Figure 15 New VRE isolates by quarter ... 18
Figure 16 New VRE isolates by financial year ... 19
Figure 17 Hand hygiene compliance in Tasmanian public hospitals ... 20
Figure 18 Hand hygiene compliance by moment ... 21
Figure 19 Hand hygiene compliance by healthcare worker ... 22
Figure 20 Cephalosporin use – Royal Hobart Hospital ... 24
Figure 21 Fluoroquinolone use – Royal Hobart Hospital ... 24
Figure 22 Cephalosporin use – Launceston General Hospital ... 25
Figure 23 Fluoroquinolone use – Launceston General Hospital ... 25
Figure 24 Cephalosporin use – Mersey Community Hospital ... 26
Figure 25 Fluoroquinolone use – Mersey Community Hospital ... 26
Figure 26 Cephalosporin use – North West Regional Hospital ... 27
Figure 27 Fluoroquinolone use – North West Regional Hospital ... 27
Table 1 Tasmanian numbers and rate/10 000 patient days of HCA-SAB. ... 32
Table 2 Royal Hobart Hospital numbers and rates/10 000 patient days of HCA-SAB. ... 33
Table 3 Launceston General Hospital numbers and rates/10 000 patient days of HCA-SAB . ... 33
Table 4 Mersey Community Hospital numbers and rates/10 000 patient days of HCA-SAB. ... 34
Table 5 North West Regional Hospital numbers and rates/10 000 patient days of HCA-SAB. ... 34
Table 6 Tasmanian numbers and rates/10 000 patient days of CDI. ... 35
Table 7 Hospital numbers and rates/10 000 patient days of hospital identified CDI. ... 36
Table 8 Hospital numbers and rates/10 000 patient days of HCA-HCF CDI. ... 37
Table 9 VRE isolates identified per quarter. ... 38
Table 10 Hand hygiene compliance rates by Tasmanian hospital and state level ... 39
Table 11 Tasmanian hand hygiene compliance rates by moment ... 39
Table 12 Tasmanian hand hygiene compliance rates by healthcare worker ... 40
Exec
This ann associate Tasmani The TIP including validatio Any form adjusted Tasmani The raw Compar detail, su following
T
T
T
‘h co
T
T pr
A ce
Ms Ann Assistan
cutive
nual report p ed infection ian Infection CU website g the rationa on and analys m of compar d for patient ian populatio w data in the red to the qu uch as infect
g findings.
he rate of he here has bee he number a healthcare as
ompared to he numbers here remain ractice, in so All hospitals h
ent.
ne Wells nt Director o
e summ
provides an o surveillance.
Prevention (www.dhhs.
ale for the in sis.
rison betwee characterist on and small
appendices uarterly repo
ion rates by ealthcare ass en a small de and rate of b sociated-hea 2013-14.
of new isola s room for i ome Tasmani have a hand h
of Nursing, T
mary
overview of t . This comple
and Control .tas.gov.au/ti dicators surv en hospitals s ics that vary number of e illustrates th orts publishe financial yea sociated Stap ecrease in the both ‘hospita
althcare facili ates of VRE h mprovement ian acute car hygiene com
TIPCU
the Tasmania ements the q l Unit (TIPC pcu) contain veyed and th should be do between ho events can re his.
ed by the TIP ar and antimi
phylococcus au e number of l identified C ity onset (HC have increase
t in the judic re settings.
pliance rate
an acute pub quarterly sur U) has been ns details of t he methodol one with cau ospitals. Furt esult in volat PCU, this rep
crobial use.
ureus bactera f community Clostridium dif
CA-HCF) CD ed over the f cious use of above the N
Dr Alistair Specialist M
blic hospitals rveillance dat publishing si the surveillan
ogies used in tion because her, the relat tility of rates port contains This report aemia (SAB) associated S fficile infectio DI, are lowe first two mo antibiotics, in National Benc
r McGregor edical Adviso
s’ healthcare ata reports th
ince March 2 nce program n data collec e data are no atively small
from time t s some addit contains the remains low SAB during 2 on (CDI)’ an er in 2014-15 onths of 2015
n line with b chmark of 70
r
or, TIPCU
5 hat the 2009.
m, ction,
ot to time.
tional e w.
2014-15.
nd 5
5.
best 0 per
6
Progress
The past year has seen a continuation of work in the area of infection prevention and control in Tasmania. This work is in line with the overarching objectives detailed in the ‘Strategy for the prevention and control of healthcare associated infection in Tasmania 2013 – 2015’.
The TIPCU review was undertaken in 2014 to specifically examine the role and function,
accountabilities, key relationships and appropriate resourcing of TIPCU. The findings of the review indicate there is strong support for the maintenance of the current TIPCU service and a desire for further enhancement and expansion in some areas.
The strategy will expire at the end of 2015 and with the move to One Health System from 1 July 2015 it is a good time to review and re-set the goals and objectives for infection prevention and control in Tasmania. The recommendations from the TIPCU Review will inform the new Infection Prevention and Control Strategy to be published in 2016.
2014-15 TIPCU achievements of particular note include:
Governance
review and updating of statewide infection prevention and control policies, procedures and protocols for those working in the DHHS
ongoing involvement with work undertaken by the Australian Commission of Safety & Quality in Healthcare
provision of advice in relation to the Tasmanian response to the threats associated with Ebola and Middle East Respiratory Syndrome (MERS)
submission on behalf of Tasmania infection control stakeholders during the development of the One Health System
Closer organisational links with the Communicable Diseases Prevention Unit (CDPU) within Public Health Services.
Education and Training
provision of infection prevention and control education and training programs in acute, non- acute, aged care and mental health settings as well as for ambulance Tasmania and the TAFE Enrolled Nurse program
facilitation of a Healthcare Associated Infection Surveillance Workshop and Seminar on the newly published Australian/New Zealand Standard for Cleaning, Disinfection and Sterilisation
access to and development of online training resources for acute, non-acute and rural hospital settings
review of a range of guidance and information for healthcare workers and the public on key issues related to healthcare associated infections.
7
Progress (continued)
Surveillance
implementation and continuation of surveillance programs based on nationally agreed methodology and Tasmanian notifiable microorganisms
provision of an environmental cleaning assessment program
provision of process surveillance modules for non-acute healthcare settings including an antimicrobial use surveillance module for rural hospitals and non-acute settings.
8
Staphylococcus aureus bacteraemia (SAB)
Staphylococcus aureus, a common cause of serious healthcare associated bloodstream infection, causes significant patient morbidity and has an estimated mortality of around 25-30 per cent. Many healthcare associated Staphylococcus aureus bloodstream infections (SAB) are preventable.
Staphylococcus aureus bacteraemia was made a notifiable condition in Tasmania in 2008 pursuant to the Public Health Act 1997. Tasmania is the first and only Australian jurisdiction to introduce this measure.
Surveillance of SAB is carried out in Tasmania using the nationally agreed surveillance definitions published by the Australian Commission on Safety and Quality in Health Care (ACSQHC). Under this definition a SAB is defined as healthcare associated if the patient’s first SAB positive blood culture was collected either >48 hours after hospital admission or <48 hours after discharge
(Criterion A) OR 2) ≤48 hours after hospital admission and one of four key clinical criteria was met (Criterion B).
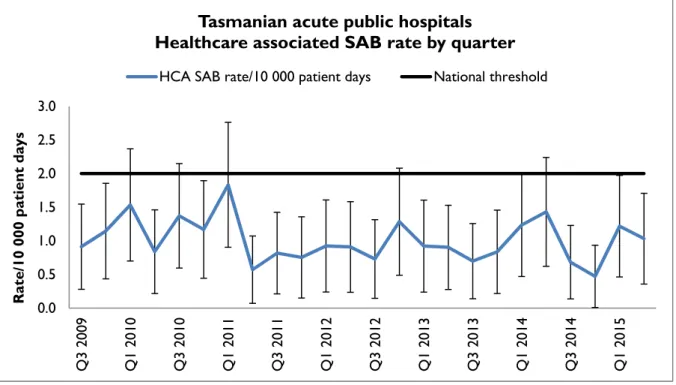
The National Healthcare Agreement (2011) target is no more than two HCA SAB/10 000 patient days.
Tasmanian rates
Figure 1 and Figure 2 presents the Tasmanian combined acute public hospital rates of healthcare associated Staphylococcus aureus bacteraemia (HCA SAB) by quarter and by financial year.
Figure 1 Healthcare associated Staphylococcus aureus bacteraemia rate by quarter
0.0 0.5 1.0 1.5 2.0 2.5 3.0
Q3 2009 Q1 2010 Q3 2010 Q1 2011 Q3 2011 Q1 2012 Q3 2012 Q1 2013 Q3 2013 Q1 2014 Q3 2014 Q1 2015
Rate/10 000 patient days
Tasmanian acute public hospitals Healthcare associated SAB rate by quarter
HCA SAB rate/10 000 patient days National threshold
9 Figure 2 Healthcare associated Staphylococcus aureus bacteraemia rate by financial year
The rate of healthcare associated Staphylococcus aureus bacteraemia for Q2 2015 was one per 10 000 patient days (95 per cent CI 0.4 – 1.7) and the rate of healthcare associated
Staphylococcus aureus bacteraemia for 2014-15 was 0.8 per 10 000 patient days (95 per cent CI 0.5-1.2).
The quarterly and annual Tasmanian combined acute public hospital HCA SAB rates remain less than the National Healthcare Agreement target of no more than two HCA SAB/10 000 patient days.
0.0 0.5 1.0 1.5 2.0 2.5
2009-10 2010-11 2011-12 2012-13 2013-14 2014-15
Rate/10 000 patient days
Tasmanian acute public hospitals
Healthcare associated SAB rate by financial year
HCA SAB rate/10 000 patient days National threshold
10
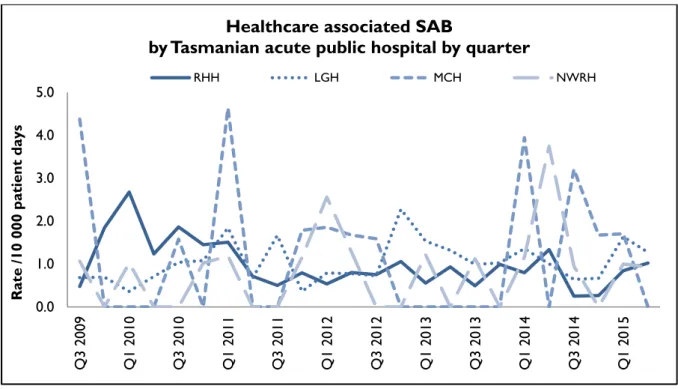
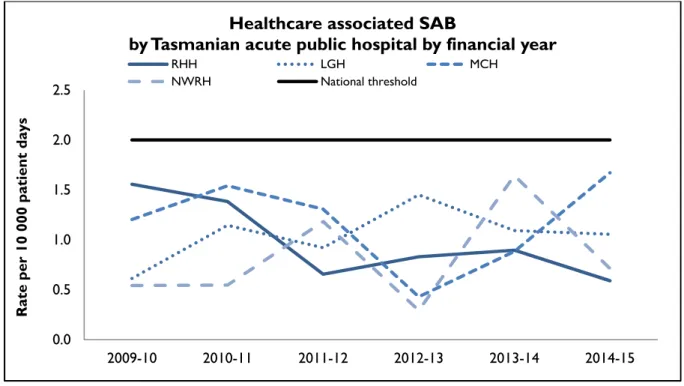
Hospital rates
Figure 3 and Figure 4 present the individual acute public hospitals rates of healthcare associated Staphylococcus aureus bacteraemia. This information is also contained in tables within the appendix.
Figure 3 Healthcare associated Staphylococcus aureus bacteraemia - rate by quarter
Figure 4 Healthcare associated Staphylococcus aureus bacteraemia - rate by financial year
During 2014-15 all of the larger public hospitals had annual HCA SAB rates below the National Healthcare Agreement target of no more than two HCA SAB/10 000 patient days.
0.0 1.0 2.0 3.0 4.0 5.0
Q3 2009 Q1 2010 Q3 2010 Q1 2011 Q3 2011 Q1 2012 Q3 2012 Q1 2013 Q3 2013 Q1 2014 Q3 2014 Q1 2015
Rate /10 000 patient days
Healthcare associated SAB
by Tasmanian acute public hospital by quarter
RHH LGH MCH NWRH
0.0 0.5 1.0 1.5 2.0 2.5
2009-10 2010-11 2011-12 2012-13 2013-14 2014-15
Rate per 10 000 patient days
Healthcare associated SAB
by Tasmanian acute public hospital by financial year
RHH LGH MCH
NWRH National threshold
11
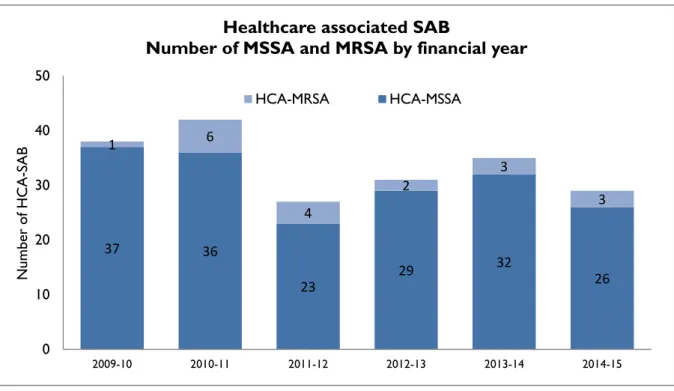
HCA SAB related to MSSA or MRSA
Figure 5 presents HCA-SAB numbers caused by methicillin sensitive Staphylococcus aureus (HCA- MSSA) and methicillin resistant Staphylococcus aureus (HCA-MRSA) by financial year.
Figure 5 Healthcare associated MSSA and MRSA SAB – number by financial year
The number of HCA- MRSA SAB remains low and has remained stable over the past three years.
37 36
23
29 32
26
1 6
4
2
3
3
0 10 20 30 40 50
2009-10 2010-11 2011-12 2012-13 2013-14 2014-15
Number of HCA-SAB
Healthcare associated SAB
Number of MSSA and MRSA by financial year
HCA-MRSA HCA-MSSA
12
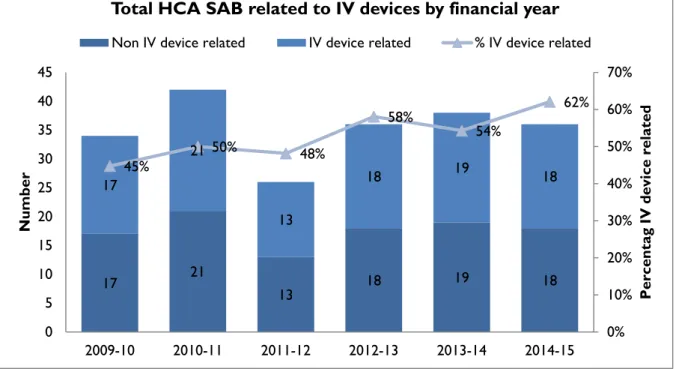
HCA SAB related to IV devices
Healthcare associated SAB are classified where possible into four categories. These classify whether the HCA SAB was related to an indwelling device, a surgical wound infection, invasive
instrumentation or neutropenia. TIPCU reports annually on all HCA SAB related to one type of indwelling device – intravenous devices (IV devices). Figure 6 presents the number and percentage of IV device related HCA SAB.
Figure 6 Total IV device related HCA – SAB – number and percentage by financial year
The number of HCA SAB secondary to an IV device has remained stable over the past few years but the overall proportion has been increasing.
This is an area where infection prevention strategies such as intravenous device management procedures and processes, in conjunction with aseptic technique, can reduce the risk of patients developing a SAB secondary to an IV device. These strategies should be implemented and evaluated n all healthcare settings where IV devices are used.
17 21
13 18 19 18 17
21
13
18 19 18 45%
50% 48%
58% 54%
62%
0%
10%
20%
30%
40%
50%
60%
70%
0 5 10 15 20 25 30 35 40 45
2009-10 2010-11 2011-12 2012-13 2013-14 2014-15
Percentag IV device related
Number
Total HCA SAB related to IV devices by financial year
Non IV device related IV device related % IV device related
13
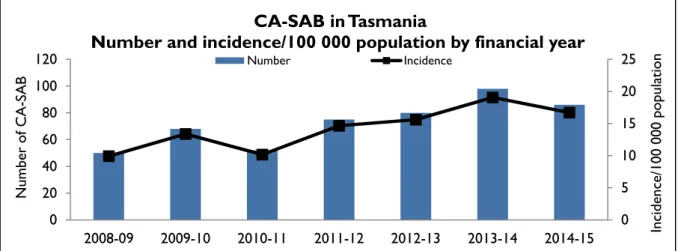
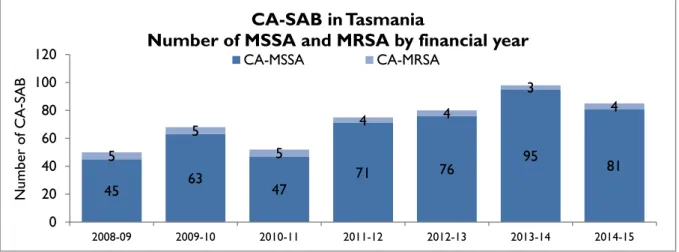
Community associated SAB
Figure 7 and Figure 8 present the Tasmanian number and incidence/100 000 population of community associated SAB (CA-SAB) by financial year and presents CA-SAB numbers caused by methicillin sensitive Staphylococcus aureus (CA-MSSA) and methicillin resistant Staphylococcus aureus (CA-MRSA).
Figure 7 Community associated CA-SAB – number and incidence/100 000 population
Figure 8 Community associated CA-SAB – number of MSSA and MRSA/financial year
There has been a small decrease in both the number and rates of community associated SAB during 2014-15 compared to 2013-14. The reasons for the earlier increase in community associated SAB, particularly in 2013-14, are unclear, but do not appear to be related to an increase in one or another region, or related to an increase in a particular age group.
The number of CA-SAB caused by MRSA remains low.
It is not possible to compare rates with other jurisdictions as Tasmania is the only state/territory where SAB is a notifiable disease.
0 5 10 15 20 25
0 20 40 60 80 100 120
2008-09 2009-10 2010-11 2011-12 2012-13 2013-14 2014-15 Incidence/100 000 population
Number of CA-SAB
CA-SAB in Tasmania
Number and incidence/100 000 population by financial year
Number Incidence
45 63
47 71 76 95 81 5
5
5
4 4
3
4
0 20 40 60 80 100 120
2008-09 2009-10 2010-11 2011-12 2012-13 2013-14 2014-15
Number of CA-SAB
CA-SAB in Tasmania
Number of MSSA and MRSA by financial year
CA-MSSA CA-MRSA
14
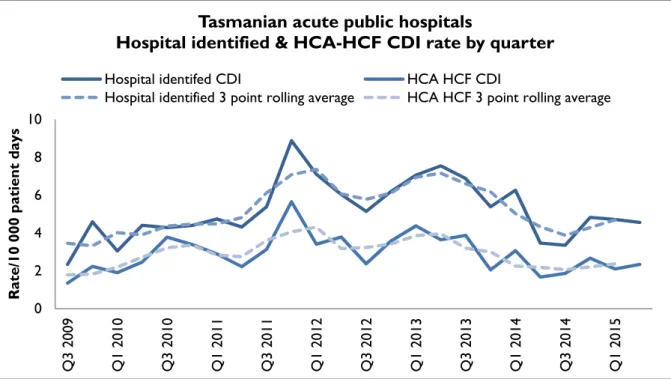
Clostridium difficile infection
Clostridium difficile infection (CDI) is a bowel infection caused by the bacterium Clostridium difficile and is a common cause of healthcare associated diarrhoea. CDI causes significant patient morbidity and mortality and can result in increased hospital stays and costs. Factors that may contribute to higher CDI rates include the overuse of antibiotics, ineffective infection control processes and suboptimal levels of environmental cleanliness.
Surveillance of CDI in Tasmania uses the ACSQHC’s nationally agreed surveillance definitions.
Hospital identified CDI are CDI infections identified in a hospital; this category includes healthcare facility and community associated infections.
Healthcare associated – healthcare facility onset (HCA-HCF) CDI are a sub-group of hospital identified cases. This category only includes infections that occurred 48 hours or more after a patient was admitted to hospital. The HCA – HCF rate excludes people who present to hospital with symptoms of CDI and/or develop symptoms within two days of admission.
TIPCU use a three point rolling average to calculate the average rate of the current and two previous quarters and uses this to show changes in trends over time. This rate will always be reported up to the end of the previous quarter. Data for the quarter are in the accompanying tables in Appendix 2.
Tasmanian rates
Figure 9 and Figure 10 presents the Tasmanian combined acute public hospital rates of hospital identified CDI and HCA-HCF CDI by quarter and by financial year.
Figure 9 Hospital identified and HCA-HCF CDI – rate by quarter
0 2 4 6 8 10
Q3 2009 Q1 2010 Q3 2010 Q1 2011 Q3 2011 Q1 2012 Q3 2012 Q1 2013 Q3 2013 Q1 2014 Q3 2014 Q1 2015
Rate/10 000 patient days
Tasmanian acute public hospitals
Hospital identified & HCA-HCF CDI rate by quarter
Hospital identifed CDI HCA HCF CDI
Hospital identified 3 point rolling average HCA HCF 3 point rolling average
15 Figure 10 Hospital identified and HCA-HCF CDI - rate by financial year.
The rate of hospital identified CDI for Q2 2015 was 4.6/10 000 patient days (95 per cent CI 3.1- 6) and the rate of HCA-HCF over the same period was 2.3/10 000 patient days (95 per cent CI 1.3-3.4).
The mean (average) rate of hospital identified CDI between 1 July 2014 and 30 June 2015 was 4.4 per 10 000 patient days (95 per cent CI 3.6-5.1) and the mean rate of HCA-HCF CDI over the same period was 2.2 per 10 000 patient days (95 per cent CI 1.7-2.8).
The number and rate of hospital identified and HCA-HCF have decreased over the past year and are at the lowest level since 2010-11.
0 2 4 6 8 10
2009 - 10 2010 - 11 2011 - 12 2012 - 13 2013 - 14 2014 - 15
Rate/10 000 patient days
Tasmanian acute public hospitals
Hosptial identifed and HCA-HCF CDI rate by financial year
Hospital identified HCA-HCF
16
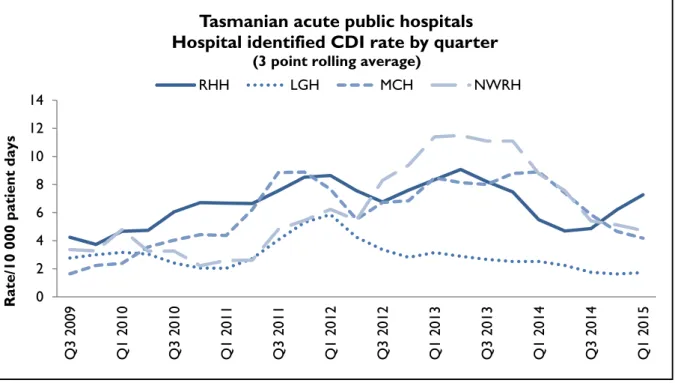
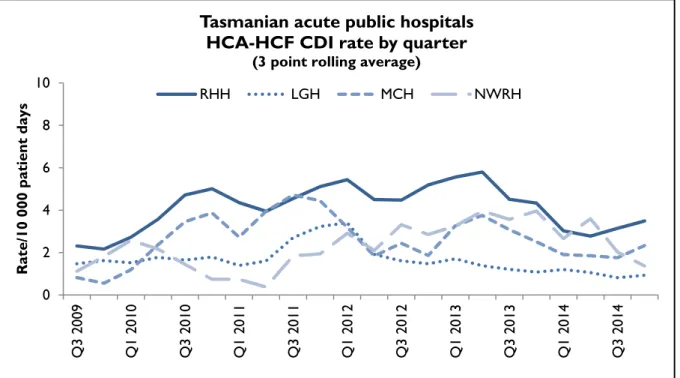
Hospital rates – by quarter
Figure 11 and Figure 12 presents the individual acute public hospital rates of hospital identified CDI and healthcare associated – healthcare facility onset (HCA-HCF) CDI by quarter.
Figure 11Hospital identified CDI by quarter
Figure 12 HCA-HCF CDI by quarter 0
2 4 6 8 10 12 14
Q3 2009 Q1 2010 Q3 2010 Q1 2011 Q3 2011 Q1 2012 Q3 2012 Q1 2013 Q3 2013 Q1 2014 Q3 2014 Q1 2015
Rate/10 000 patient days
Tasmanian acute public hospitals Hospital identified CDI rate by quarter
(3 point rolling average)
RHH LGH MCH NWRH
0 2 4 6 8 10
Q3 2009 Q1 2010 Q3 2010 Q1 2011 Q3 2011 Q1 2012 Q3 2012 Q1 2013 Q3 2013 Q1 2014 Q3 2014
Rate/10 000 patient days
Tasmanian acute public hospitals HCA-HCF CDI rate by quarter
(3 point rolling average)
RHH LGH MCH NWRH
17
Hospital rates – by financial year
Figure 13 and Figure 14 presents the individual acute public hospital rates of hospital identified CDI and healthcare associated – healthcare facility onset (HCA-HCF) CDI by financial year.
Figure 13 Individual hospital identified CDI by financial year
Figure 14 Individual hospital HCA-HCF CDI by financial year 0
2 4 6 8 10 12 14
2009 - 10 2010 - 11 2011 - 12 2012 - 13 2013 - 14 2014 - 15
Rate per 10 000 patient days
Tasmanian acute public hospitals.
Hospital identified CDI rate by financial year
RHH LGH MCH NWRH
0 2 4 6 8 10
2009 - 10 2010 - 11 2011 - 12 2012 - 13 2013 - 14 2014 - 15
Rate per 10 000 patient days
Tasmanian acute public hospitals HCA - HCF CDI rate by financial year
RHH LGH MCH NWRH
18
Vancomycin resistant enterococcus (VRE)
Enterococci are bacteria normally present in the human gastrointestinal and female genital tract.
Enterococci can cause infections of the urinary tract, bloodstream and wounds. Enterococci that have acquired resistance to the antibiotic vancomycin are called vancomycin-resistant Enterococcus or VRE. VRE infections can be more difficult to treat then those caused by vancomycin sensitive Enterococci sensitive. Factors believed to contribute to the transmission of VRE in hospitals are ineffective infection control practices, overuse of antibiotics and suboptimal environmental cleanliness.
Identification of VRE is a notifiable condition in Tasmania pursuant to the Public Health Act 1997.
The number of people newly identified with VRE within hospitals via either a clinical or screening specimen, does not necessarily reflect that VRE was acquired at that hospital. Numbers of VRE isolates identified can be affected by the amount of screening undertaken by hospitals. Some hospitals may have a more intense screening program and hence may identify more VRE.
The total number of reported cases of people newly identified with VRE includes all new cases identified within Tasmania and includes isolates from public and private hospitals, rural hospitals, GP clinics and long term and residential care facilities.
Figure 15 and Figure 16 present the total of all new VRE isolates identified within Tasmania by quarter and by financial year.
Figure 15 New VRE isolates by quarter
5 5 2 5 14 8
3 8
3 5 10 7 8 12 18 15 12 16 8 13
8 19
36 29
0 10 20 30 40
Q3 2009 Q1 2010 Q3 2010 Q1 2011 Q3 2011 Q1 2012 Q3 2012 Q1 2013 Q3 2013 Q1 2014 Q3 2014 Q1 2015
Number of new isolates
VRE in Tasmania - new isolates identified by quarter
New VRE isolates
19 Figure 16 New VRE clinical and screening isolates by financial year
There has been a large increase in newly identified VRE isolates in 2014-15 with the increase occurring from late 2014.
In 2014-15 the number of both screening and clinical detections of VRE increased. This included four blood-steam infections identified in 2014-15. The blood stream isolates appeared epidemiologically unrelated and comprised at least three different strains of VRE.
This increased identification has occurred across the State and is not solely associated with the acute public hospitals. TIPCU publish the hospital where the isolate was first identified – this does not necessarily mean VRE was acquired at that hospital.
The reasons for this increase are not clear but could be related to one or more of the following factors:
o transmission of VRE amongst hospitalised patients o VRE cases in the community presenting to hospital
o improved screening processes leading to better targeted screening o an overall increase in screening.
Management of people with VRE in acute hospitals includes using Contact Precautions – single room with ensuite (if available); staff wear gowns and gloves when caring for the patient, enhanced environmental cleaning and surveillance screening of contacts.
Further molecular typing of a number of these new isolates to identify strain similarities to better understand the epidemiology of the increase is currently being undertaken.
13
27 21
47 41
70
4
6
4
6 8
22
0 20 40 60 80 100
2009-10 2010-11 2011-12 2012-13 2013-14 2014-15
Number
VRE in Tasmania - new isolates identified by financial year Screening Clinical
20
Hand hygiene compliance data
The National Hand Hygiene Initiative was introduced in Tasmania in 2009 to increase healthcare workers hand hygiene compliance and monitor its effectiveness by measuring reductions in HCA SAB. Hand hygiene compliance is monitored by observing if healthcare workers perform hand hygiene at the appropriate times.
Tasmanian rates
Figure 17 Hand hygiene compliance in Tasmanian public hospitals
Campbell Town Hospital did not submit hand hygiene compliance data for Audit period two, 2015.
The National Hand Hygiene Compliance Benchmark is 70 per cent and this was exceeded by all of the individual participating hospitals. The overall Tasmanian public hospital rate of 79 per cent compliance was also above National Benchmark.
There are differences in the number of hand hygiene moments observed in the acute hospitals versus the rural hospitals and these numbers are presented in the tables in Appendix 2 0%
20%
40%
60%
80%
100%
Compliance (%)
Hand Hygiene Compliance by Tasmanian Public Hospital NHHI Audit Two 2015
Compliance rate National Benchmark
21 Figure 18 Hand hygiene compliance by moment
Hand hygiene compliance before touching a patient (Moment 1), undertaking a procedure (Moment 2) and after touching patient surroundings (Moment 5) are lower than those reported after undertaking a procedure (Moment 3) or after touching a patient (Moment 4).
0%
20%
40%
60%
80%
100%
Moment 1 Moment 2 Moment 3 Moment 4 Moment 5
Compliance (%)
Hand Hygiene Compliance by Moment
NHHI Audit Two 2015
22 Figure 19 Hand hygiene compliance by healthcare worker
AC Clerical DR Doctor SPC Student Personal Carer
AH Allied Health N Nurse/Midwife SDR Student Doctor
D Domestic O Other SN Student Nurse/Midwife
BL Invasive Technician PC Personal Care Staff SAH Student Allied Health
There are differences in the number of hand hygiene moments observed in in each healthcare worker group and these numbers are presented in the tables in Appendix 2.
The majority of hand hygiene compliance data (70 per cent in the latest report) is collected from nurse-patient interactions with the next highest being doctor-patient interactions (13 per cent).
61%
77%
66%
76%
62%
81%
53%
76%
64%
83%
75%
0%
20%
40%
60%
80%
100%
AC AH D BL DR N O PC SDR SN SAH
Compliance (%)
Healthcare Worker Category
Hand Hygiene Compliance by Tasmanian Public Healthcare Worker
NHHI Audit Two 2015
23
Antibiotic utilisation surveillance
Antimicrobial use is inevitably associated with the emergence of antimicrobial-resistant bacteria.
Antimicrobial resistance is a significant and growing threat to public health worldwide. The National Antimicrobial Utilisation Surveillance Program (NAUSP) began in 2004 to conduct surveillance of hospital antimicrobials, principally antibiotic use. The program enables individual institutions to examine their own antimicrobial use rates and trends over time and provides peer group
benchmarks for comparison. This data can be used to identify trends in antimicrobial use over time and develop local interventions to promote appropriate antimicrobial use.
The Royal Hobart Hospital has been contributing data to the NAUSP since July 2004 while
Launceston General Hospital, North West Regional Hospital and Mersey Community Hospital have been contributing since January 2009.
Antimicrobial utilisation rates are calculated using the number of defined daily doses (DDDs) of specific antimicrobial agents or classes consumed each month per 1 000 occupied bed days. This is the most widely accepted and used method of measuring antimicrobial use in hospital settings both nationally and internationally.
Rates presented in this report are for two antimicrobial classes: third and fourth generation
cephalosporins (ceftriaxone, cefotaxime, ceftazidime, cefepime) and fluoroquinolones (ciprofloxacin, moxifloxacin). These two classes were chosen as they are relevant to other indicators in this report.
Cephalosporin use has been linked with the emergence of MRSA while cephalosporins and fluoroquinolones have been identified as risk factors for the development of Clostridium difficile infection.
The graphs compare cephalosporin and fluoroquinolone use for each hospital with the NAUSP national rate for similarly-peer contributing hospitals.
Because Tasmanian hospitals vary in services provided, comparisons between Tasmanian hospitals are not recommended. For example, a hospital that has a dedicated cancer service may use more antimicrobials to combat infections in this susceptible patient group.
24
Hospital rates
Royal Hobart Hospital
Figure 20 Cephalosporin use – Royal Hobart Hospital
Figure 21 Fluoroquinolone use – Royal Hobart Hospital 0
20 40 60 80 100 120 140
01 Jul 2004 01 Jan 2005 01 Jul 2005 01 Jan 2006 01 Jul 2006 01 Jan 2007 01 Jul 2007 01 Jan 2008 01 Jul 2008 01 Jan 2009 01 Jul 2009 01 Jan 2010 01 Jul 2010 01 Jan 2011 01 Jul 2011 01 Jan 2012 01 Jul 2012 01 Jan 2013 01 Jul 2013 01 Jan 2014 01 Jul 2014 01 Jan 2015
DDD / 1000 bed days
Cephalosporin usage RHH - 1 Jul 2004 - 1 Apr 2015
Cephalosporin - RHH Cephalosporin - Comparator
0 20 40 60 80 100 120 140
01 Jul 2004 01 Jan 2005 01 Jul 2005 01 Jan 2006 01 Jul 2006 01 Jan 2007 01 Jul 2007 01 Jan 2008 01 Jul 2008 01 Jan 2009 01 Jul 2009 01 Jan 2010 01 Jul 2010 01 Jan 2011 01 Jul 2011 01 Jan 2012 01 Jul 2012 01 Jan 2013 01 Jul 2013 01 Jan 2014 01 Jul 2014 01 Jan 2015
DDD / 1000 bed days
Fluoroquinolone usage RHH - 1 Jul 2004 - 1 Apr 2015
Fluoroquinolone - RHH Fluoroquinolone - Comparator
25 Launceston General Hospital.
Figure 22 Cephalosporin use – Launceston General Hospital
Figure 23 Fluoroquinolone use – Launceston General Hospital 0
20 40 60 80 100 120 140
01 Jan 2009 01 Apr 2009 01 Jul 2009 01 Oct 2009 01 Jan 2010 01 Apr 2010 01 Jul 2010 01 Oct 2010 01 Jan 2011 01 Apr 2011 01 Jul 2011 01 Oct 2011 01 Jan 2012 01 Apr 2012 01 Jul 2012 01 Oct 2012 01 Jan 2013 01 Apr 2013 01 Jul 2013 01 Oct 2013 01 Jan 2014 01 Apr 2014 01 Jul 2014 01 Oct 2014 01 Jan 2015 01 Apr 2015
DDD / 1000 bed days
Cephalosporin usage LGH 1 Jan 2009 - 1 Apr 2015
Cephalosporin - LGH Cephalosporin - Comparator
0 20 40 60 80 100 120 140
01 Jan 2009 01 Apr 2009 01 Jul 2009 01 Oct 2009 01 Jan 2010 01 Apr 2010 01 Jul 2010 01 Oct 2010 01 Jan 2011 01 Apr 2011 01 Jul 2011 01 Oct 2011 01 Jan 2012 01 Apr 2012 01 Jul 2012 01 Oct 2012 01 Jan 2013 01 Apr 2013 01 Jul 2013 01 Oct 2013 01 Jan 2014 01 Apr 2014 01 Jul 2014 01 Oct 2014 01 Jan 2015 01 Apr 2015
DDD / 1000 bed days
Fluoroquinolone usage LGH 1 Jan 2009 - 1 Apr 2015
Fluoroquinolone - LGH Fluoroquinolone - Comparator
26 Mersey Community Hospital
Figure 24 Cephalosporin use – Mersey Community Hospital
Figure 25 Fluoroquinolone use – Mersey Community Hospital
0 20 40 60 80 100 120 140
01 Jan 2009 01 Apr 2009 01 Jul 2009 01 Oct 2009 01 Jan 2010 01 Apr 2010 01 Jul 2010 01 Oct 2010 01 Jan 2011 01 Apr 2011 01 Jul 2011 01 Oct 2011 01 Jan 2012 01 Apr 2012 01 Jul 2012 01 Oct 2012 01 Jan 2013 01 Apr 2013 01 Jul 2013 01 Oct 2013 01 Jan 2014 01 Apr 2014 01 Jul 2014 01 Oct 2014 01 Jan 2015 01 Apr 2015
DDD / 1000 bed days
Cephalosporin usage - Mersey Hospital 1 Jan 2009 - 1 Apr 2015
Cephalosporin - Mersey Cephalosporin - comparator
0 20 40 60 80 100 120 140
01 Jan 2009 01 Apr 2009 01 Jul 2009 01 Oct 2009 01 Jan 2010 01 Apr 2010 01 Jul 2010 01 Oct 2010 01 Jan 2011 01 Apr 2011 01 Jul 2011 01 Oct 2011 01 Jan 2012 01 Apr 2012 01 Jul 2012 01 Oct 2012 01 Jan 2013 01 Apr 2013 01 Jul 2013 01 Oct 2013 01 Jan 2014 01 Apr 2014 01 Jul 2014 01 Oct 2014 01 Jan 2015 01 Apr 2015
DDD / 1000 bed days
Fluoroquinolone usage Mersey Hospital 1 Jan 2009 - 1 Apr 2015
Fluoroquinolones - Mersey Fluoroquinolones - comparator
27 North West Regional Hospital
Figure 26 Cephalosporin use – North West Regional Hospital
Figure 27 Fluoroquinolone use – North West Regional Hospital 0
20 40 60 80 100 120 140 160 180 200 220
01 Jan 2011 01 Apr 2011 01 Jul 2011 01 Oct 2011 01 Jan 2012 01 Apr 2012 01 Jul 2012 01 Oct 2012 01 Jan 2013 01 Apr 2013 01 Jul 2013 01 Oct 2013 01 Jan 2014 01 Apr 2014 01 Jul 2014 01 Oct 2014 01 Jan 2015 01 Apr 2015
DDD / 1000 bed days
Cephalosporin usage - North West Regional Hospital 1 Jan 2011 - 1 Apr 2015
Cephalosporin - NWRH Cephalosporin - comparator
-20 0 20 40 60 80 100 120 140
01 Jan 2011 01 Apr 2011 01 Jul 2011 01 Oct 2011 01 Jan 2012 01 Apr 2012 01 Jul 2012 01 Oct 2012 01 Jan 2013 01 Apr 2013 01 Jul 2013 01 Oct 2013 01 Jan 2014 01 Apr 2014 01 Jul 2014 01 Oct 2014 01 Jan 2015 01 Apr 2015
DDD / 1000 bed days
Fluoroquinolone usage - North West Regional Hospital 1 Jan 2011 - 1 Apr 2015
Fluoroquinolones Fluoroquinolones - comparator
28
Acknowledgements
The production of this report is the culmination of data collection, analysis and input from a number of different organisations. In particular, we would like to acknowledge:
Executive Director of Nursing THS Northern Region
Executive Director of Nursing THS North West Region
Executive Director of Nursing THS Southern Region
Launceston General Hospital Infection Control Unit
North West Regional Hospital Infection Control Team
Mersey Community Hospital Infection Control Team
Royal Hobart Hospital Infection Prevention and Control Unit
The National Antimicrobial Utilisation Surveillance Program (NAUSP)
Microbiology Departments at the Royal Hobart Hospital, Launceston General Hospital and DSPL
Hand Hygiene Australia
Communicable Diseases Prevention Unit, Public Health Services
Contributing Primary Health Sites
29
Appendix 1
Explanatory notes
What healthcare associated infection indicators are used in Tasmania?
TIPCU undertakes surveillance of the following indicators.
Staphylococcus aureus bacteraemia (bloodstream infection).
Clostridium difficile infection (CDI).
Vancomycin resistant enterococci (VRE).
Hand hygiene compliance rates.
Antibiotic utilisation surveillance.
What do the rates mean?
The rates of infections presented in the TIPCU report are presented as a rate per 10 000 patient days (SAB and CDI) or as a percentage (hand hygiene compliance).
What are the definitions for Clostridium difficile infection (CDI)?
TIPCU use the national surveillance definitions published by the Australian Commission on Safety and Quality in Health Care (ACSQHC) to classify CDI. TIPCU reports on:
1. Hospital identified CDI is defined as a case diagnosed in a patient attending an acute care facility. This includes positive specimens obtained from admitted patients and those attending the emergency department and outpatient departments. This definition excludes patients less than two years old and cases with a positive test within the previous eight weeks.
2. Healthcare associated – healthcare facility onset CDI (HCA-HCF CDI) is defined as a patient with CDI symptom onset (or date and time of stool specimen collection if a laboratory system is used) more than 48 hours after admission to a healthcare facility. This definition excludes patients less than two years old and cases with a positive test within the previous 8 weeks.
30
What are the definitions for healthcare associated Staphylococcus aureus
bacteraemia (SAB)?
Criterion A the patient’s first SAB blood culture was collected more than 48 hours after hospital admission or less than 48 hours after discharge.
OR
Criterion B the patient’s first positive SAB blood culture was collected less than or equal to 48 hours after hospital admission and one or more of the following key clinical criteria was met for the patient-episode of SAB.
Key clinical criteria:
1. SAB is a complication of the presence of an indwelling medical device (eg Intravascular line, haemodialysis vascular access, CSF shunt, urinary catheter).
2. SAB occurs within 30 days of a surgical procedure where the SAB is related to the surgical site.
3. SAB was diagnosed within 48 hours of a related invasive instrumentation or incision.
4. SAB is associated with neutropenia (less 1 x 10⁹/L) contributed to by cytotoxic therapy.
What are the definitions for vancomycin resistant enterococci (VRE)?
The definition for VRE is an isolate identified as VRE by an accredited laboratory. TIPCU reports on the total number of people with new isolates of VRE identified in Tasmania per quarter and this number includes all people with new VRE isolates from public and private hospitals, rural hospitals, GP clinics and long term and residential care facilities.
Confidence intervals
Confidence intervals are used to calculate the range in which the true rate probably lies. As an example, when looking at the hand hygiene compliance (HHC) data “confidence intervals calculate the range in which the true compliance result lies, based on the data collected and the compliance measured, thus providing an indication of the reliability of the reported HHC level. When only a small number of moments are collected, the confidence interval will be larger, as it is more difficult to establish the true compliance level from a small sample of moments. If a large number of
moments are collected the confidence interval will be smaller, meaning the reliability of the result is higher. Hand Hygiene Australia (HHA) calculate 95 per cent confidence intervals, indicating the intervals in which 95 per cent of the time the true compliance level lies.” (HHA 2011)
Patient care days
Patient days is the term to explain the total days patients are in hospital. In each of Tasmania’s four larger acute public hospitals there are around 330 000 patient care days a year. When a rate is presented as a number per 10 000 patient days this presents the number of infections that occur for every 10 000 patient care days.
31
Can I compare Tasmanian hospital infection rates?
It is important to be wary when comparing data between hospitals. Each Tasmanian hospital provides different services and has patients with different levels of illness. This affects infection rates. For example, very sick immuno-compromised patients may be more likely to get infections. It is difficult to remove all of the factors outside the control of a hospital that can cause its infection rate to differ from other hospitals.
Other reasons for caution when comparing hospitals include:
some hospitals may screen patients more than others. This can affect rates for CDI and VRE
hospital laboratories may use different ways of identifying organisms. A laboratory that has a very sensitive way of looking for organisms may find more
for hand hygiene, rural hospitals do not collect as much data as the four acute public hospitals, so comparisons between rural and acute hospitals are not recommended.
32
Appendix 2
Staphylococcus aureus bacteraemia (SAB)
Data that classifies healthcare associated Staphylococcus aureus bacteraemia into Criterion A (>48 after admission or <48 hours after discharge) OR Criterion B (≤ 48 hours after hospital admission and one of more key clinical criteria met) is available upon request.
Table 1 Tasmanian numbers and rate/10 000 patient days of healthcare associated SAB (HCA-SAB).
Quarter Total HCA-SAB Number MSSA Number MRSA HCA SAB Rate
Q3 2009 8 7 1 0.9
Q4 2009 10 10 0 1.1
Q1 2010 13 13 0 1.5
Q2 2010 7 7 0 0.8
Q3 2010 12 11 1 1.4
Q4 2010 10 7 3 1.2
Q1 2011 15 13 2 1.8
Q2 2011 5 5 0 0.6
Q3 2011 7 7 0 0.8
Q4 2011 6 4 2 0.8
Q1 2012 7 6 1 0.9
Q2 2012 7 6 1 0.9
Q3 2012 6 6 0 0.7
Q4 2012 10 9 1 1.3
Q1 2013 7 7 0 0.9
Q2 2013 8 7 1 0.9
Q3 2013 6 6 0 0.7
Q4 2013 7 7 0 0.8
Q1 2014 10 9 1 1.2
Q2 2014 12 10 2 1.4
Q3 2014 6 6 0 0.7
Q4 2014 4 4 0 0.5
Q1 2015 10 9 1 1.2
Q2 2015 9 7 2 1.0
33 Table 2 Royal Hobart Hospital numbers and rates/10 000 patient days of HCA-SAB
Quarter Total HCA-SAB Number MSSA Number MRSA HCA SAB Rate Q3 2009 2 2 0 0.5
Q4 2009 8 8 0 1.8 Q1 2010 11 11 0 2.7 Q2 2010 5 5 0 1.2 Q3 2010 8 7 1 1.9 Q4 2010 6 5 1 1.4 Q1 2011 6 4 2 1.5 Q2 2011 3 3 0 0.7 Q3 2011 2 2 0 0.5 Q4 2011 3 2 1 0.8 Q1 2012 2 2 0 0.5 Q2 2012 3 3 0 0.8 Q3 2012 3 3 0 0.8 Q4 2012 4 4 0 1.1 Q1 2013 2 2 0 0.6 Q2 2013 4 4 0 0.9 Q3 2013 2 2 0 0.5 Q4 2013 4 4 0 1.0 Q1 2014 3 3 0 0.8 Q2 2014 5 4 1 1.3 Q3 2014 1 1 0 0.3 Q4 2014 1 0 0 0.3 Q1 2015 3 2 1 0.8 Q2 2015 4 4 0 1.0
Table 3 Launceston General Hospital numbers and rates/10 000 patient days of HCA-SAB
Quarter Total HCA-SAB Number MSSA Number MRSA HCA SAB Rate Q3 2009 2 1 1 0.7
Q4 2009 2 2 0 0.7 Q1 2010 1 1 0 0.4 Q2 2010 2 2 0 0.7 Q3 2010 3 3 0 1.0 Q4 2010 3 1 2 1.1 Q1 2011 5 5 0 1.8 Q2 2011 2 2 0 0.7 Q3 2011 5 5 0 1.7 Q4 2011 1 1 0 0.4 Q1 2012 2 1 1 0.8 Q2 2012 2 2 0 0.8 Q3 2012 2 2 0 0.7 Q4 2012 6 5 1 2.3 Q1 2013 4 4 0 1.5 Q2 2013 4 3 1 1.3 Q3 2013 3 3 0 1.0 Q4 2013 3 3 0 1.0 Q1 2014 4 4 0 1.4 Q2 2014 3 2 1 1.0 Q3 2014 2 2 0 0.6 Q4 2014 2 2 0 0.7 Q1 2015 5 5 0 1.6 Q2 2015 4 2 2 1.3
34 Table 4 Mersey Community Hospital numbers and rates/10 000 patient days of HCA-SAB
Quarter Total HCA-SAB Number MSSA Number MRSA HCA SAB Rate Q3 2009 3 3 0 4.4
Q4 2009 0 0 0 0.0 Q1 2010 0 0 0 0.0 Q2 2010 0 0 0 0.0 Q3 2010 1 1 0 1.6 Q4 2010 0 0 0 0.0 Q1 2011 3 3 0 4.6 Q2 2011 0 0 0 0.0 Q3 2011 0 0 0 0.0 Q4 2011 1 0 1 1.8 Q1 2012 1 1 0 1.9 Q2 2012 1 1 0 1.7 Q3 2012 1 1 0 1.6 Q4 2012 0 0 0 0.0 Q1 2013 0 0 0 0.0 Q2 2013 0 0 0 0.0 Q3 2013 0 0 0 0.0 Q4 2013 0 0 0 0.0 Q1 2014 2 2 0 3.9 Q2 2014 0 0 0 0.0 Q3 2014 2 2 0 3.2 Q4 2014 1 1 0 1.7 Q1 2015 1 1 0 1.7 Q2 2015 0 0 0 0.0
Table 5 North West Regional Hospital numbers and rates/10 000 patient days of HCA-SAB.
Quarter Total HCA-SAB Number MSSA Number MRSA HCA SAB Rate Q3 2009 1 1 0 1.1
Q4 2009 0 0 0 0.0 Q1 2010 1 1 0 1.0 Q2 2010 0 0 0 0.0 Q3 2010 0 0 0 0.0 Q4 2010 1 1 0 1.0 Q1 2011 1 1 0 1.2 Q2 2011 0 0 0 0.0 Q3 2011 0 0 0 0.0 Q4 2011 1 1 0 1.2 Q1 2012 2 2 0 2.6 Q2 2012 1 0 1 1.3 Q3 2012 0 0 0 0.0 Q4 2012 0 0 0 0.0 Q1 2013 1 1 0 1.2 Q2 2013 0 0 0 0.0 Q3 2013 1 1 0 1.1 Q4 2013 0 0 0 0.0 Q1 2014 1 0 1 1.2 Q2 2014 4 4 0 3.7 Q3 2014 1 1 0 1.0 Q4 2014 0 0 0 0.0 Q1 2015 1 1 0 1.0 Q2 2015 1 1 0 0.9
35
Clostridium difficile infection (CDI)
Table 6 Tasmanian numbers and rates/10 000 patient days of CDI Quarter Total hospital
identified CDI
Rate Total HCA HCF Rate
Q3 2009 19 2.3 11 1.4
Q4 2009 37 4.6 18 2.2
Q1 2010 24 3.0 15 1.9
Q2 2010 34 4.4 19 2.5
Q3 2010 34 4.3 30 3.8
Q4 2010 35 4.4 27 3.4
Q1 2011 35 4.7 22 2.9
Q2 2011 35 4.3 18 2.2
Q3 2011 43 5.4 25 3.1
Q4 2011 66 8.9 42 5.6
Q1 2012 50 7.1 24 3.4
Q2 2012 43 6.0 27 3.8
Q3 2012 39 5.1 18 2.4
Q4 2012 45 6.2 26 3.6
Q1 2013 50 7.1 31 4.4
Q2 2013 57 7.5 27 3.6
Q3 2013 55 6.9 31 3.9
Q4 2013 42 5.4 16 2.1
Q1 2014 47 6.3 23 3.1
Q2 2014 27 3.5 13 1.7
Q3 2014 27 3.4 15 1.9
Q4 2014 38 4.8 21 2.7
Q1 2015 36 4.7 16 2.1
Q2 2015 37 4.6 19 2.3
36 Table 7 Hospital numbers and rates/10 000 patient days of hospital identified CDI
Quarter Royal Hobart Launceston General
Mersey Community
NW Regional Total Rate Total Rate Total Rate Total Rate
Q3 2009 8 2.1 9 3.3 1 1.6 1 1.1
Q4 2009 25 6.4 6 2.2 1 1.7 5 5.8
Q1 2010 10 2.7 9 3.5 2 3.5 3 3.1
Q2 2010 18 4.9 10 3.8 1 1.9 5 5.6
Q3 2010 25 6.7 5 1.9 3 5.1 1 1.1
Q4 2010 25 6.6 4 1.5 3 4.9 3 3.1
Q1 2011 25 6.9 7 2.8 2 3.3 2 2.4
Q2 2011 25 6.5 5 1.8 3 4.9 2 2.2
Q3 2011 24 6.5 10 3.6 6 10.8 3 3.2
Q4 2011 34 9.8 18 7.0 6 11.5 8 9.4
Q1 2012 32 9.4 13 5.5 2 4.0 3 3.9
Q2 2012 23 6.7 12 5.0 4 7.3 4 5.2
Q3 2012 24 6.6 6 2.4 3 5.1 6 7.3
Q4 2012 24 6.9 7 2.8 4 7.9 10 12.3
Q1 2013 31 9.4 8 3.3 4 7.7 7 8.6
Q2 2013 32 8.7 9 3.4 5 9.8 11 13.2
Q3 2013 34 9.1 6 2.1 4 7.0 11 12.5
Q4 2013 25 6.8 7 2.6 4 7.3 6 7.3
Q1 2014 22 6.4 8 2.9 6 12.5 11 13.2
Q2 2014 11 3.2 6 2.1 4 7.3 6 6.1
Q3 2014 16 4.5 5 1.7 2 3.4 4 4.1
Q4 2014 24 6.9 4 1.4 4 7.1 6 5.9
Q1 2015 24 7.4 5 1.7 2 3.6 5 5.3
Q2 2015 27 7.5 6 2.0 1 1.8 3 3.0
37 Table 8 Hospital numbers and rates/10 000 patient days of HCA-HCF CDI
Quarter Royal Hobart Launceston General
Mersey Community
NW Regional Total Rate Total Rate Total Rate Total Rate
Q3 2009 6 1.6 5 1.8 0 0.0 0 0.0
Q4 2009 12 3.1 3 1.1 1 1.7 2 2.3
Q1 2010 7 1.9 5 1.9 0 0.0 3 3.1
Q2 2010 12 3.3 4 1.5 1 1.9 2 2.2
Q3 2010 21 5.6 5 1.9 3 5.1 1 1.1
Q4 2010 20 5.3 4 1.5 2 3.2 1 1.0
Q1 2011 15 4.1 5 2.0 2 3.3 0 0.0
Q2 2011 14 3.7 2 0.7 1 1.6 1 1.1
Q3 2011 15 4.1 6 2.1 4 7.2 0 0.0
Q4 2011 21 6.0 14 5.4 3 5.8 4 4.7
Q1 2012 18 5.3 5 2.1 0 0.0 1 1.3
Q2 2012 17 5.0 6 2.5 2 3.6 2 2.6
Q3 2012 12 3.3 3 1.2 1 1.7 2 2.4
Q4 2012 18 5.2 3 1.2 1 2.0 4 4.9
Q1 2013 24 7.2 5 2.1 1 1.9 1 1.2
Q2 2013 16 4.4 5 1.9 3 5.9 3 3.6
Q3 2013 22 5.9 1 0.4 2 3.5 6 6.8
Q4 2013 12 3.2 4 1.5 0 0.0 0 0.0
Q1 2014 13 3.8 4 1.4 2 4.2 4 4.8
Q2 2014 7 2.0 2 0.7 1 1.8 3 3.1
Q3 2014 9 2.5 3 1.0 0 0.0 3 3.1
Q4 2014 17 4.9 2 0.7 2 3.5 0 0.0
Q1 2015 10 3.1 3 1.0 2 3.6 1 1.1
Q2 2015 15 4.2 2 0.7 1 1.8 1 1.0
38
Vancomycin resistant enterococcus (VRE) data
Table 9 VRE isolates identified per quarter within one) acute public hospitals two) other healthcare settings (private hospitals, rural hospitals, GP clinics and long term and residential care facilities) and three) total Tasmanian isolates.
RHH LGH MCH NWRH Other
healthcare settings
Total
Q1 2008 11 - - - 2 13
Q2 2008 17 6 - 7 3 32
Q3 2008 1 1 - 10 - 12
Q4 2008 3 9 - 5 1 18
Q1 2009 - 4 2 3 - 9
Q2 2009 8 - 4 2 - 14
Q3 2009 1 - 2 1 - 4
Q4 2009 2 2 1 - 1 6
Q1 2010 1 - 1 - - 2
Q2 2010 4 - 1 - - 5
Q3 2010 10 - 2 2 - 14
Q4 2010 3 - 3 1 1 8
Q1 2011 - - 2 1 - 3
Q2 2011 3 1 - - 4 8
Q3 2011 1 1 - - 1 3
Q4 2011 3 - - - 2 5
Q1 2012 3 2 2 2 1 10
Q2 2012 4 2 - 1 - 7
Q3 2012 3 2 2 - 1 8
Q4 2012 1 7 1 1 2 12
Q1 2013 13 0 3 - 2 18
Q2 2013 8 3 - 1 3 15
Q 3 2013 8 1 - 2 1 12
Q4 2013 5 3 - 3 5 16
Q1 2014 5 - 1 1 1 8
Q2 2014 3 6 1 1 2 13
Q3 2014 1 2 3 2 - 8
Q4 2014 1 5 1 5 7 19
Q1 2015 10 12 2 5 7 36
Q2 2015 5 13 2 1 8 29
39
Hand hygiene compliance data June 2015
Table 10 Hand hygiene compliance rates by Tasmanian hospital and state level Hospital Name HH Correctly
Performed HH Moments Compliance
Lower 95%
confidence interval
Upper 95%
confidence interval Royal Hobart 2053 2664 77% 75% 79%
LGH 3705 4850 76% 75% 78%
Mersey 251 312 80% 76% 84%
NWRH 740 976 76% 73% 78%
Midlands MPC 42 54 78% 65% 87%
New Norfolk 74 76 97% 91% 99%
Beaconsfield 47 52 90% 79% 96%
Campbell Town No data submitted for Q2 2015
Deloraine 114 122 93% 88% 97%
Flinders Is. MPC 55 59 93% 84% 97%
George Town 57 67 85% 75% 92%
NESM Scottsdale 54 59 92% 82% 96%
St Helens 68 85 80% 70% 87%
St Marys CHC 72 90 80% 71% 87%
King Island 51 56 91% 81% 96%
Smithton 42 52 81% 68% 89%
Healthwest 39 54 72% 59% 82%
Tas Public TOTAL 7464 9628 77.5% 77% 78%
Table 11 Tasmanian hand hygiene compliance rates by moment Moments HH Correctly
Performed Total HH
Moments Compliance Lower 95%
confidence interval
Upper 95%
confidence interval
Moment 1 2032 2692 75% 74% 77%
Moment 2 407 578 70% 67% 74%
Moment 3 761 898 85% 82% 87%
Moment 4 2476 2961 84% 82% 85%
Moment 5 1788 2499 72% 70% 73%
Tas Public TOTAL 7464 9628 78% 77% 78%
40 Table 12 Tasmanian hand hygiene compliance rates by healthcare worker
Staff Type HH Correctly
Performed HH Moments Compliance Lower 95%
confidence interval
Upper 95%
confidence interval
Clerical 14 23 61% 41% 78%
Allied Health 374 487 77% 73% 80%
Domestic 113 172 66% 58% 72%
Invasive Technician 66 87 76% 66% 84%
Doctor 783 1267 62% 59% 64%
Nurse/Midwife 5443 6723 81% 80% 82%
Other 9 17 53% 31% 74%
Personal care staff 360 473 76% 72% 80%
Student Doctor 36 56 64% 51% 76%
Student Nurse/Midwife 251 303 83% 78% 87%
Student Allied Health 15 20 75% 53% 89%
Tas Public TOTAL 7464 9628 78% 77% 78%