Experiment A: Heterosis rates in Fr hybrids and Experiment B: Relative yield of pure line derivatives Experiment C: Genetic distance between parental lines. It is now well established that the degree of heterosis in Frs depends on con'bination.
The level of heterosis in inbreeding species
Nevertheless, in recent years, increasing attention has been given to studies of heterosis in inbred species. The level of heterosis has been shown to vary widely, both with crops and between crops.

Fr hybrids that showed high levels of heterosis also generally showed high levels of inbreeding ctepression at Fz. Nevertheless, there were notable exceptions to this rule and some highly heterotic hybrids showed only moderate inbreeding clepresion (Singh et al., 197Ð.
However, Wells and Lay (1970) found no evidence that high-yielding pure lir-res tended to produce high-yielding hybrids.
Genetic basis of heterosis
The amount of heterosis after a cross between two separate lines or populations depended on the square of the gene frequency difference between the populations. The expected level of heterosis can be expressed in terms of genetic parameters of acclivity and clominance (Mather, 7949) and the non-allelic interaction component (Hayman and Mather, 1955).
- The fixable proportion of heterosis
- Measurement of genetic distance
This supported Smith's (1952) earlier work on tobacco, which showed that it was possible to develop pure varieties from highly heterotic hybrids that perform as well or even better than Fr. They found that in the more stressed environment the FR hybrid was significantly better than the best FZ lines, but in the less stressed two leading FZ lines gave similar yields as the FR hybrids.
Allelic expression should be distinguishable in individuals; in particular,
They are the result of the interaction of the genotype of an ink member and the environment. Measures based on quantitative characters are therefore unreliable indicators of the diversity in a population at the level of the individual.
Isozymes are usually detected using electrophoretic techniques and this allows many individuals to be screened non-destructively and in a relatively short time. They can be used to screen seedlings and this can save considerable time and field.
Isozymes are variant forms of an enzyme and have significant advantages over morphological markers in measuring genetic diversity. The equipment and materials required to screen the isozyme bancling patterns (zymograms) of plants are relatively inexpensive and it is possible to screen large numbers of plants quickly.
- Correlation between genetic distance and heterosis
- Summary
These contrasting results may be associated with the contrasting breeding systems of the two species, common bean being inbreeding and faba bean partially outbreeding. For an objective assessment of the potential of this breeding approach, we need to know:- .. i) The level of heterosis for yield and its components that can be obtained from field chicks.
Chapter 3 Materials and Methods
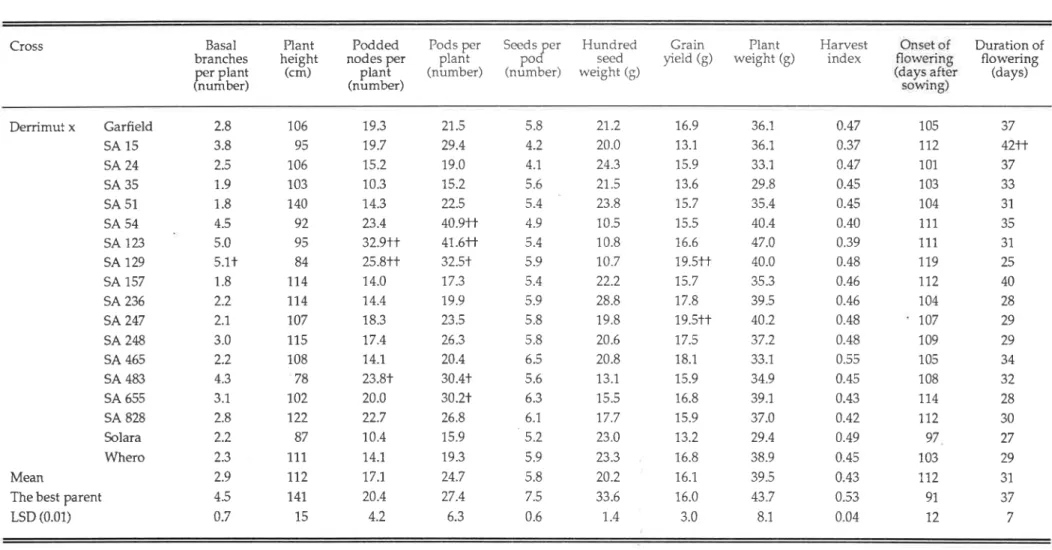
Derrimut was released by the Victorian Department of Agriculture irt 7964. It is the earliest flowering of the cornmercial cultivars with mid-season maturity. SE "i¡ are standard errors of specific effects of the cross of fernal i x male j MSn is the female x environmental mean square.
Experiment B: Relative yield of pure-line derivatives of heterotic hybrids
Experiment C: Genetic distance amongst parental lines and its relation to the level of heterosis
II III
Morphological polymorphisms
Quantitative traits
Four measures of genetic distance (GD) were calculated between all 72 parental combinations; CD¡, based on isozymes; GD,o, on morphological markers; GDia¡¡, of-t. Three measurements of the heterosis level (Hmp, Hbp, Hcm) were calculated for Fr and Fz.
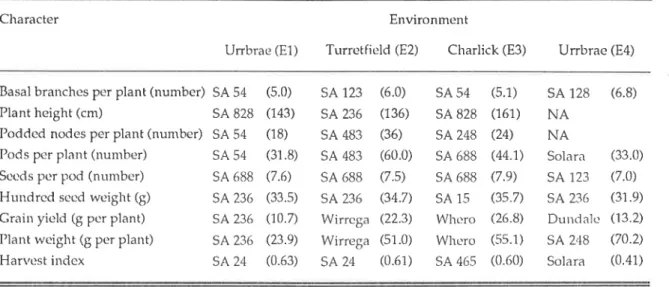
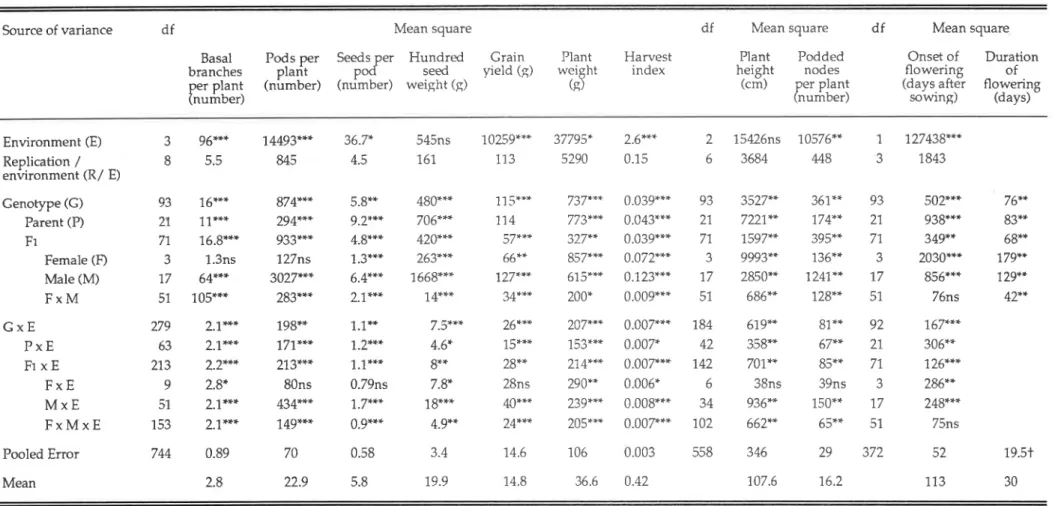
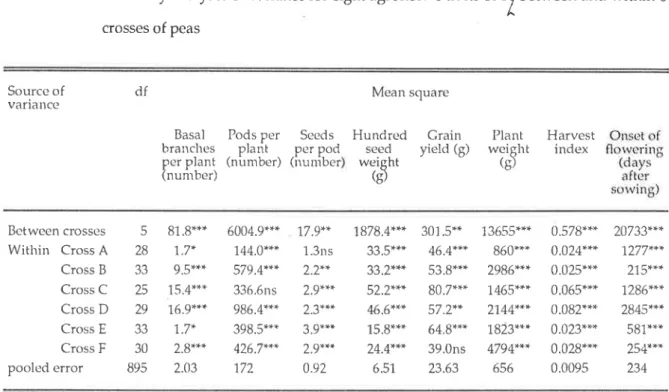
The degree of variation for grain yield, plant weight, harvest index, plant height and seed characteristics in the parent group was higher than in the Frs, but for poddecl nodes per plant, pods per plant and basal branches the coefficient of variability was higher. in Frs than the parents. The interactions between parent x environment (P x E) and Fr x environment (Fr x E) were highly significant for pods per plant, peeled nodes per plant and basal branches, and moderately significant for flowering onset, hundred seed weight , seeds per group and harvest index. The GCA effects of male and female parents were significant for all traits except basal branches per plant and number of pocls per plant in females.
Male and female mean squared variance exceeded male x female mean squared variances for all traits, indicating that additive gene effects were greater than non-additive gene effects. The n'rale x environment interactions were highly significant for all traits, including grain yield, but the female x environment interactions were significant only for plant weight, harvest index, basal branches per plant, and hundred seed weight. Thus, the effects of CCA on grain yield expressed in females are more consistent than in male parents.
The highly significant interaction effects between male and female and environment on all traits except flowering onset suggest that SCA effects are inconsistent and often not clearly influenced by environment.
Combining ability
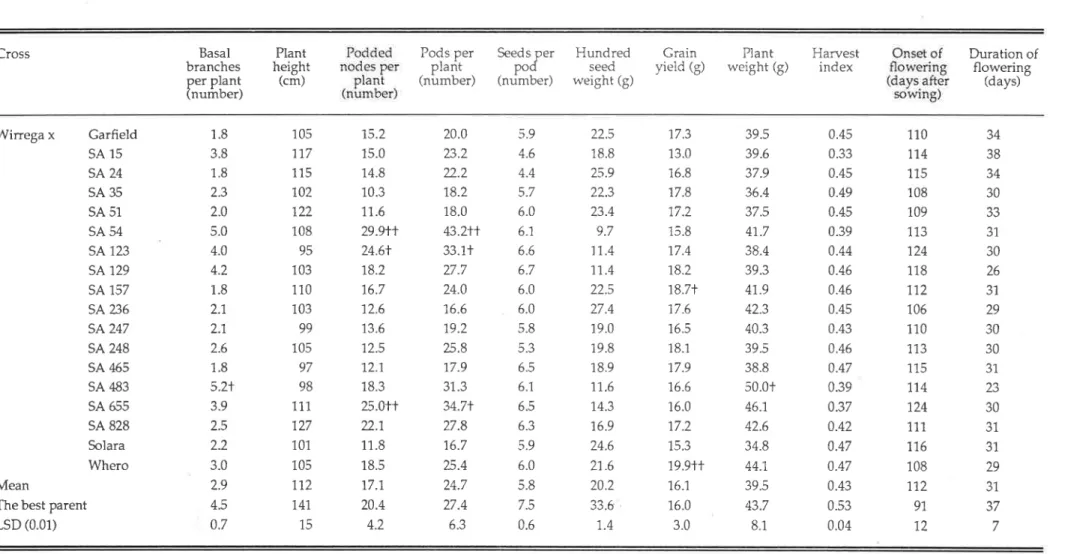
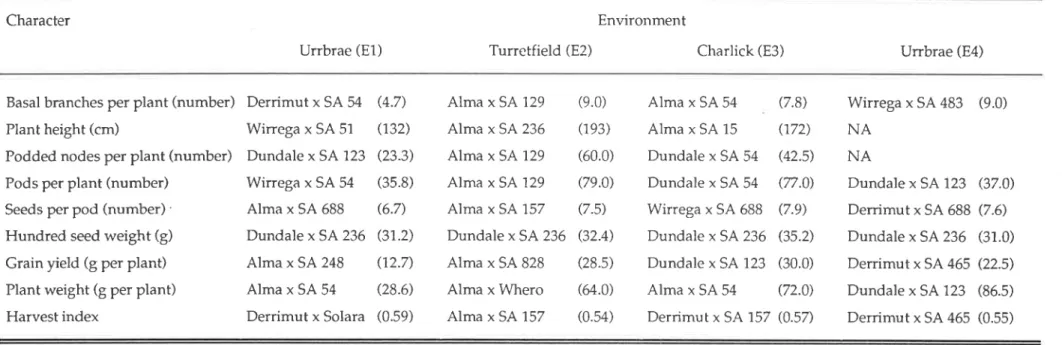
Wirrega showed highly significant positive effects of GCA on grain yield (0.80 g per plant) and number of seeds per pod (0.10) along with significant negative effects on plant height (-5.60 cm) and hundred seed weight (- 1.1 g). None of the 18 males expressed significant positive effects of GCA on yield, although these effects of SA 123.5A 236 and 5A247 approached significance (>1.0 g per plant). SA15 and SA 54 hacl have very significant negative effects on yield with values of -3.9 and -2.6 g per plant, respectively.
Parent Basal branches Plant Podded nocles Pocls per Seeds per Hunclred Crain Plant Harvest Beginning of Duration of per plant height per plant plant pod seed weight yield weight index flowering flowering Females (gi). Cross Basal branches Plant Podded nodes Pods per Seecis per Hundred Grain Ptant Harvest Beginning of Duration of per plant height per plant plarit pods seed weight yield weight inclex bloom bloom Alma x Garfield .. per plant Pods per Seeds per. Wirrega x. per plant height per plant plant pods section weight yield weight index flowering flowering Garfield .. 79 . flowering) and significant positive effects for eight of those nine (all except plant weight).
The grain yield heterosis of Alrna x SA 828, Derrirnut x SA 129 and Dundale x SA 123 was mainly due to the heterosis in the pods per plant, while the yield of Alma xSA24 was an indication of heterosis for both pocls per plant and secl. .
Experiment B: Relative yield of pure-line derivatives of heterotic hybrids
- Heritabitity
The levels of heterosis for wheat yield in these crosses were due to heterosis in a. These crosses were produced from parents that tended to differ for their combining ability effects on grain yield. The six crosses were cliferent at the level of abductor depression for grain yield in tlre Fz generation.
Mean values and the least significant differences in grain yield and seven haits of Fs (ueS. The number of pods per plant was significantly correlated with grain yield in crosses A, C, E and F, whereas hundred secl weight was significantly correlated with grain yield in cross B, C ancl D. The cliff between parents in plant weight was strongly correlated with tl-re variation of grain yield i.
The differences between basal branches per plant, seed per pod and hundred seed weight also tended to be correlated with the variation in Fs grain yield.
Experiment C part 1: Genetic distance amongst parental lines
- Experiment C part 2: Relationship between parental genetic distance and heterosis
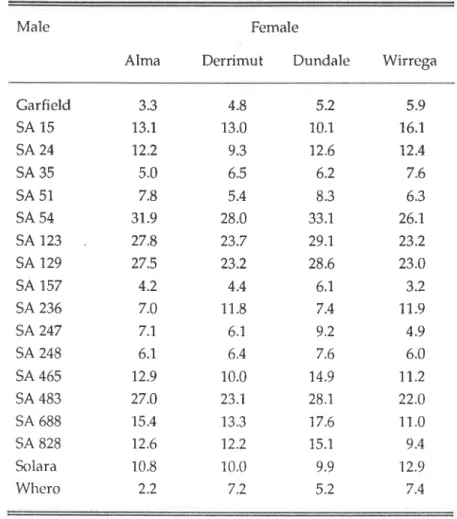
The Euclidean genetic distance between male and female parents ranged from 2.2 to 33.1 (Table 4.3.4). There are highly significant positive correlations between these three cylindric values and levels of heterosis. Correlation coefficients between GD- and degree of heterosis were low for all traits except plant height (r between GD. and Hmp = 0.57).
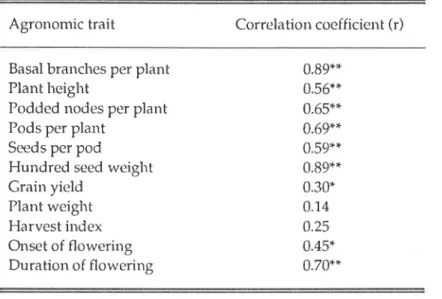
Although GD- was different from GD¡, GDi*- and GD., in terms of its association with levels of heterosis in agronomic traits, these four measures were comparable in predictability for grain yield. There were no significant correlations of any measure of genetic distance with Hbp or Hcm for wheat yield (Table 4.4.1). Genetic relatedness between parents was significantly correlated with the square meal of their Fs lines for basal branches per plant, hundred seed weight, harvest index and flowering onset.
The correlation coefficient (r) between the mean square of 8 agronomic traits in Fs from 6 crosses and gerretic distance calculated from isozyme markers (GDi¡, morphological polymorphisms. CD-), isozyme markers and morphological polymorphisms (GD1,.m) and quantitative traits (CDo) .
Chapter 5 Discussion
- Experirnent A: The levels of heterosis in Fr hybrids and Fz progenies
- Combining ability of parents
- Experiment B: Relative yield of pure-line derivatives of heterotic hybrids
- Experiment C: Genetic distance amongst parental lines and its relation to the level of heterosis
- Implications in breeding peas for high yield
- A high correlation was observed between hybricl performance and mid-parent value for plant height, podded nodes per plant, pods per plant and hunclred seed weight,
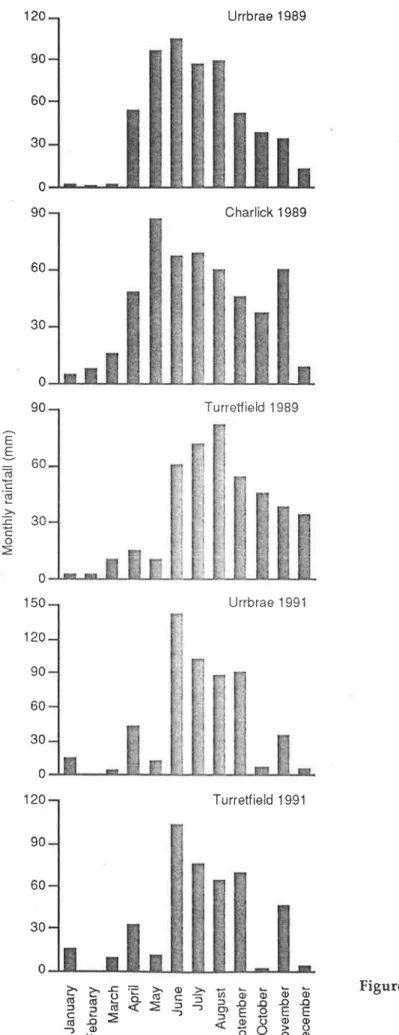
- Environments affected the expression of all pod characteristics nìore than seed characteristics. Yield was marginally more stable across environlnents in parents than in
- The levels of heterosis for pocl characteristics were higher than those for seed characteristics. Heterosis for grain yield was mainly due to heterosis for pods per plant
- Differences in response of parents and hybrids to environments resulted in the difference in the level of heterosis across environments. Frs were better adapted to poor
- There was arì inconsistent pattern of the performance and genetic clistance of crosses which gave high proportion of elite lines in later generations
- The genetic distance estimated from quantitative traits (CDo) was significantly correlated with those estimated from isozyme markers (GDi) and from the combination of
- GDi, GD¡** and GDn were equally good predictors for the level of heterosis in
- When parents were high in GD¡, GD*- and GDq, crosses produced highly
The levels of heterosis for pods per plant, plant weight and grain yield were higher under low yield conditions than under high yield conditions. Yield and plant weight were lower in Fzs than in Frs and the level of heterosis in Fz. The significant correlation between GCA and Hmp may suggest that additive gene effects were involved in the levels of basal branch heterosis per plant, pods per plant, hundred seed weight and harvest index.
However, CD¡, GDi*- and GDn were good predictors of the levels of all three measures of heterosis for basal branches, nodes and pods collected per plant, hundred seed weight and total plant weight. Similarly, no relationship was found between GD and level of heterosis for seed per tail in bean (Ghaderi et al, 1984). The level of heterosis for yield in Fz was approximately half that in Fr.
The level of inbreeding depression was higher than the decreasing percentage of heterosis from Fr indicating epistatic effects of genes on wheat yield.
Isoenzymatic diversity of Vigna parents in relation to heterosis for seed yield in green gram. Combining abilities and genetic diversity is possible in some varieties of Littunt usif atíssintLmt Indian lournnl from Genetics and Pkuú Brccding. Relationships between performance and multilocus heterozygosity at enzyme loci in maize single-cross hybrids.
Evaluation of the potential of wheat crosses based on average parental and early generation values. Measurement of genetic diversity in the pea accession collection near the center or origin of the cloned pea. The isolation of 'pure lines' from tomato Fr hybrids and the problem of heterosis in infecting crop species.
Cønùridge 53: 347-35i
The effect of isozyme selection on metric characters in an interspecific backcross of tomato - Basis of an early. Average values across replicates for each agronomic trait of each Fs line derived from crosses A through F in each environment, E1 and E2. Cross Basal branches per pods per plant Seeds per pod One hundred seeds Grain yield (g) Plant weight Harvest index Beginning of flowering.
Crossing Basal branches per pods per plant Seeds per pod One hundred seeds Grain yield (g) Plant weight Harvest index Beginning of flowering.