Abstract
We found that a population-based modeling approach is not a suitable alternative to an individual-based modeling approach when there is a large difference in contamination levels between processed carcasses. The applicability of these models is not only limited to the pig chain or to the pathogens mentioned above, but by changing the parameters, the whole model or its parts can be extrapolated to other animal species that undergo similar slaughter processes with analogous pathogens of epidemiological samples.
Acknowledgements
Nomenclature
Glossary
Symbols and Units
Nf,S pathogen numbers in leaking feces of a carcass cfu Np,l total number of bacteria in a cage in the stable cfu Nsaw pathogen number on saw after cutting pork chops cfu Nx,c pathogen number on pork chop after partition cfu Nx,pc pathogen number on skin surface of the pork chop. One objective of the pork industry is therefore to demonstrate that pork products originating from New Zealand have a minimal probability of contamination, particularly with zoonotic microbes of major public health concern.
Microbial risk assessment
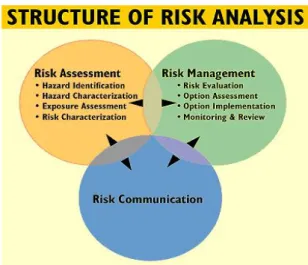
Steps involved in risk analysis
Nevertheless, a qualitative assessment was performed according to the principles of the Codex Alimentarius Commission (Anonymous 2002b). Hazard characterisation: This can be a qualitative and/or quantitative evaluation of the nature of the adverse health effects associated with the hazard (Rocourt et al. 2001).
Quantitative microbial risk assessment
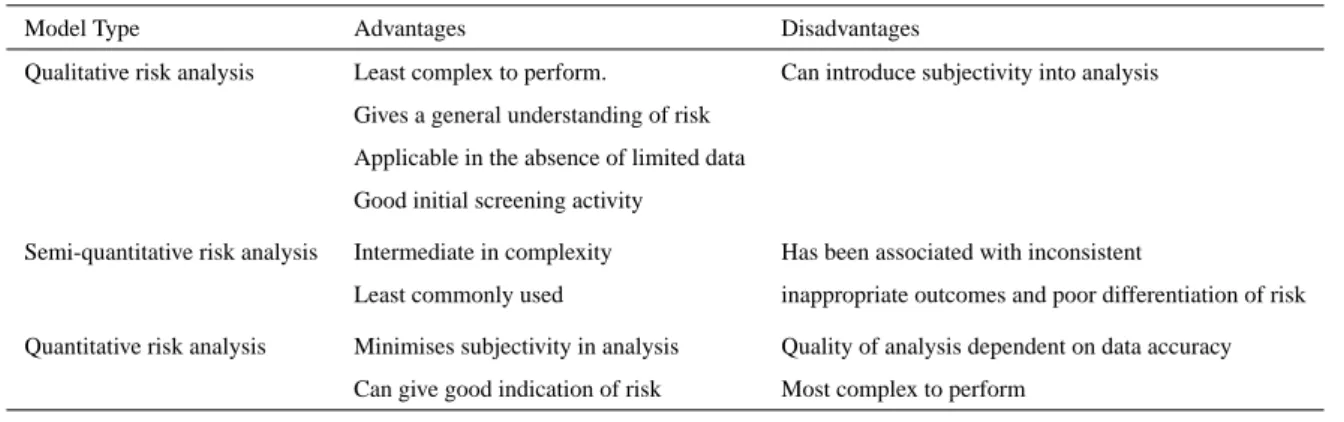
Model types
These models can be deterministic or stochastic, and in the latter case variability and uncertainty can be described (Bossel 1994, Young & Lees 1993). Also, model development is time consuming and limited to the knowledge of the model builder (Young & Lees 1993).
Simulation modelling
Simulation sampling
There are several different sampling methods when using Monte Carlo simulations, but only the two most commonly used methods will be discussed. The sections in the tail regions of the distribution are wider than those in the peaks of the distribution.
Sensitivity analyses
Inputs are assigned probability distributions and the effect of input variance on output variance can be determined (Andersson et al. 2000, Neter et al. 1996). Graphical illustrations, such as scatter plots and tornadoes provide a visual indication of the effect of the input parameter on the output (Geldermann & Rentz 2001, Stiber et al. 1999).
Second order modelling
This technique separately propagates uncertainty and variability in risk assessments by nesting multiple realizations of model parameters and iterations of input variables. The output is a collection of distribution functions that describe the uncertainty and variability in the results (Wu & Tsang 2004).
Parameter estimation
2003) separated the two by implementing Monte Carlo simulations first sampling from uncertainty distributions and then sampling from variability distributions. Second-order Monte Carlo simulations (MCS) are also known as two-phase or two-dimensional MCS.
Modelling techniques
- Bayesian belief network approach
- Probabilistic scenario analysis (PSA)
- Process risk model
- Modular process risk model
The previous state of the model can be combined with evidence or information from experience or testing at the node level. The purpose of this modeling technique is to describe the transfer of the hazard along the food route (Nauta 2001).
Applications of risk analysis
Other risk profiles currently being developed include Campylobacter in waste, Campylobacter in red meat and Salmonella and Campylobacter in the poultry food chain.
Risk profiles
- Salmonella
- Campylobacter
- Escherichia coli O157:H7
- Summary
High ambient temperatures and humidity promote increased numbers and incidence on the farm (Barber et al. 2002). Campylobacter coli is predominantly found in pigs, while Campylobacter jejuni is more widespread (Borch et al. 1996).
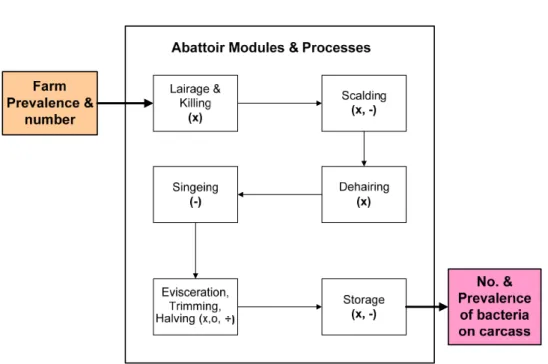
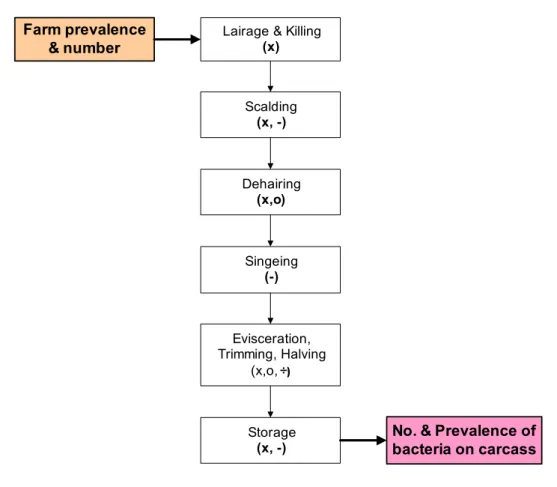
Overview of Production processes
Abattoir
This immersion loosens the hair and bristles in the outer layer of the skin, facilitating hair removal, which takes place in a subsequent processing stage. In this thesis, three slaughterhouses were visited, two of which were on the North Island.
Further processing processes
Six of these are located in the North Island and five in the South Island. An abattoir in the North Island slaughters pigs two days a week, with the exception of December, when increased market demand led to pigs being slaughtered 3 days a week. There is a procedure called polishing, which results in removing any black skin from the scratch.
Conclusion
The number of pigs slaughtered daily in abattoirs in New Zealand can vary from 150 to over 1000 pigs. There appears to be no standardization of the process in the abattoirs visited throughout New Zealand. The purpose of this study is to propose a model that simulates the propagation of these three pathogens in New Zealand abattoirs.
Introduction
Estimated median contamination levels on the dressed carcasses leaving the slaughterhouse were less than one CFU/cm2 for the three pathogens. If the New Zealand salmonella prevalence level was similar to the level currently reported in Europe, the model predicted 100% prevalence levels on dressed carcasses leaving the slaughterhouse for this pathogen. In New Zealand (NZ), the incidence risk of foodborne illness due to these pathogens varies.
Model Description
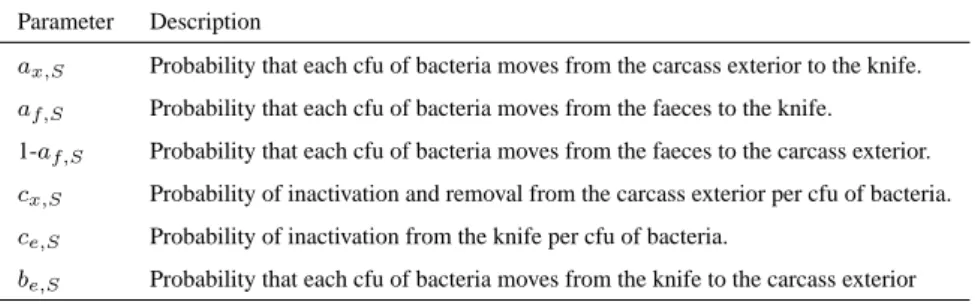
Inactivation and removal from the blade and the exterior of the hull are parameterized by ce,S and cx,S, respectively. The second output provides an estimate of the total number of bacteria in the pen in the temporary housing area (Np,l). The difference in weight was considered to estimate the amount of leaking faecal material moving to the surface of the carcass.
Results
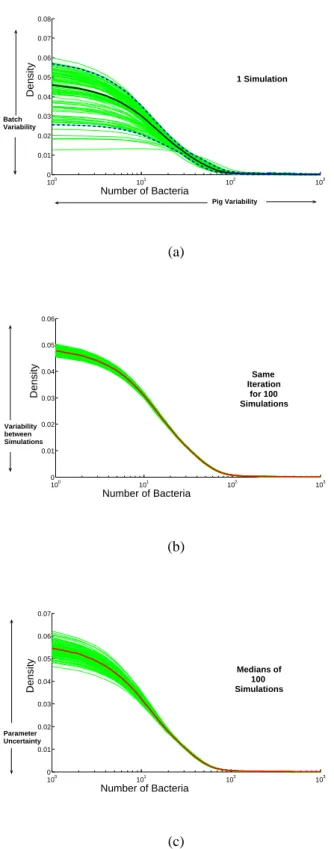
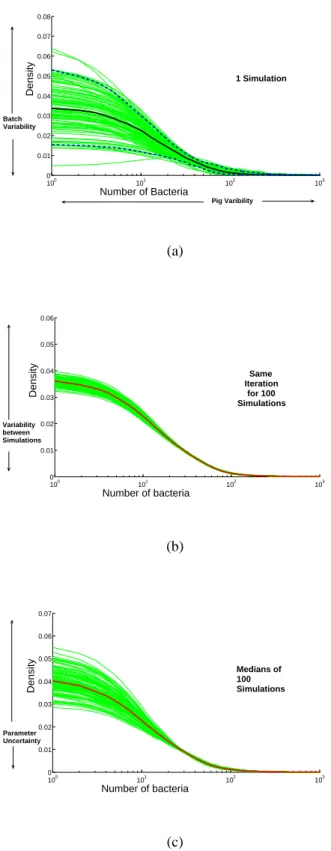
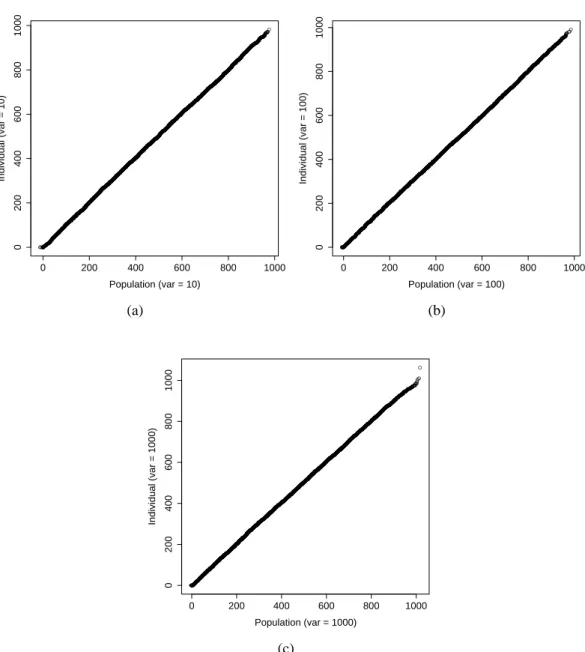
For graphs (a) and (b), each green line corresponds to a non-parametric distribution of the number of pathogens on carcasses at the end of storage at the slaughterhouse. For (c), each green line corresponds to the non-parametric distribution of the average number of pathogens on carcasses at the end of storage from a simulation at the slaughterhouse. For (c), each green line corresponds to the non-parametric distribution of the average number of pathogens on carcasses at the end of storage from a simulation at the slaughterhouse.
Discussion
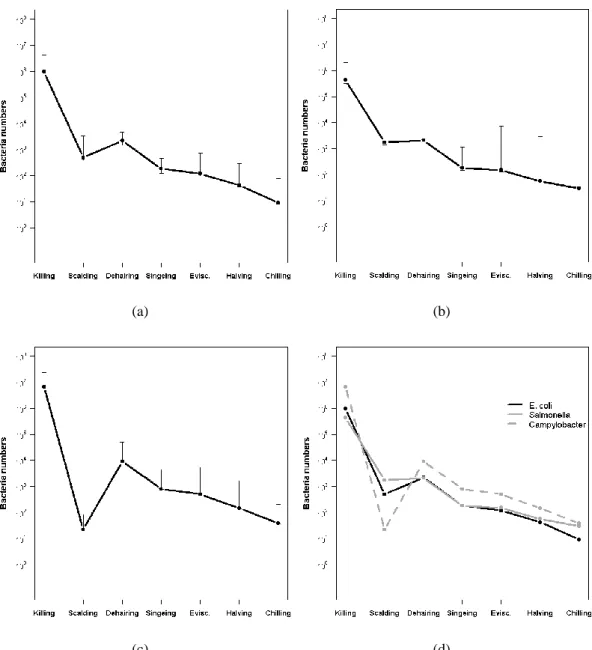
Our results are consistent with those found by Chang et al. 2003b), who identified blast chilling, currently used in New Zealand abattoirs, as effective in reducing the number of E. coli on pig skin. Of the six MPRM processes, this is the most difficult to model and, as a result, relatively few studies have addressed this issue (Aziza et al. 2006). These bacteria can contribute to carcass contamination levels especially in relation to Salmonella, leading to increased carcass contamination levels (Pearce et al. 2006).
Acknowledgements
This omission may affect the ability of the models to be generalized to all abattoirs in New Zealand. However, it is not possible to include all the unique aspects of all abattoirs in the models and therefore the most practical approach was taken. The models predict bacteria levels on each pig in each module and also output distributions of these contamination levels for each module.
Appendix
We let the probability of bacteria (cfu) on the carcass moving to the knife be P(A) * P(C) where A is the probability that bacteria are present on the area of the carcass that would be in contact with the knife during evisceration. The total surface area of the pig body was estimated in a previous parameter that determines the proportion of faecal material on each pig. We let this equal P(G) * P(H), where G is the probability that bacteria are present on the area of the carcass that would be in contact with the knife during halving.
Introduction
Model Description
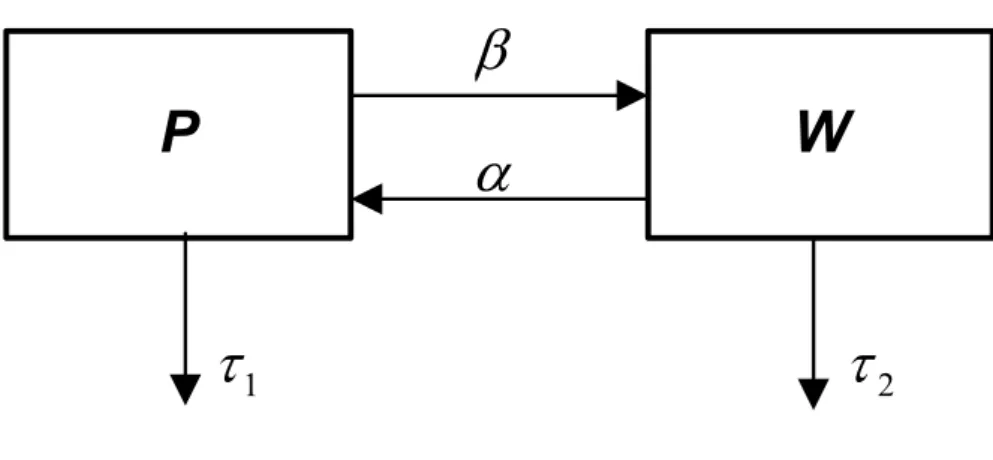
So in the case where there is a net movement of the pathogen from water to the pig, P > αW/(β+τ1) indicates that cross-contamination on the pig dominates over inactivation and P < αW/(β+τ1) corresponds to the inactivation process which predominates in the pig (Table 4.1). In the case where pathogen movement from pig to water dominates, inactivation is the primary process that occurs in water when P > (α+τ2)W/β, while cross-contamination is dominant in water when P <( α+τ2)W/β. Our estimated value of α does not include pathogens in the water that are on the pig carcass when it is removed from the scalding tank.
Results
Further, lower initial pig contamination values, as seen in the right-skewed distribution, contribute to lower post-burn contamination levels. Despite the predicted higher pathogen levels in the water during the scalding of population B, the levels of contamination of the post-cremation carcasses from this group are similar to the levels of post-cremation contamination of the population A. Pathogen levels in the water during the scalding of 250 pigs for 4.46 hours at 55◦C with an initial level of bacterial contamination in pigs obtained from Normal is shown (e).
Discussion
In situations where carcasses with high contamination levels enter the scalding tank with low pathogen counts, our model predicts cross-contamination as the dominant process on the pig and in the water for a large part of the scalding process. Elucidation of pathogen dynamics may therefore result in cost-effective measures to reduce the level of post-scalding carcass contamination. Nevertheless, our models provide a good indication of pathogen dynamics during scald and contamination levels after scald.
Appendix
In this article, a comparison of these two approaches has been made to determine the conditions under which the population approach is a suitable alternative to the individual-based method. We show that the population-based approach is a suitable alternative to the individual-based technique when using zero-bloated Poisson input distributions, as both approaches predicted similar results. Therefore, the population-based approach is not a suitable alternative to the individual-based technique under these circumstances.
Introduction
Model Description
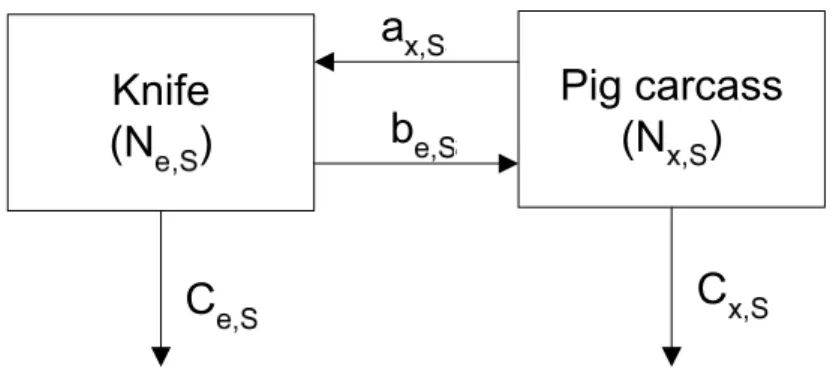
Parameters be,Sandax,S indicate the probability of bacterial movement between sections in the direction of the arrows, while,S andcx,S represent the probability of inactivation from the environment and the carcass surface, respectively. The individual and population-based approaches are performed in the trimming module using two different types of distributions that describe initial bacterial contamination levels on the surface of pigs. A summary of the results of carcass contamination studies carried out in New Zealand abattoirs is described in the appendix.
Results
We then examine the predicted levels of the pathogen in the environment, specifically the number of carcasses that are cut before the number of pathogens in the environment shows small fluctuations around a constant value.
Discussion
Model development using this technique is time consuming and the model calculation time is significantly longer compared to the population-based approach. For models with input distributions described by Zero-inflated Poisson distributions, the population-based method provides a close approximation to the individual-based method, as both techniques yield similar results. In this article, we present a simple model, where the environment refers only to the blade and excludes the surrounding air and atomized water.
Appendix
The difference in weight was considered as an estimate of the amount of leaking faecal material moving on the knife during the extraction. This parameter is calculated from multiplying the probability of survival of bacteria in water at 70◦C with the probability of transfer of bacteria from the knife to the skin. 2006), a minimum of a 1 log10 reduction in pathogen numbers is expected. Assuming that the reduction in ground pork is the same as that on the carcass skin, we use these estimates of the extent of pathogen reduction to determine the probability of inactivation on the carcass skin.
Abstract
Introduction
Model Description
Sensitivity analyzes were performed on each model using Latin Hypercube sampling combined with partial rank correlation coefficient (LHS/PRCC) to identify the parameters most influential in determining the model results. This technique facilitates exploration of the full range of values for each parameter distribution in the model under investigation (Blower & Dowlatabadi 1994). In summary, one hundred samples from each of the 22 parameter distributions considered in the sensitivity analysis were obtained by Latin hypercube sampling.
Results
Regarding Campylobacter, only the time spent in storage, the amount of faecal material removed from the pig during hair removal and the probability of movement of bacteria from the carcass skin to the knife during evisceration were determined to be significant. Of these three parameters, time spent in storage and the probability of movement of bacteria from the carcass skin to the knife during evisceration produced negative PRCC values. The PRCCs are between the input parameters and the output value (average numbers of the pathogen in the dressed carcasses after the end of storage).
Discussion
Introduction
Model Description
Results
Discussion
Model development and techniques used
The model
Future Applications
Conclusion
Codex Alimentarius Commission schematic for Risk Analysis
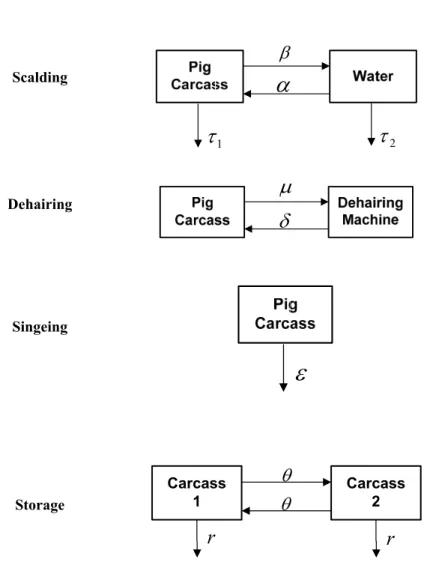
Schematic of modelled abattoir
Schematic diagram of pathogen dynamics occurring during Evisceration. 54
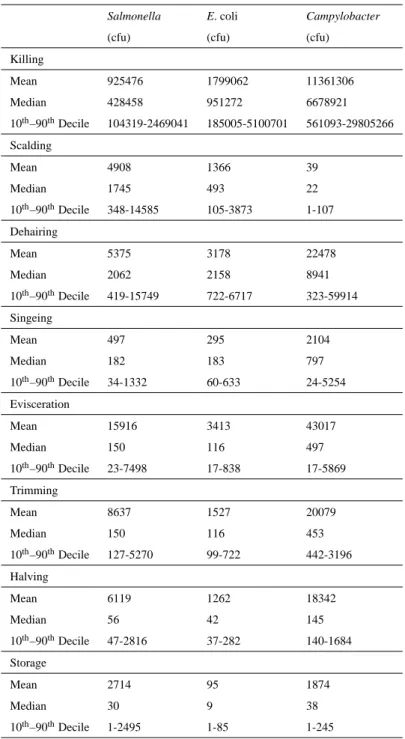
Predicted bacterial numbers on pig carcasses at different stages in the
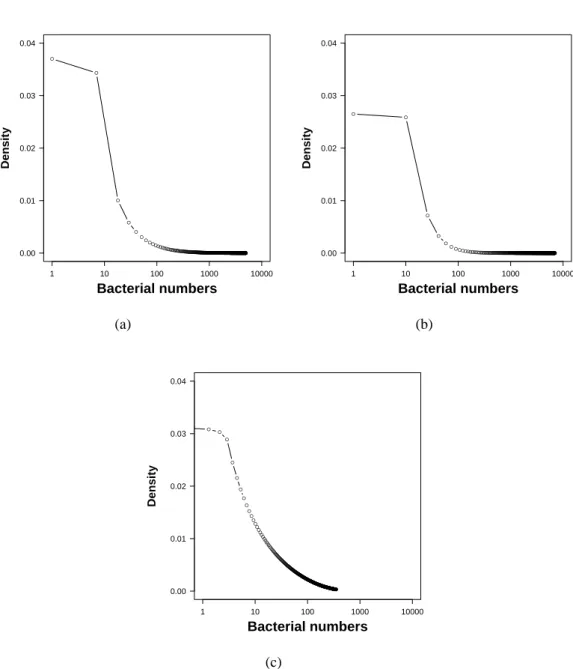
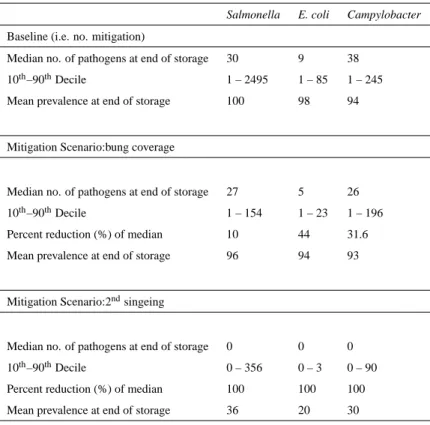
Predicted distributions of pathogens at storage
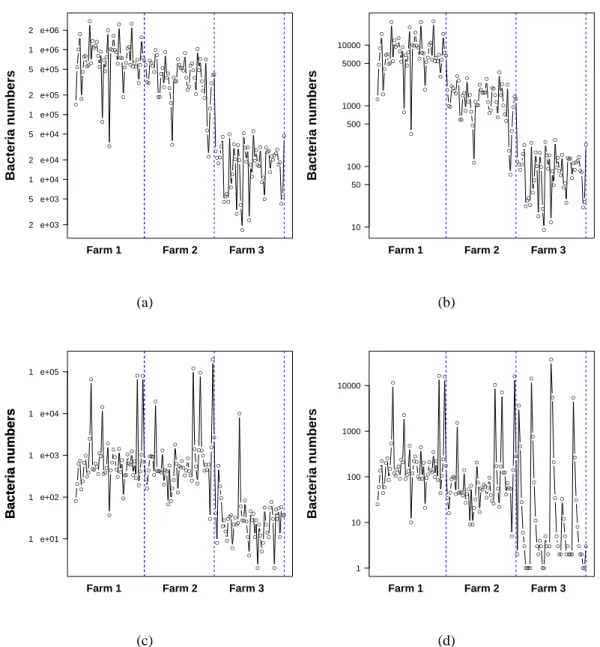
Time Series of predicted surface contamination levels of Salmonella on
Outcome of the second order analysis for Salmonella
Outcome of the second order analysis for E. coli
Outcome of the second order analysis for Campylobacter
Lairage and Killing module of abattoir model
Scalding module of abattoir model
Dehairing module of abattoir model
Singeing and Evisceration modules of abattoir model
Storage module of abattoir model
Schematic of modelled scalding process
Rate of change of pathogens on the carcass
Phase plane plots showing pathogen dynamics (a)
Phase plane plots showing pathogen dynamics (b)
Tornado plot of sensitivity analyses results for the semi-stochastic scald-