Business earnings expectations in the next 12 months: Almost 50% of employers expected a strong or moderate increase in earnings from November 2013. Employer sentiment recovered in November 2014 with 49% of employers expecting a strong or moderate earnings. Expectations for sales in the next 12 months: Just over half of employers (53%) expected a strong or moderate increase in sales from November 2013.
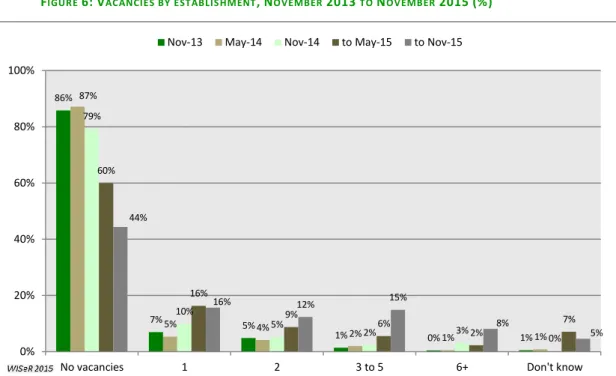
By November 2014, the percentage of employers expecting a vacancy in the next 12 months had fallen to 44%. This report focuses on Wave 3 of the WFS completed by employers in the cities of Playford and Salisbury during October to November 2014.
M ETHODOLOGICAL OVERVIEW
Forecasts for corporate profits over the next twelve months: One in two employers expected a strong to moderate increase in profits from November 2013. During the last wave (November 2014), 9% expected a decline in turnover (of which 7% expected a moderate increase in profits). decrease) over the next twelve months. Nearly half (48%) of employers expected a strong to moderate increase in their investment intentions in the coming year, up from 42% in May 2014.
The proportion of employers expecting only one vacancy within the next 12 months was 16% in both the November 2014 and May 2014 surveys. In May 2014, 60% of employers reported that they expected no vacancies in their organizations within the next 12 months.
A BILITY
Industry
As illustrated in Figure 9, 37% of employers in construction firms strongly agreed that they have a well-defined and structured skills recruitment process. Retail had the lowest proportion of employers who strongly agreed (17%), although almost one in two employers (47%) agreed they had structured skills recruitment processes. A total of 15% of retail employers disagreed (including 3% who strongly disagreed) which is a reflection of the nature of this sector which tends to rely on ad hoc recruitment based on the business cycle.
Surprisingly, a large proportion (12%) in health and social care disagreed with the practice of employing structured skills. One in five health and social care employers strongly agreed that they have processes in place to identify staff training needs, with a further 47% agreeing. Just over one in five employers in the health and social care and retail industries strongly agreed, with a further three in five employers agreeing.
Almost one in ten (9%) in health and social care organizations disagreed, with a further 4% strongly disagreeing that their staff receive ongoing training. Manufacturing, construction and retail reported increased skills training for various roles compared to health and social care settings. Just over a quarter (26%) of manufacturing companies strongly agreed that they train employees to become skilled in a range of different roles, with a further 46% agreeing and 15% disagreeing.
In the construction industry, 23% of employers strongly agreed that their employees were trained in a variety of roles, with 40% agreeing. Approximately three in four (74%) retail employers agreed or agreed that they often train their staff in a variety of roles, while 13% disagreed. Only 13% of employers in health care and social assistance strongly agreed that they train employees to be competent in a range of roles, with a further 44% agreeing.

Establishment size
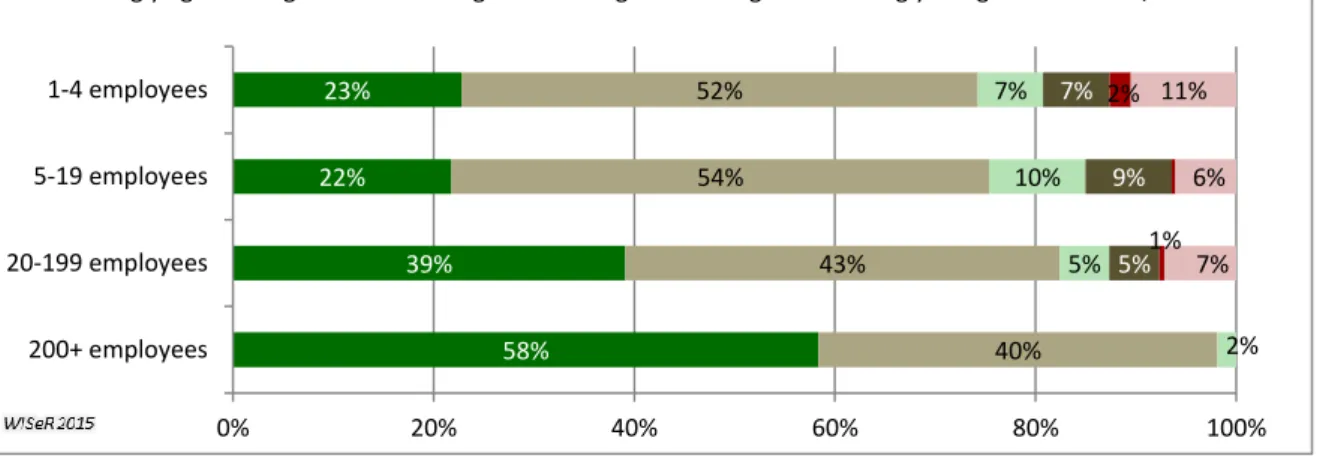
Estimates for establishments with 200 or more employees should be interpreted with caution as the sample size for this category was very small (n=8). Smaller firms appear to offer fewer ongoing training opportunities for their employees compared to larger firms (Figure 15). One in five (21%) businesses with one to four employees have fully agreed, and another 43% have agreed that their employees receive ongoing training.
Thirty-eight percent of organizations with 20 to 199 employees strongly agreed, with 46% agreeing and only 3% disagreeing that ongoing training is provided. Almost three-quarters of establishments agreed to some extent that they train staff for a range of different roles (see Figure 16). Estimates for establishments with 200 or more employees should be interpreted with caution as the sample size for this category was very small (n=8).
M OTIVATION
Industry
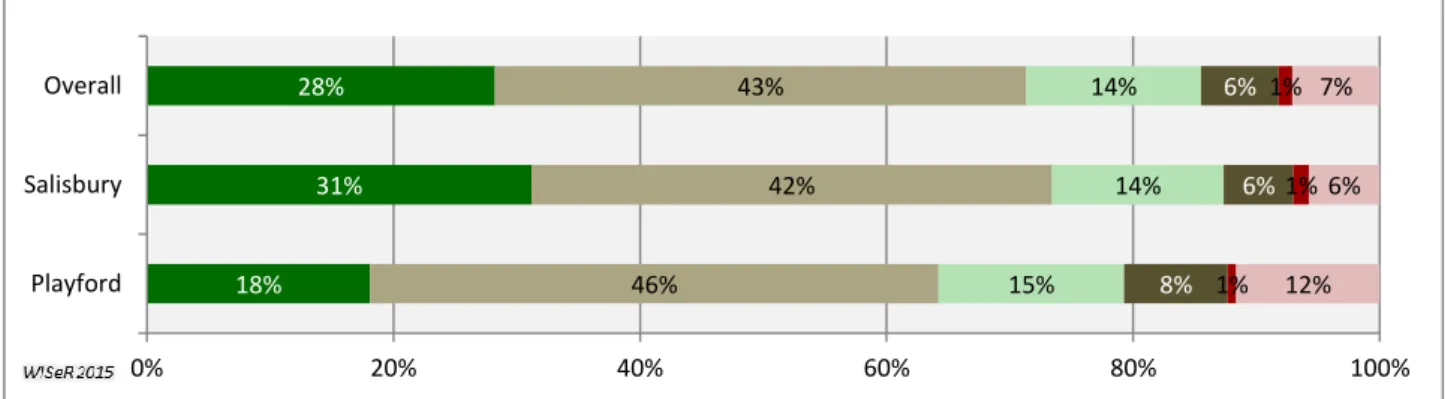
This section provides an analysis of the three aspects of motivation as described in the AMO model by industry group. Health care and social assistance had the lowest percentage (17%) of employers who strongly agreed with this practice, compared to manufacturing (23%), construction (23%) and retail (22%). Just over one in two employers across all industries agreed with the statement, with construction having the highest proportion at 58%.
Just over one in ten employers (12%) in manufacturing, healthcare and social security disagree that their organization has identified and rewarded good performance. Strongly agree Agree Neither agree nor disagree Disagree Strongly disagree Not sure/don't know Nearly all manufacturing, construction, health care, and social assistance institutions agreed that they tried to make workers feel safe in their jobs . Healthcare and social assistance organizations were slightly less likely than the other companies to identify and reward good performance, despite almost three-quarters saying this was the case.
Construction companies previously agreed that there were clear development paths within their organization. Nearly all employers across all industry groups reported trying to make employees feel safe in their jobs (Exhibit 21). Accordingly, disagreement was rare in manufacturing and construction, but occurred in 7% of health and social assistance organizations and 6% of retailers.
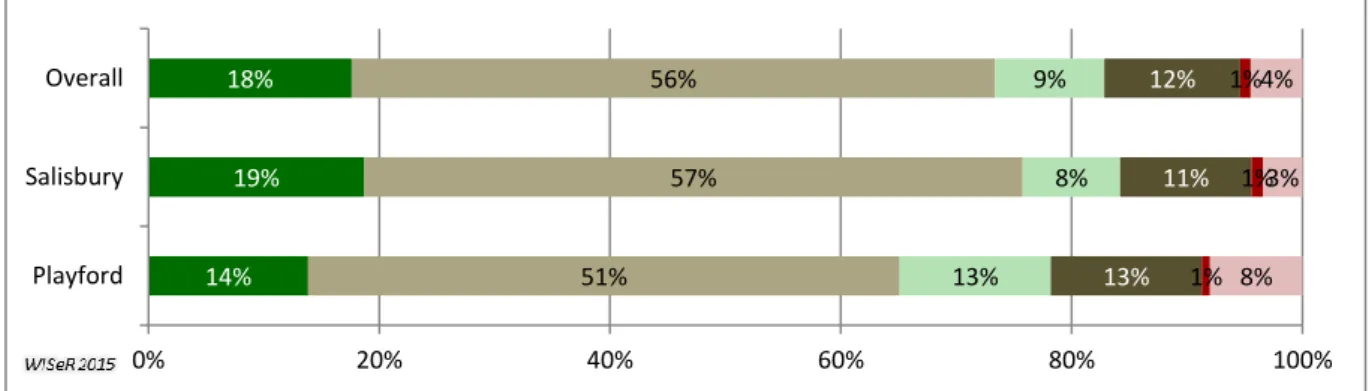
More than two-thirds (69%) of construction employers agreed that they have clear pathways for development within their organization (with 18% strongly agreeing and 51% agreeing; see Figure 22); followed by 61% of manufacturers. Just over one in ten (11%) in the health and social care sector strongly agreed that they have a clear pathway for employee development in their organisations, while a further 50% agreed.
Establishment size
In terms of providing a clear path for employees to develop within the organization, the distribution of responses was generally similar. Small businesses (1 to 4 employees) are more likely to have problems ensuring a clear path, which can be reflected in responses indicating that they were unsure or did not know about a path for development within the organization.
O PPORTUNITY
Industry
Manufacturing firms would most likely agree that they have formal processes for employees to suggest improvements within the organizations (see Figure 29). Manufacturing firms would most likely agree that opportunities were available to participate in meetings and provide improvement suggestions. Approaching 80% of manufacturing and health care and social assistance institutions also provided employees with routine information about business goals and decisions.
About 10% of businesses in construction and retail were unsure or did not know about their processes to support opportunities for this type of two-way communication. Regular meetings between employees and managers are considered an essential tool in the AMO model of HPWP. The construction sector had the highest share of companies strongly agreeing that they held regular employee-manager meetings (24%), with a further 42%.
Notably, around one in five businesses in construction, retail, health and social care disagreed that they have employer-director meetings, the highest and most consistent level of disagreement with the statement. A third aspect of opportunity is shown in Figure 31, where 19% of manufacturing companies strongly agree that management often communicates business goals and. Although nearly four in five (79%) health and social care organizations agreed to some extent that management often communicates goals and decisions, there were fewer organizations that strongly agreed with this statement.
Companies in the retail and construction sectors were the least likely to agree with this statement, with only three in five construction organizations agreeing or strongly agreeing with the statement.
Establishment size
Regular meetings between employees and managers is a key factor that operates via the channel of 'opportunity' in the AMO model. The third factor in cultivating opportunity in the AMO model is the degree to which management communicates broader business goals and decisions, thereby maintaining employee engagement within the organization. For clarity of presentation, uncertain or not applicable responses (up to 3% in Wave 3 and 4% in Waves 1 and 2) are not included in the figures, but are presented in the data tables in Appendix B.
The top four factors affecting organizational performance have been broadly consistent across the three waves of the WFS (see Table 1), indicating that employers continue to face similar concerns in the period between November 2013 and November 2014. Although there is some variation in rank order. , the main concerns were tax pressures, market competition, customer demand and skills shortages. In addition, around two in five employers expressed concern in November 2014 in the areas of customer demand, market competition and skills shortages.
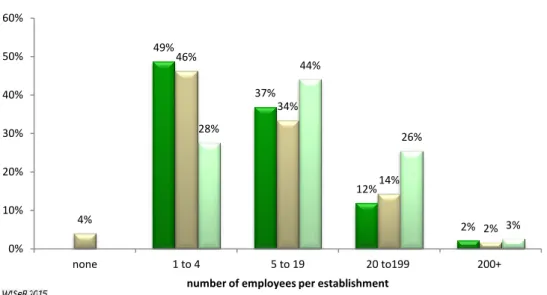
Staff turnover Exchange rate Global environment Opportunities to expand into new markets Access to government funding Skills shortage Market competition Availability of capital Customer demand Tax burden. The distribution of companies defined by the number of current employees is presented in Figure 43 and illustrates the changes in all three waves of the WFS (November 2013, May 2014 and November 2014). While the WFS is limited to establishments with two or more employees, the 2nd and 3rd waves of the survey (May 2014 and November 2014) consist of a small number of organizations with only one employee.18 In the 2nd wave of the survey, this is partly a reflection of the reduction in the number of employees in surveyed organizations from the first round in November 2013 (n=16) and partly due to the inclusion of a small number of companies with a single employee in the replacement supplementary sample in May 2014 (n=12).
In the case of the Wave 3 sample, all six companies reflect a decrease in the number of employees compared to the previous round. 17 The data for November 2014, May 2014 and November 2013 were collected in the study as the number of current employees in the organization, while the data for November 2012 and May 2013 were collected as the reported number of employees in the organization 12 months ago. Respondents to all three waves of the WFS provided recall estimates of the number of employees 12 months earlier.
Establishments in the WFS are classified according to their main activity using the Australian and New Zealand Standard Industrial Classification (ANZSIC) codes. Following the approach used in previous waves of the WFS, businesses were grouped into five broad industry categories to capture the 'industries of interest' in the region.