The paper shows that changes in the disciplinary composition of universities explain little of the proportional improvement in research quality among New Zealand universities. All universities had significant proportional improvements in the average research quality of academic staff (that is, non-administrative staff). There were significant changes in the composition of some of the subject groups; see Appendix A.
Concentration of disciplines
A dominant feature of these results is the generally low degree of concentration of both disciplines within universities and the shares of universities within discipline groups. Otago and Lincoln are the most concentrated in terms of discipline group staff members. The higher concentration in Otago and Lincoln reflects the relatively high proportion of people employed in medicine in Otago and agriculture in Lincoln.
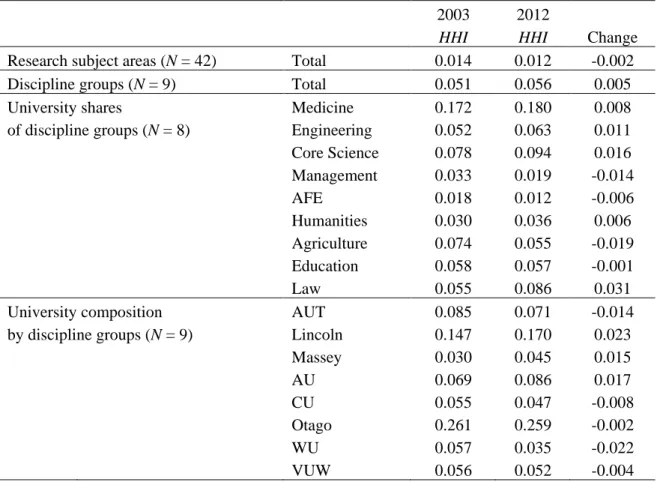
While Auckland also has a relatively high share of medicine portfolios and Victoria a relatively high share of humanities portfolios, there is generally little specialization within or between universities. Given the concentration changes between 2003 and 2012, the PBRF exercise clearly had a negligible effect on the initial degree of specialization. At the level of the 42 subject areas there was a small decrease in concentration, but at the level of the nine subject groups there was a small increase in concentration.
The HHI for the shares of universities for each discipline group shows that the increase in total concentration was mainly due to an increase in the concentration of portfolios among universities in medicine, engineering, basic sciences, humanities and law, which was offset by a lower concentration of portfolios in agriculture and management. and to a lesser extent AFE and education. Lincoln, Massey and Auckland universities became more concentrated, Waikato and AUT less concentrated, while Canterbury, Otago and VUW saw much smaller decreases in concentrations.
Changes in Average Quality Scores (AQSs) by discipline
Definition of the AQS
For each portfolio, a quality category, QC, is determined by a panel assigned to a subject area or group of subject areas.9 The relevant subject panel assesses the quality of each portfolio and assigns a score from 0 to 7 for each of three categories : this is 'research output'; 'peer esteem'; and 'contribution to research environment'. The total score, 𝑆, for an individual is obtained by multiplying the weighted sum of the si values by 100. This is done by applying the same weights or numerical scores, G, applied by the TEC to the QCs achieved by each individual researcher. and using the information indicating their subject area to assign their score to one of the nine discipline groups described in Table 1.11. However, there is a.
10 The recognition that new researchers need time to build their research, publications and academic reputation led in 2006 to the introduction of the new categories C(NE) and R(NE). To account for differences between universities in the treatment of R-grade researchers in 2012, Buckle and Creedy a and 2018b) used total non-administrative staff in full-time equivalents as the denominator. The ratios at the university level between evidence portfolios and total non-administrative staff varied considerably in 2003 and, although the ratio increased for all universities (from about 60 percent in 2003 to 70 percent in 2012), there was still considerable variation between the universities. in 2012 (see Buckle and Creedy, 2018b, pp. 29-30).
However, data on total non-administrative staff (either full-time equivalent or number of employees) are not available at the level of subject areas or discipline groups. As discipline composition also varies substantially between universities (which may mean that the treatment of R-quality researchers may also vary by discipline), the assessment and analysis of changes in the following discipline group AQS should be viewed with heed this warning.
Changes in AQSs of discipline groups
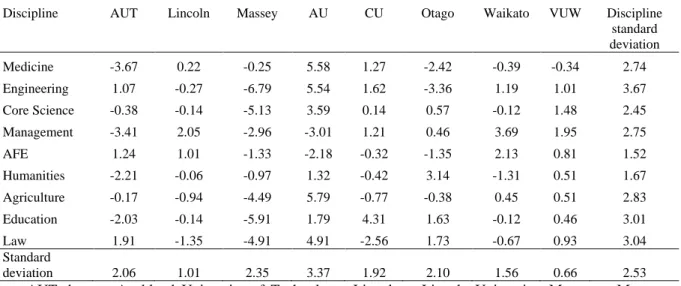
Some disciplines which tend to have significant scope for other labor market opportunities, such as Management, also had relatively low AQS in the initial PBRF round of 2003. Boyle (2008) has demonstrated that subject areas in which researchers in New Zealand universities are underpaid, relative to US university salaries, performed significantly worse in the 2003 PBRF than those in which the degree of underpayment is small. Woelert and McKenzie (2018) find that Australian universities tend to replicate the national performance indicators used in the national PBRF scheme in their individual performance management frameworks for academic staff.
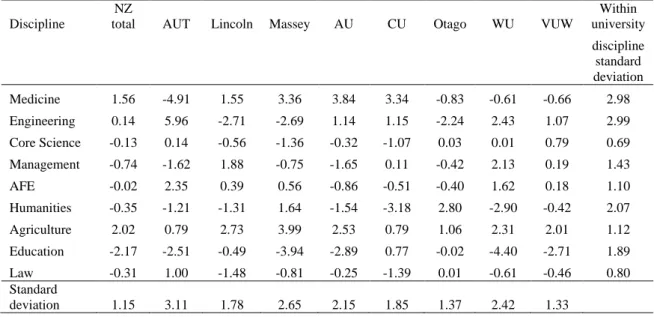
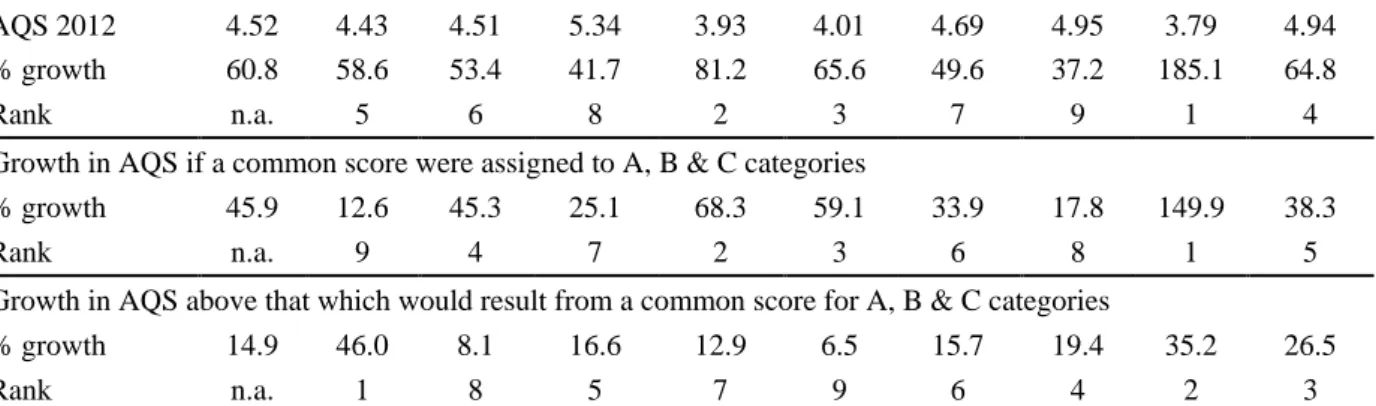
That is, the bottom panel shows the difference between the growth rates of the discipline's AQSs, shown in the top panel and the middle panel; it therefore shows the contribution of the differences between the quality category distribution of the shares of research portfolios in 2003 and 2012. For all disciplines combined, the growth in AQS of submitted portfolios was 60.8 percent.12 The contribution of transforming the distribution of the number of researchers amounted to only 14.9 percent. It is clear that the reduction in the proportion of R-quality researchers (either due to a net reduction of R-quality researchers due to a failure to submit a portfolio, or due to exits exceeding the number of new entrants ) has been the main factor contributing to the rise in overall AQS.
Medicine and Agriculture gained more than fifty percent of the improvement in the AQS for those disciplines from a change in the distribution of the stock of researchers across the quality categories: Medicine gained 78 percent (i.e. and Agriculture 52 percent (i.e. for all others) disciplines the proportion of the improvement was less than fifty percent.13 This variation in the sources of improvement in AQSs suggests that the transitions between 2003 and 2012 varied between disciplines.

Quality category transitions by research discipline
Transitions for all disciplines combined
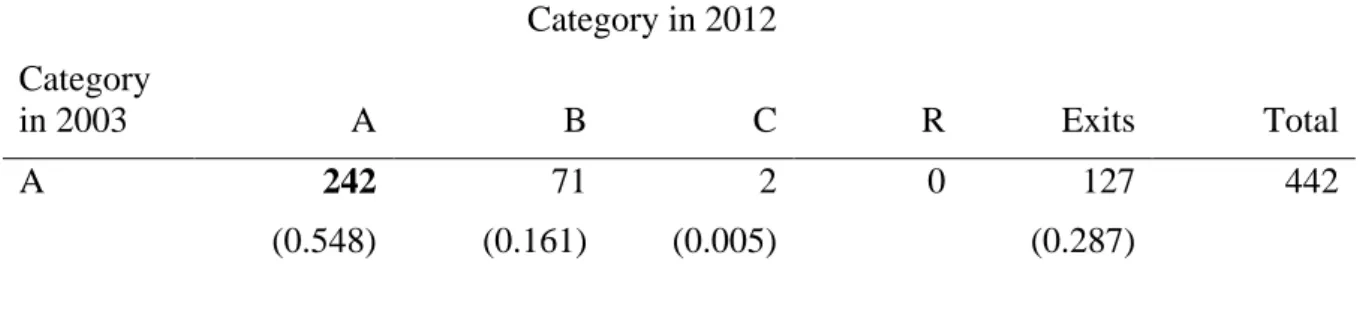
For any university and discipline with an AQS in 2003 below 2, recruiting a C-quality researcher would increase their score. 15 However, as explained in Buckle and Creedy (2018a), the proportions of exits are somewhat misleading because some of the individuals could simply have been given new contracts, which meant they avoided the need to submit a portfolio. Just under 20 percent of 2003 R's moved up to become C's at the same institution in 2012, and 6 percent moved up to B's, although again this may overstate the actual rate of improvement (since the denominator excludes those who did not submit a portfolio , although this was less important in 2003).
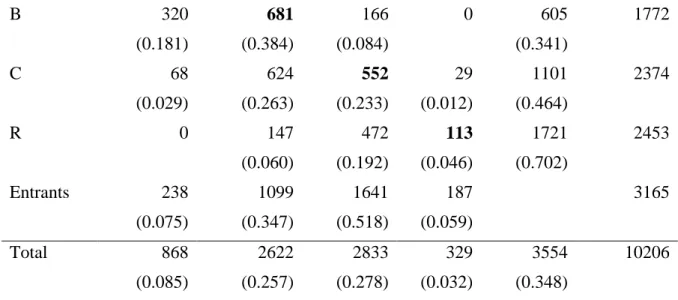
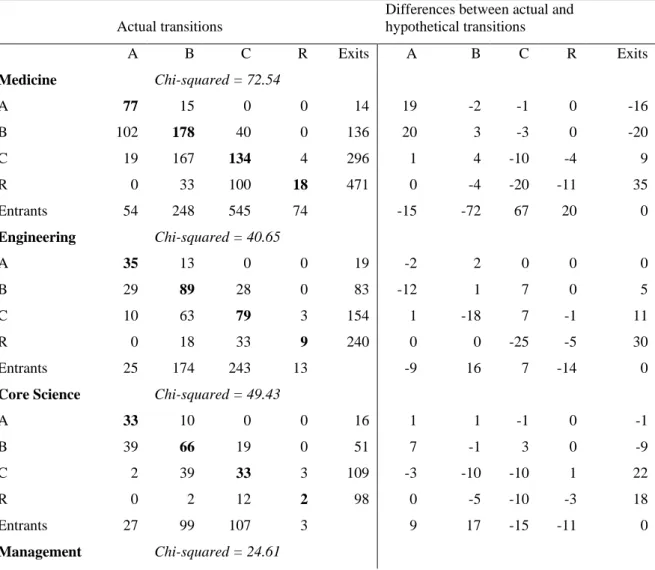
This is done in Table 7, which shows the distribution of total portfolios submitted in 2003 by quality category and how exits and entries and transitions from one QC to another of research staff submitting portfolios in both periods affected the change between in 2003 and 2012.16. On the other hand, the majority of registered researchers were of C and B quality (52 and 35 percent, respectively). Changes in the quality of researchers submitting portfolios in both periods show a clear pattern of an increase of 671 B and A quality researchers, offset mainly by a large decline in R quality researchers.
Comparison of the ratios of the total portfolios in each QC shows a large drop in the share of R-quality portfolios, from 35 percent of the total in 2003 to just 5 percent in 2012, offset by increases in the ratios of all other QCs in 2012. As can be clearly seen from Tables 6 and 7, changes in AQSs (whether research areas, discipline groups or universities) can arise both from an improvement in the research quality of individuals who remain in the university system and from the replacement of lower with better performing researchers.
Transitions for individual disciplines
This appears to be primarily due to transitions involving R-quality researchers: a relatively small number of R's (and C's) exit, a large number enter, and a large number remain as R-quality. This is all relative to the numbers expected if the pass ratios were the same as for all disciplines combined. In medicine, there has been a slight increase in the number of portfolios submitted, but the transition pattern is also significantly different from the pattern for all disciplines combined shown in Table 6.
Medicine has a relatively low exit and low entry of A and B quality researchers, but relatively high exit and high entry of C and R quality researchers. This appears to be attributable to a relatively large exit and low entry of C and R quality researchers and a relatively low exit and high entry of A and B quality researchers compared to transition shares for all disciplines combined. The fourth highest chi-square value is for Engineering, and the differences from the transitions for the combined discipline pattern are similar to the differences shown by Core Science, in particular the large exit of R and C quality researchers, relatively low entry of R and high entry of B - quality researchers.
Humanities also had a relatively high exit and low entry of C and R quality researchers and a very high entry of B quality researchers. However, it shows a relatively high exit and low entry of C and R quality researchers and a high entry of A and B quality researchers.
Contributions of changes in quality and discipline composition to changes in university research quality
A decomposition of the contributions to a university AQS
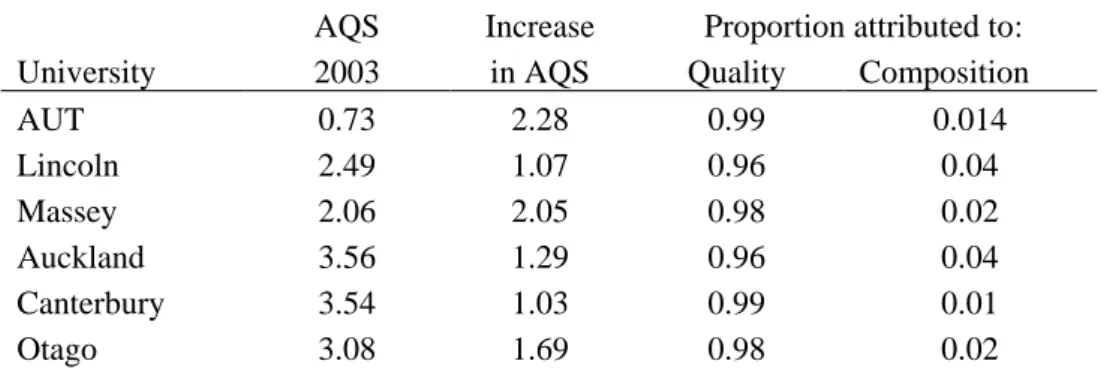
The second semester reflects the change in AQS attributed to the university's changed disciplinary composition, given the quality of staff in period 0. The second semester reflects the change in AQS attributed to the university's changed disciplinary composition, given the quality of staff in period 1. The top panel shows , that for all universities the majority of the improvement in AQS between 2003 and 2012 was due to improvements in the quality of researchers for whom portfolios were submitted.
The average value of the proportional contributions of quality improvement to the improvement of university AQS is 98 percent. However, education is the only discipline that has lost relatively large numbers, and the early years of the PBRF saw significant institutional changes, including the merger of colleges of education with universities. As explained in section 4.1, the TEC decided on the eve of the 2012 PBRF round that universities could choose not to submit portfolios for researchers they considered to be of R quality.
Some indication of the possible effect on the decomposition of this change can be obtained by setting all non-portfolios equal to R. The overall contribution of quality improvement falls from 98 percent to 84 percent, and the contribution of the change in discipline composition increases from 2 percent . to 14 per cent.
Conclusions
For VUW, the effect is only 1 percent due to the high proportion of all non-administrative staff for whom research portfolios have been submitted. The aim of the PBRF was to increase the research quality of staff in New Zealand's tertiary education sector. However, it is not clear whether the plan's architects intended it to result in changes in the distribution of resources between disciplines and between universities.
Moreover, changes in the composition of disciplines at universities contributed only a small proportion to the improvement in the average research quality of staff. The turnover rate, T, from period 1 to 2 can be expressed as the number of exits, X, as a proportion of the average number of people in the period. The development of research quality in New Zealand universities as measured by the performance-based research fund process.
The impact on research quality of performance-based funding: the case of New Zealand's PBRF scheme. An evaluation of metrics used by the Performance Based Research Funding process in New Zealand.