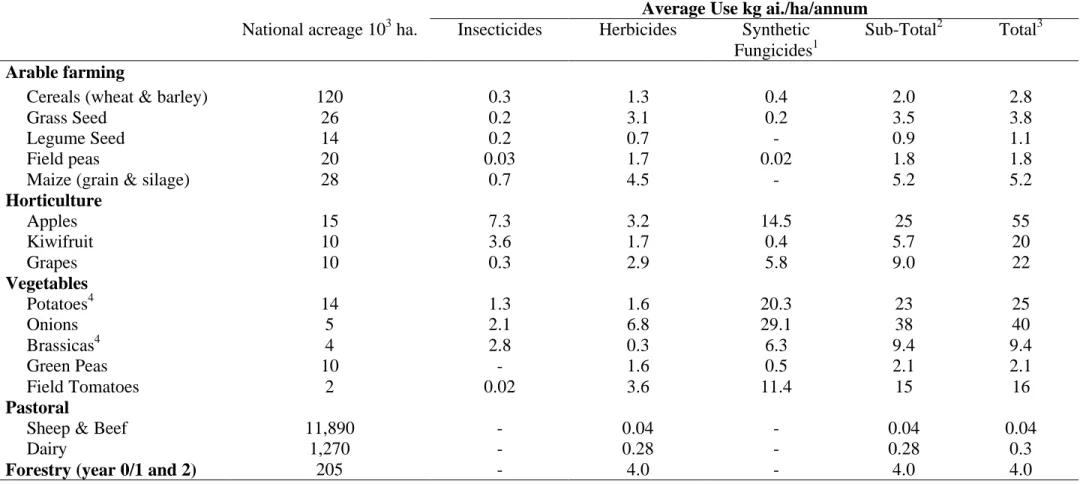
The main focus of this report was on the wider issues of regulation and effects of pesticide use in New Zealand. Loading – average amount of pesticide active ingredient in each class applied per unit area of land treated per year. Amount – the total amount of active pesticide ingredient in a class applied to the soil in that sector/region per year.
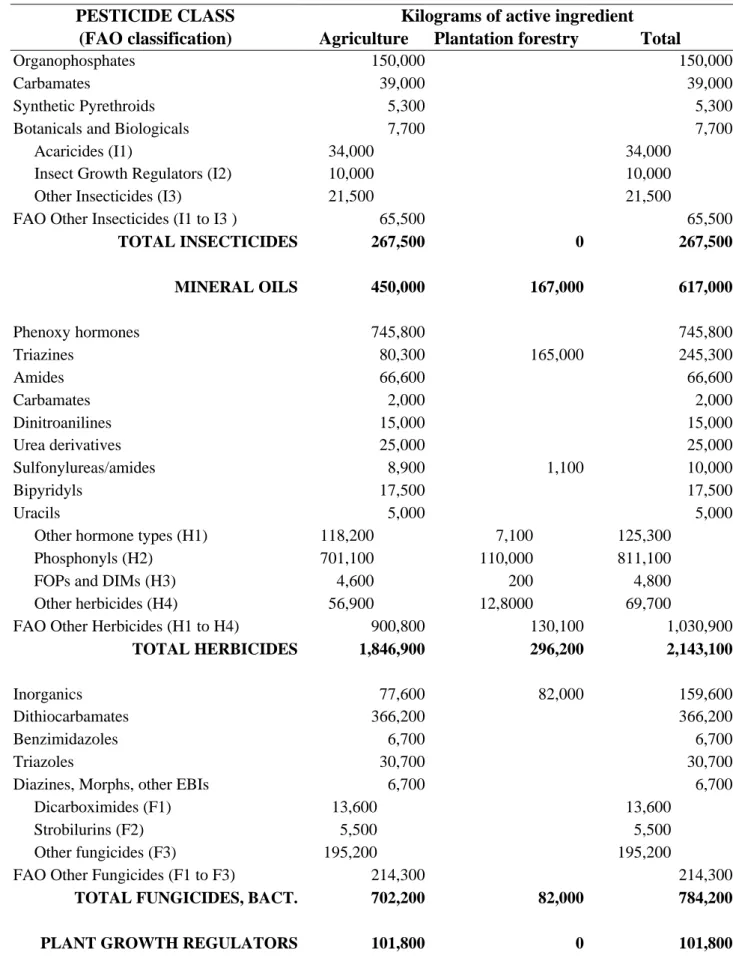
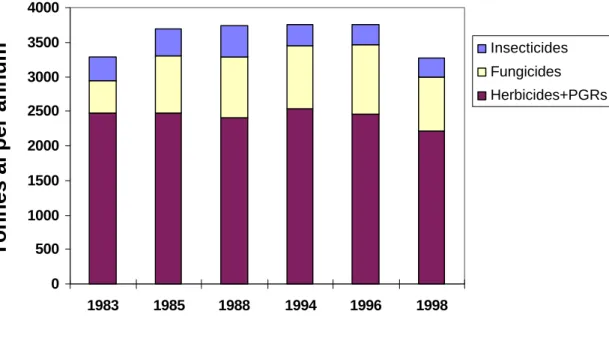
Trends in Overall Pesticide Use 1984-1998
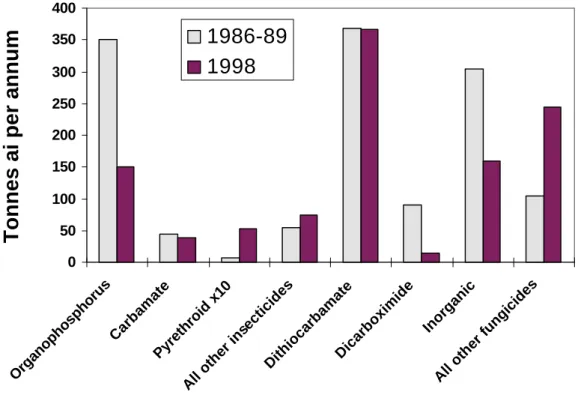
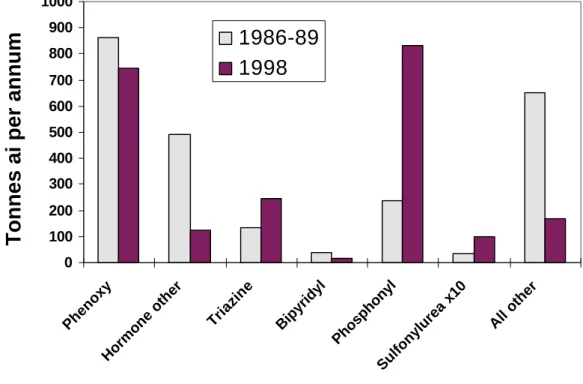
Some difficulties arise with the comparability of the datasets used to plot these trends. There have been similar declines in the use of bipyridyl paraquat and a number of other older herbicides. The use of triazine herbicides has increased by 90% in the past decade, probably due to increased use in crops and forestry.
Pesticide Use in Arable Crops
Pesticide Use in Apples
Pesticide Use in Kiwifruit
Pesticide Use in Other Horticultural Crops
However, powdery mildew during the growing season and Botrytis cinerea at harvest are highly significant diseases and relatively intensive fungicide programs are often followed in the wine grape industry. The use of dicarboximide is decreasing due to resistance in Botrytis and transfer of residues to fruit in the wine. However, for the 1998/99 trial season, only small reductions in pesticide use resulted, with disease pressure difficult to manage.
Berries are a diverse sector and three crops were chosen for study: blackberries, boysenberries and blueberries. All are relatively small on an acreage basis, but have interesting pest control issues that affect trends in pesticide use. Industry groups have made available a large number of spray diaries to enable robust estimates for the average pesticide use in each crop for the regions with the greatest production (Appendix 9).
In the case of boysenberries, Nelson was included as the district with the highest production, although it falls outside the regions surveyed. Blackcurrants and blueberries have few serious pest and disease problems and pesticide use is relatively low.
Pesticide Use in Vegetable Production
Franklin District seeks to improve management practices in vegetable production, although pesticide use is secondary to addressing erosion, fertilizer use and other soil factors. These crops are characterized by separate plantings for summer and winter production with some corresponding differences in pest control requirements. These seasonal uses are listed separately in Appendix 11 and the quantities are per crop rotation (approximately 3 to 8 months).
Summer crops were treated with more insecticides, while winter crops received more fungicides. The use of insecticides has now succeeded in reducing the development of resistance in major pests, and Bt has been applied to a large proportion of brassica crops. Pesticide use in major processed vegetables such as tomatoes, asparagus, sweet corn and green peas is summarized in Appendices 12, 13 and 14.
Estimates are based on a combination of the company's spray diaries and the consultants' specialist knowledge. Asparagus requires careful attention for weed control and residual triazines, ureas or bromacil (uracil class) early in the growing season are relied upon to provide long-term control. Organic production of these crops in Hawkes Bay/Gisborne eliminates these herbicides at the cost of more extensive mechanical cultivation.
Pesticide Use in Pastoral Agriculture
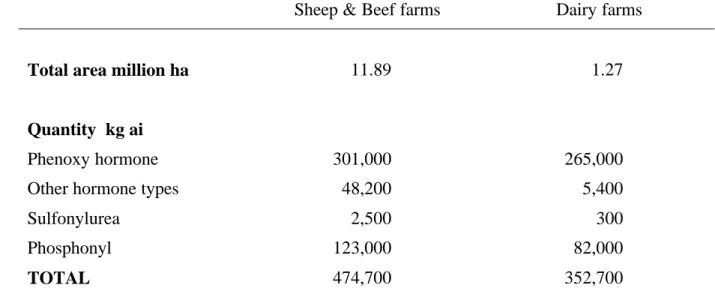
Pesticide use in pastoral agriculture continues to be dominated by phenoxy hormone products to control broadleaf weeds in established or established grasslands. The percentage of area treated was much lower on sheep/beef farms, although most use would have been on flat to rolling rather than hilly land. Brush weed control used metsulfuron-methyl (sulfonylurea class), glyphosate (phosphonyl) and other hormone types, with a total of approx. 0.9% of the sheep/beef soil was treated.
Insecticide use was very low with the treatment of most pests being uneconomic and for most soil-dwelling pests also ineffective. Only very small areas of land in northern districts have been treated with fungicide to control the fungus (Pithomyces chartarum) which causes facial eczema in livestock.
Pesticide Use in Plantation Forestry
Organic Production
Comparisons Between Sectors
Their often higher rates of use also mask changes in synthetic pesticide use data. Objective comparisons of pesticide use for the purposes of identifying trends and influencing factors are only possible for similar land uses and with consistent data sets. This report contains some comments on national trends in the studied sectors (Sections 4.3-4.10).
The extension to international comparisons by sector requires a thorough review of the available data for other countries.
General Factors Influencing Pesticide Use
New Zealand's pesticide registration will soon be changed to the Environmental Risk Management Authority (ERMA) under HSNO legislation. Re-registration procedures in many OECD countries are also leading to older pesticides being withdrawn from the market. Producer groups often establish more specific guidelines for pesticide use to ensure that market requirements for export products are met.
Waste storage and disposal – excess formulation or spray mix and empty containers are major hazards associated with pesticide use. The extensive publicity over the past 30 years about actual, potential and perceived adverse effects on humans and the environment has led to a much reduced acceptance of any risks associated with pesticide use. A 1994 study cited by the Parliamentary Commissioner for the Environment (Williams, 1997) indicated that 35% of New Zealanders consider pesticides and chemicals used in agriculture to be extremely or very dangerous threats to the environment.
Local and regional initiatives are currently directly influencing pesticide use by banning herbicide use in some public areas and developing regional laws to control spray drift. Agrochemical development – Pesticides used in New Zealand are almost exclusively developed by international agrochemical companies and initially registered overseas. Most of these trends are likely to result in a reduced range of options for pesticide-based plant protection, particularly for the many New Zealand uses that are minor by international standards.
A key issue for the continued use of many of these older pesticides is whether sufficient data can or will be provided to support their continued registration in North America and Europe.
Risk Assessment and Pesticide Policies
Also, some of the greatest risks posed by modern pesticides come from careless or illegal use, handling and waste disposal. However, there are few holistic studies of the overall cost/benefit and environmental accounting of pesticides in our most important agricultural sectors. Development of pesticide risk indicators for use as policy tools at national or regional level is an ongoing project of the OECD Working Group on Pesticides.
The focus was on the impact on pesticide use at the individual farm level, and the final recommendation was “Development of a harmonized scientific framework for pesticide indicators in the EU. It was also recommended that "various stakeholders (farmer organisations, the pesticide industry, the environmental community) should be involved in the development of this framework". The types of tools explored in the EU CAPER project would be useful in focusing attention on some of the use practices likely to be the most risky in New Zealand.
However, a broader view of risk may be needed to fully address the sustainability of usage patterns. Individual data on pesticide use is also required when the hazards within a class of pesticide vary widely. It is also important not to isolate pesticide use as a separate problem, as many other factors also contribute to the overall sustainability of agricultural systems.
The success of Kiwigreen in kiwifruit is a remarkable example of what a sector can achieve to change pesticide use in a relatively short time.
CONCLUSIONS
The FAO pesticide classification system should form the basis for summarizing pesticide use data. Advice should be provided to FAO on the corrections and further subclasses needed to stabilize and normalize the FAO disaggregated data set for future use. AGCARM should be encouraged to continue their surveys of national pesticide sales and to make annual summaries available to MAF for policy purposes.
AGCARM should be encouraged to compile its survey data for reporting based on the FAO classification system as adapted in this report for use in New Zealand. Sector and producer groups at MAF should be encouraged to collect pesticide end-user data and make summaries available for policy purposes. The spray log recording systems used by many sectors are a good basis, but greater emphasis should be placed on entering complete data, including all seasonal dormant sprays and herbicide applications.
Other regular market surveys (retailers or end-users) should be encouraged to determine patterns of pesticide use in sectors such as pastoral agriculture, which are less amenable to spray diary systems. Further analysis of pesticide use patterns should be conducted at the sector and individual end-user level to establish uses and practices that are significant ongoing risks (applicator, production system sustainability, environment, food chain, etc.). For this purpose, links should be developed with the OECD, the EU and other international initiatives for the development of pesticide risk indicators.
Sectors should be guided and encouraged to implement these MAF policies on pesticide use as part of the national strategy.
ACKNOWLEDGEMENTS
Campbell and J Fairweather, 1997: Organic farming in New Zealand: An evaluation of the present and future prospects, including an assessment of research needs. Batchelor, 1997: Integrated fruit production for New Zealand stone fruits: evaluation of pest management in a pilot program. An economic and social assessment of the onion industry with special reference to the impact of onion white rot disease in the Pukekohe area.
Williams, 1997: Maintaining ecosystem health in the 21st century: The challenges for plant protection science, industry and users.
Appendices
- Pesticide (FAO classification) for products registered in New Zealand INSECTICIDES
- Pesticide use in cereals (wheat and barley) and field peas 1998/99
- Pesticide use in herbage seed and crops in Canterbury, 1998/99
- Pesticide use in maize 1998/99
- Pesticide use in apple production 1998/99
- Pesticide use in kiwifruit 1998/99
- Pesticide use in avocado and citrus (Bay of Plenty 1998/99) and wine grapes (Hawkes Bay 1998/99)
- Pesticide use in blackcurrants (Canterbury), boysenberries (Nelson and Canterbury), blueberries (Waikato) 1998/99
- Pesticide use in field tomatoes (Hawkes Bay), potatoes and onions (Waikato/Pukekohe) 1998/99
- Pesticide use in lettuce and vegetable brassicas (cabbage, cauliflower, broccoli) in the Waikato/Pukekohe region 1998/99
- Pesticide use in asparagus 1998/99
- Pesticide use in sweet corn 1998/99
- Pesticide use in green peas 1998/99
- Pesticide use in sheep & beef pastoral farming 1997/98
- Pesticide use in dairy pastoral farming 1997/98
- Pesticide use in plantation forestry 1998/99 (year 0/1 - replant and new plantings)
- Pesticide use in forestry 1998/99 (year 2 - replant and new plantings)
- Pesticide use in forestry 1998/99 (years 3-30 )
Diazines, Morphs, other EBIs Dicarboximides (F1) Strobilurins (F2) Other fungicides (F3) FAO Other fungicides F1-3. Canterbury Hawkes Bay Waikato BOP/Rotorua. PESTICIDE CLASS Usage Loading Total Usage Usage Loading Total Usage Usage Loading Total Usage Usage Loading Total Usage. Pesticides Usage Loading Total Usage Usage Loading Total Usage Usage Loading Total Usage Usage Loading Total Usage.
