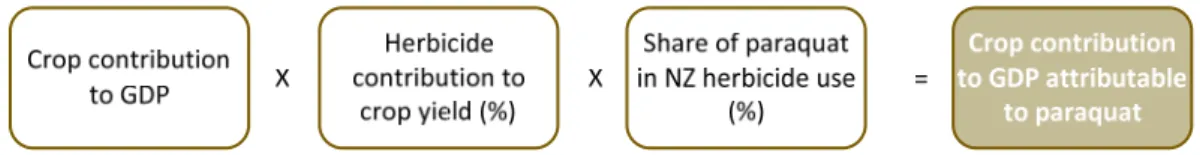
Sapere Research Group is one of Australasia's largest expert consultancy firms and a leader in the provision of independent economic, forensic accounting and public policy services. Paraquat use contributes $30-60 million to annual gross domestic product, which could be lost if a ban were to be imposed. Using available information, stakeholder views and relevant assumptions, we have been able to estimate the actual contribution of paraquat to national income (GDP).
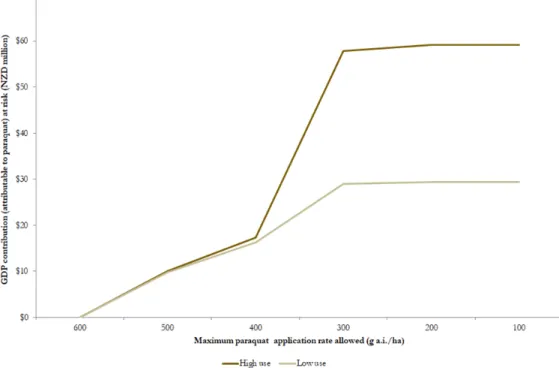
Assuming an effective ban on paraquat and no effective herbicide substitution, the upper bound loss in GDP would be the inverse of the baseline figures above. Limiting the maximum application rate to 300 grams of active ingredient per hectare (g a.i./ha) would put about $58 million worth of GDP at risk. The more restrictive case of a maximum application rate of 300 g a.i./ha could result in jeopardizing approximately 96 percent of the existing annual GDP contribution (about $58 million), largely driven by impacts on clover.
This figure uses a high use assumption regarding paraquat as a proportion of herbicide use. A less restrictive case of a maximum application rate of 400 g a.i./ha would risk around 29 percent of the existing annual GDP contribution (about USD 17 million). Our estimates are subject to a number of limitations, the most important of which relate to assumptions about recovery and proportional use of paraquat.
To the extent that any of the limitations can be addressed in the future, the estimates produced in this work will be more robust and/or precise.
Introduction
Understanding costs and benefits of paraquat
- Paraquat sales and application rates
- Estimated sales were around 46 tonnes in 2017, up from
- Application rates for our sample vary from a low of 27 grams
- Beneficial properties of paraquat
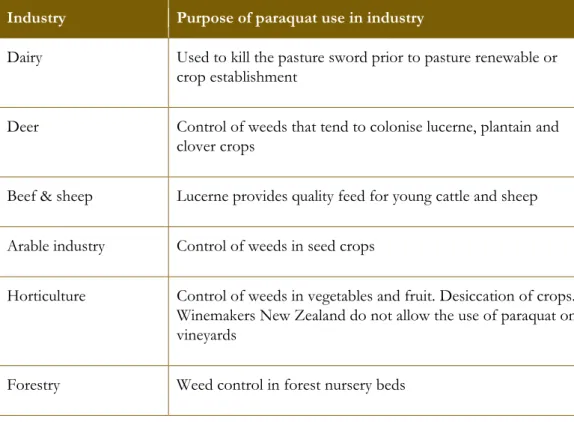
- Users and uses of paraquat
- Relative importance of paraquat
- Alternatives to paraquat
- Costs associated with paraquat use
- Environmental effects
- Human health effects
EPA issued a Call for Information (CFI) on the use of paraquat, which gathered knowledge about existing beneficial uses of paraquat. Broad applicability - paraquat is used at different times and stages of crop growth and paraquat labels contain more generic than crop-specific claims. Contributing to weed resistance management - paraquat is in a different chemical group than other herbicide options and offers an additional mode of action to manage (or avoid) weed resistance, which is a major concern for the stability of the fields and.
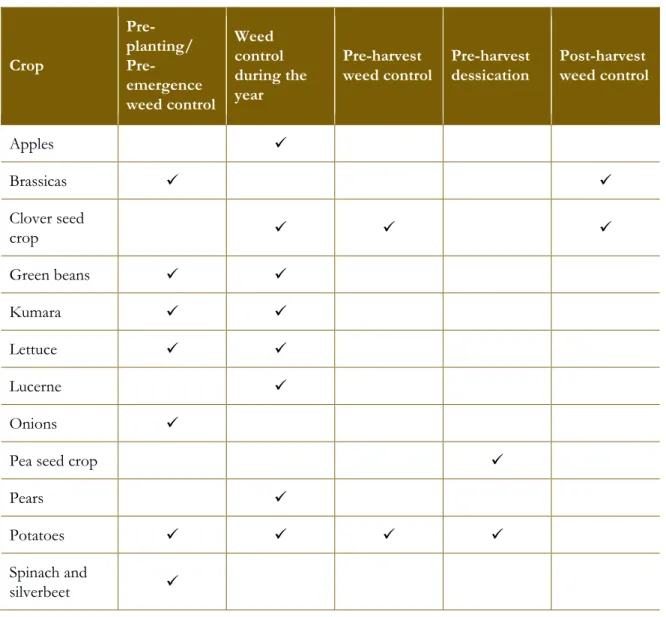
Rapid adsorption in the soil – paraquat is rapidly adsorbed in the soil, deactivating its herbicidal activity. Specifically with respect to crops, the use of paraquat varies across the life cycle of the specific crop, further indicating the range of beneficial use of paraquat. An important driver of the impact of the alternative scenarios (ie banning or restricting the use of paraquat) is the availability of substitutes.
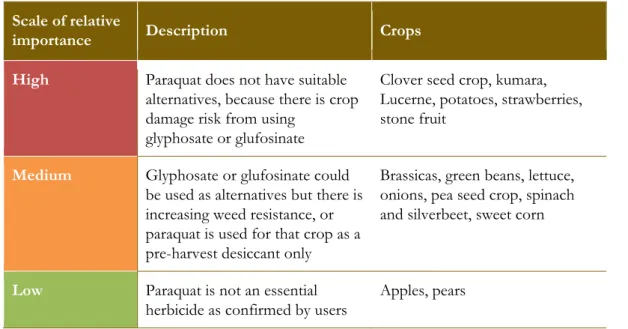
Notwithstanding the inherent difficulties in establishing a complete understanding of the suitability of an alternative to paraquat, given the key role such understandings play in the analysis of all three scenarios, we have attempted to summarize the importance of paraquat relative to glyphosate and glufosinate. The importance categories reflect the different stages of the crop life cycle for which paraquat is used in different crops. 4 Submissions of the Federated Farmers and the Foundation for Agriculture re-evaluation of paraquat and paraquat-containing substances, p. 6 or p. 2.
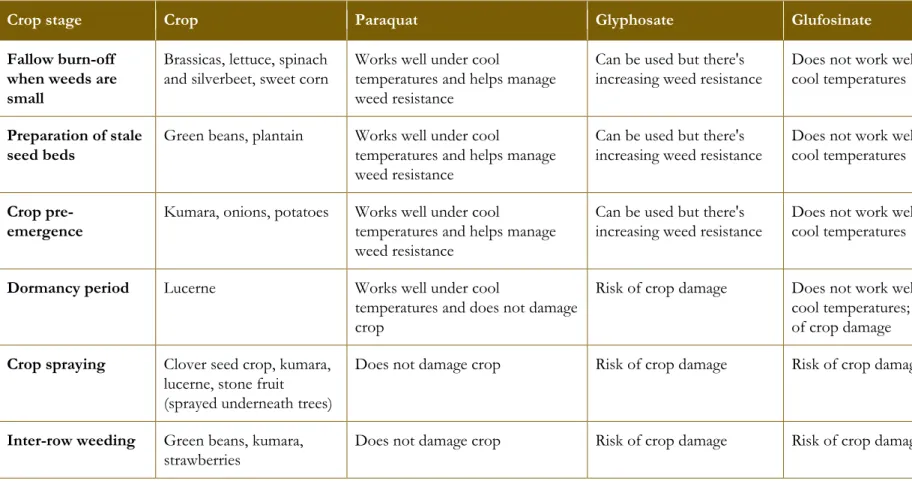
Medium Glyphosate or glufosinate could be used as alternatives, but there is increasing weed resistance, or paraquat is only used for the crop as a pre-harvest desiccant. Meanwhile, Table 4 provides an overview of the importance of paraquat use compared to glyphosate and glufosinate for different stages of the crop life cycle. Risk of crop damage Does not perform well in cool temperatures; also risk of crop damage.
Given the time constraints (and scope) of this study, our treatment of these cost impacts is less detailed than would otherwise be the case (ie the material is primarily qualitative and risk-based). Perhaps not surprisingly, our examination of existing material on the environmental effects of paraquat use indicates that risks to the environment tend to be related to the rate at which paraquat is applied. Risks of groundwater contamination are expected to be low given the high absorption of paraquat and the fact that it is almost immobile in soil.
The difficulty of quantifying and monetizing environmental impacts limits our ability to fully weigh the potential costs of using paraquat against the estimated benefits. A literature review of the effects of paraquat use on human health suggested that a wide variety of relevant articles and reports existed.
Estimation of economic impact of paraquat
Baseline scenario
- Overview of approach
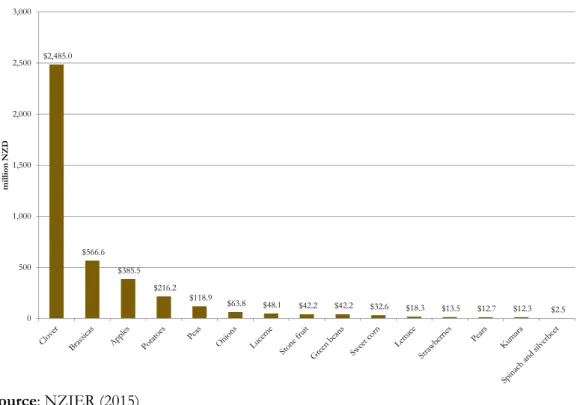
- Crop contribution to GDP is around $4 billion
- Paraquat contribution to GDP is $30 million-$60 million per
However, the report is not scheduled to be completed until March 2019, which means we cannot use it at this time. For most crops, we calculated the herbicide contribution to crop yield using the estimates in a 2007 paper for the United States. That is, we convert existing data from elsewhere to their New Zealand equivalent to make the estimates as New Zealand-specific and relevant as possible.
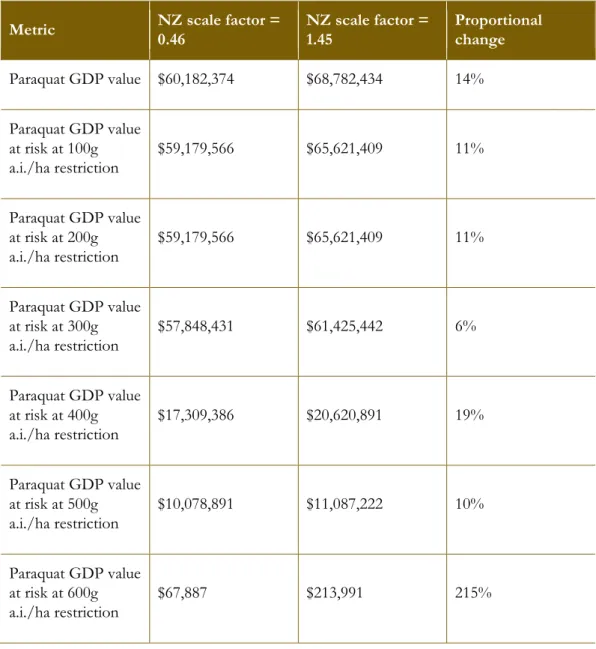
The conversion process used to derive a New Zealand equivalent factor comes from a paper estimating the economic impact of paraquat in Australia.10 The adjustment is essentially a scaling factor that measures crop protection product (CPP) use , including herbicides, relates to the total number of hectares. in use. We estimate a scale factor of 0.46, which broadly means that the intensity of herbicide use in New Zealand is less than half that of the US. Australia was estimated at 1.45.11 This is consistent with our understanding (based on a herbicide manufacturer) that weed resistance is a much bigger problem in Australia than in New Zealand.
In the absence of specific data, we rely on assumptions derived from other available sources for this parameter. We adopt a range determined by a 'high' and a 'low' percentage share of New Zealand herbicide use related to paraquat. The figure used for the low case in 1 percent, while the high case uses 3.2 percent.
The higher figure is based on Manktelow (2005) representing the proportion of paraquat use in Australia as a proportion of total herbicides.12 The lower figure represents the smallest proportion of paraquat out of total herbicide sales reported by New Zealand importers and producers, as we have investigated We note that the actual proportion of total herbicide use explained by paraquat would vary by crop, but we only had crop-specific data for kumara Where paraquat is only used for seed crops, the entire value chain of the crop is considered, given that seeds are eventually used to produce the crop used by dependent industries.
The main contributor to this total is clover, which accounts for more than half of the total, mainly due to its value as a raw material. It may be that other products and/or innovative solutions emerge that make the estimates lower.
Restricted use scenario
- Scenario description
- Reductions in GDP most material at 300 g a.i/ha, due mainly
In addition, we estimate an illustrative limited scenario, where paraquat is still available, but the maximum application rate is limited (i.e. 300 g a.i./ha; and 400 g a.i./ha).14. Option A allows some use in alfalfa production; while option B does not allow its use in alfalfa production. This would also have the effect of banning the use of paraquat for spot treatment with handheld devices.
We focus on the impact of restrictions on the maximum application rate used for each crop and assume that if the maximum required application rate cannot currently be used in a stage of the crop's life cycle in the constrained (future) scenario, the entire the value of the crop is at risk. This gives us an upper limit for the risk value (measured by paraquat's contribution to GDP) from use restrictions. The upper limit of paraquat value at risk assumes that paraquat use in crops for which paraquat use is of medium or high importance (as defined in Table 3) cannot be replaced by other herbicides.
The use of paraquat in crops where paraquat is of low importance is assumed to be easily interchangeable with other herbicides. At a maximum application rate of 400 g a.i./ha, the upper bound potential loss in annual GDP is approximately $17 million, while at a maximum application rate of 400 g a.i./ha, the potential loss in annual GDP is approximately $58 million. The graph below shows the percentage of paraquat baseline value at risk from different levels of restricted use.
Given the importance of clover in terms of contribution to GDP (see Table 5), the maximum clover application rate of 400 g a.i./ha is an important driver of the dramatic increase in GDP value threatened by paraquat restrictions at maximum application rates of less than 400 g a.i./ha.

Sensitivity analysis
- Results largely insensitive to scale factor changes
- Other parameter changes
In addition to changing the scale factor, we could have undertaken sensitivity analysis of the results to changes in the assumed paraquat contribution to yields and/or the share of. The latter is particularly important for clover, where expert opinion has supported an herbicide contribution to yield of 50 percent. To the extent that that share of total herbicide use on clover explained by paraquat is above the assumed maximum we used (3.2%), our results may change markedly.
Unfortunately, we do not have further reliable evidence on which to base a change. It is possible that the numbers we have used will trigger a response from relevant experts (or further work) so that alternative values can be used in such a sensitivity analysis in the future.
Paraquat application rates
New Zealand scale factor
Crop yield attributable to herbicide use
Aquatic acute risk assessment results