Monitoring and Evaluation is an integral part of the natural resource management (NRM) project cycle. This review describes some of the strengths and weaknesses of the State's NAP and NHT2 M&E Implementation Plan and provides recommendations to improve future monitoring and.
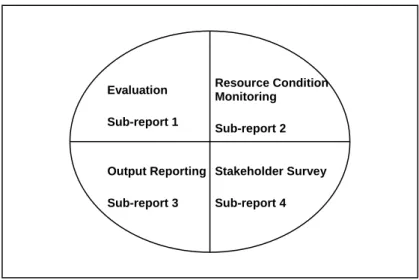
Key findings and recommendations for improvement – by sub-report
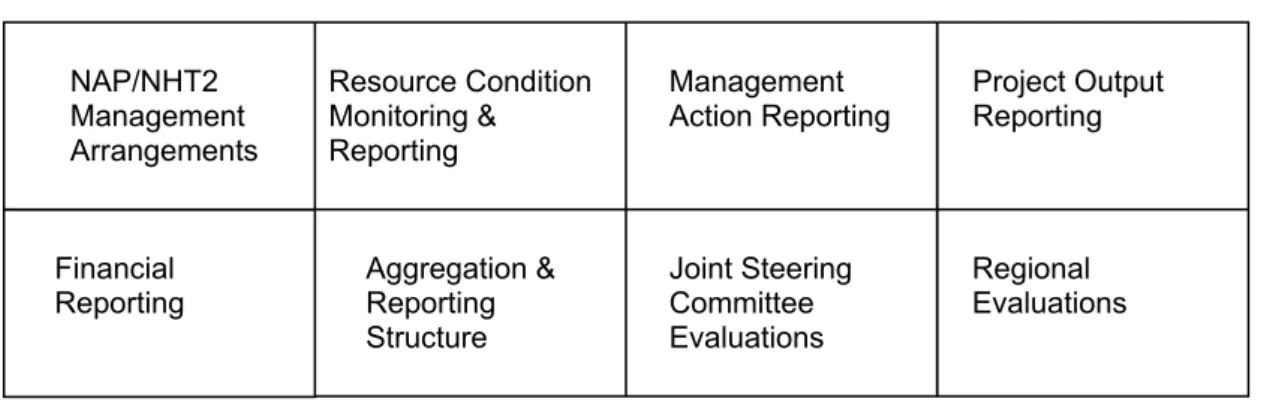
The State M&E Team and WAMEAC were responsible for leading the implementation of this plan on a state scale. Four years of data collection on progress towards long-term targets (management action and resource condition targets).
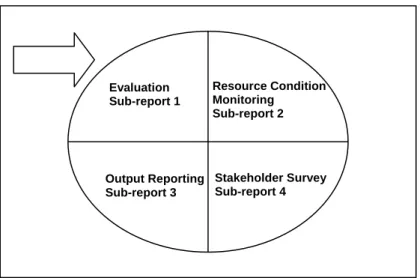
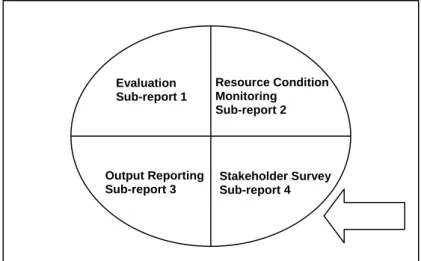
Sub-report 1 – Evaluation
Sub-report 2 – Resource condition monitoring
Sub-report 3 – Output reporting
Sub-report 4 – Stakeholder survey
Key recommended actions from this review
Conclusion
Table of review recommendations
A new M&E plan is to be completed that is state-wide and provides leadership in monitoring and evaluation in NRM in WA. The new M&E plan must have a clear purpose with clear roles and responsibilities explained in plain language.
Sub-report 1
NAP AND NHT2
EVALUATIONS 2003–2008
Author: C Pengelly
Executive summary
Introduction
Background
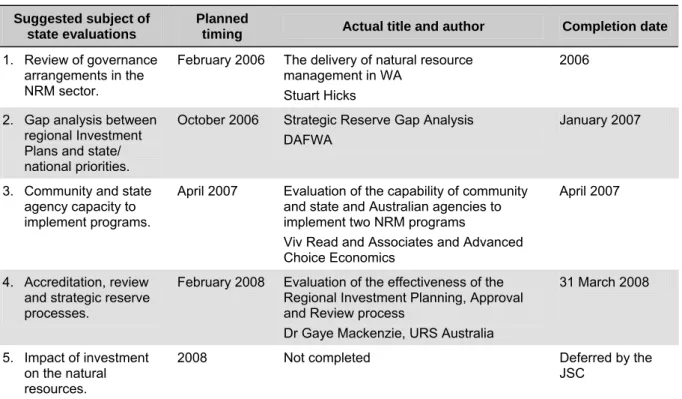
Completed evaluations
Adopting these recommendations will allow us to reap the benefits of improved evaluation processes and make improvements to maximize the results of future NRM programs. April 2007 Evaluation of the ability of community and state and Australian agencies to implement two NRM programs.
Key themes across the state evaluations
Assessment criteria for NRM documentation needs to be reviewed to enable state level assessors to make appropriate funding decisions and additional time is required to enable high quality decision making. Reporting requirements are seen as a problem in the regions and must be revised.
What we learnt from the state evaluation process
Recommendations
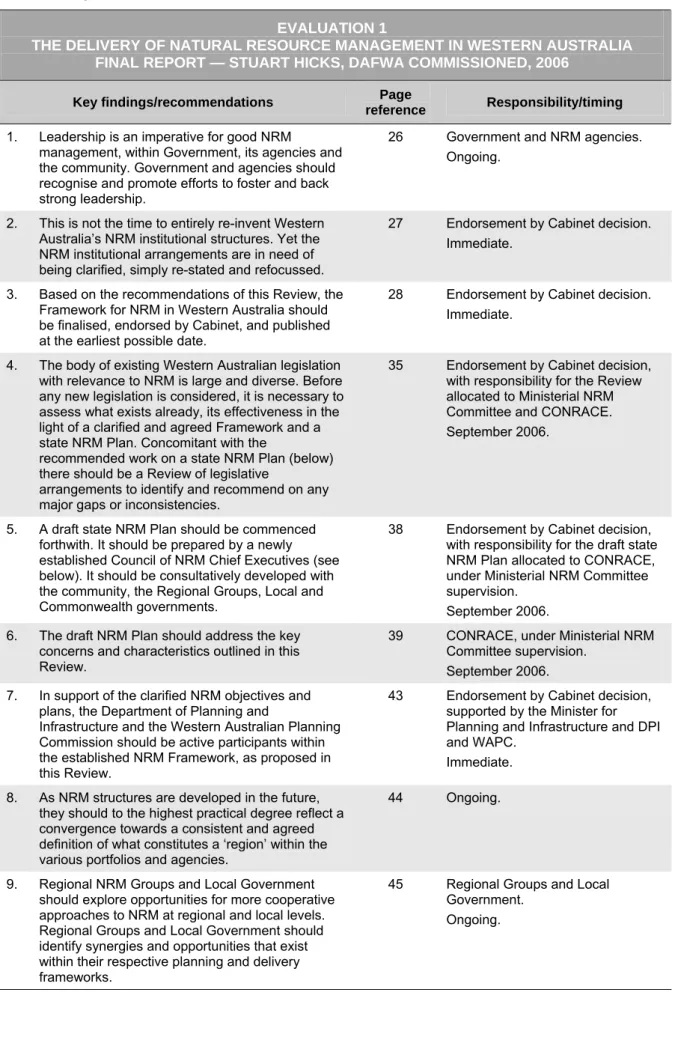
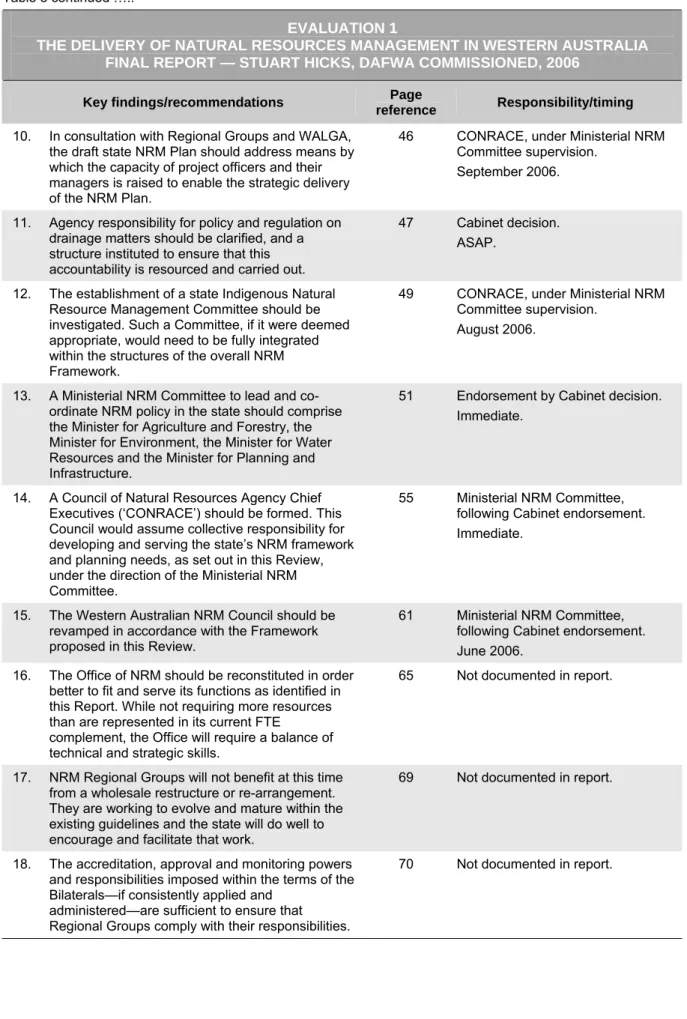
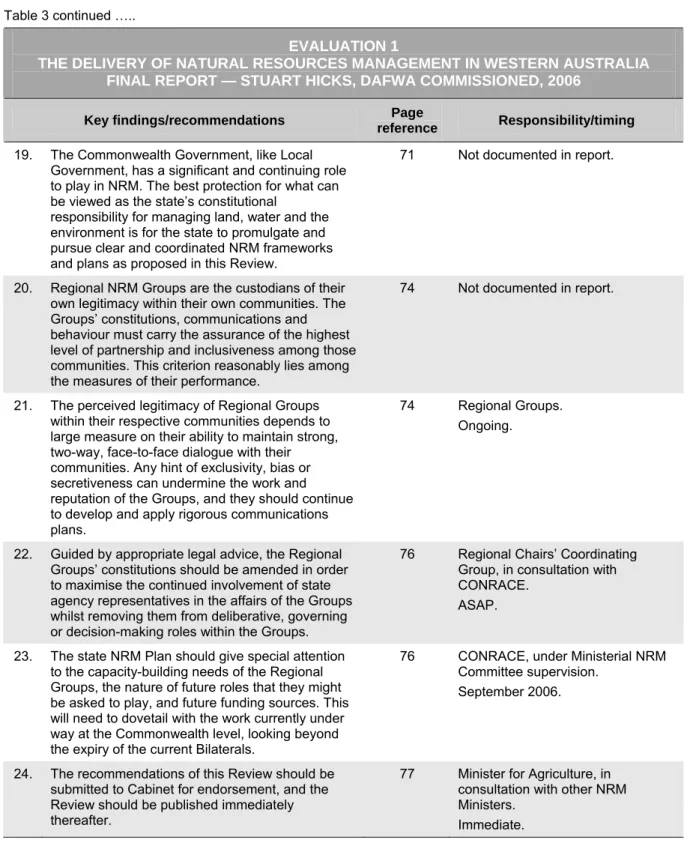
State Evaluation 1
Purpose
Key findings
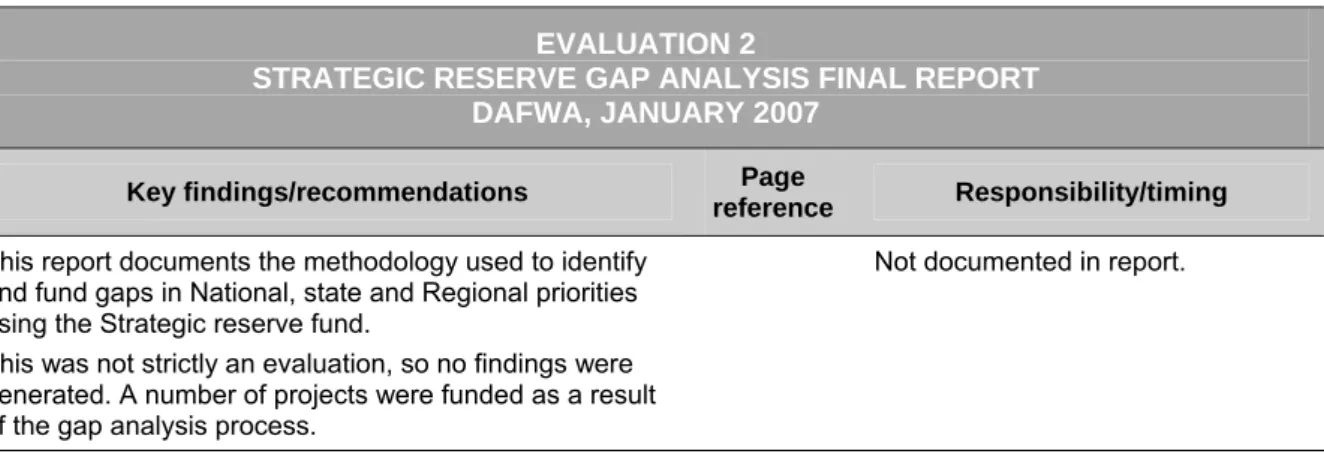
State Evaluation 2
This was extracted from the final report for State Evaluation 2, 'Strategic reserve gap analysis' by DAFWA in 2007. The Joint Steering Committee commented on 23 February 2006 that the proposed Strategic Reserve projects were difficult to prioritize as the methodology for the gap analysis process is not detailed. The Joint Steering Committee requested that the process used to identify natural resource management (NRM) investment gaps between government (State and Australian) NHR policies and regional NHR strategies and investment plans be presented in a formal report .
The purpose of this report was to document the strategic reserve gap analysis process undertaken by the State Fast and Efficient Panel and the Australian Government's Natural Resource Management Facilitators.
State Evaluation 3
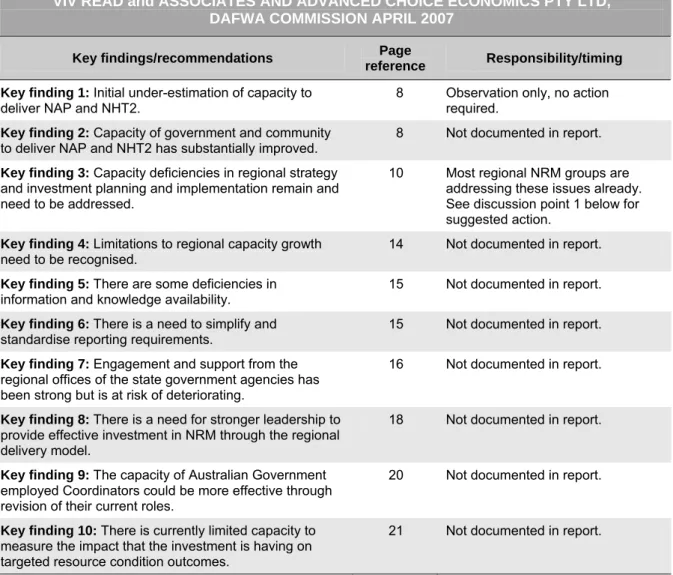
Main finding 2: The capacity of the government and the community to implement NAP and NHT2 has improved significantly. Key finding 3: Capacity gaps in regional strategy and investment planning and implementation persist and need to be addressed. Key finding 7: The involvement and support of the regional offices of the government agencies has been strong, but threatens to deteriorate.
Key Finding 8: Stronger leadership is needed to provide effective investment in NRM through the regional delivery model. Key Finding 10: There is currently limited capacity to measure the impact that investment has on targeted resource condition outcomes.
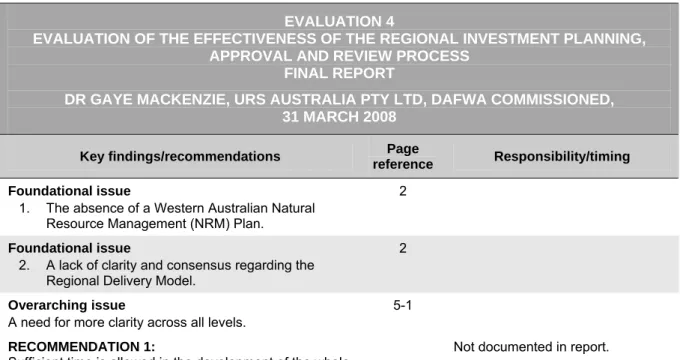
State Evaluation 4
One of the main difficulties in the review process, as reported by the interviewees, was the ten criteria developed to assess the investment plans. Ensure that all elements of the approval review process are subject to an ongoing evaluation process to allow for feedback and adaptation where necessary. An evaluation framework should be designed during the development of the process to ensure that this is incorporated.
Sufficient time is given to ensure adequate assessment of the investment plans in the early stages (i.e. currently F&E and SIC). One of the main assets identified in the IP process was the passionate people involved.
Sub-report 2
RESOURCE CONDITION MONITORING
Author: C Pengelly, R Wheater
This sub-report of the State M&E Implementation Plan Review aimed to identify the strengths and weaknesses of the previous resource condition (?) monitoring and evaluation system. Resource condition monitoring (RCM) of the condition and trend of our natural resources is essential to provide us with information to manage our natural assets for the future. Resource condition monitoring is the joint responsibility of government agencies involved in Natural Resource Management (NRM).
In addition to current spending by government agencies on monitoring the state of resources, these eight projects were funded under NAP and NHT2 to fill gaps in the state's monitoring network. This report provides an update on the progress of the eight RCM projects, what we have learned from this process and a recommendation for the next step in monitoring the state of resources across agencies in WA.
Progress of the RCM projects
The time it takes to understand what is happening in the environment can vary from 5-20 years. Jim Dixon Wind erosion transects have been established and are sampled regularly. Agreements have been made with Chemistry Center WA and CSIRO to analyze soil samples for pH and organic carbon.
Malcolm Robb Sediment investigations began in the Hardy Inlet, Vasse-Wonnerup and the upper Swan Estuary. For the integrity of the inland aquatic habitat, fieldwork has been completed and established monitoring protocols and standard operating procedures have been distributed for internal review.
What we learnt from RCM in WA
Recommendation
Land salinity RCM update as at February 2009
Project outcomes
Objectives
Key investment areas
Additional funding request
The funding was primarily for the purchase of the necessary hardware, but enabled the program to continue with both automatic and manual monitoring until September 2009. This was especially important to provide more winter precipitation data for the surface water catchments.
Investment milestones
The future
Database and data access
Significant native species & ecological communities RCM update as at February 2009 as at February 2009
To achieve as much commonality as possible for biodiversity monitoring across the state between all those who collect data, improve biodiversity monitoring and the collection, storage and availability of data. Although the focus is on significant native species and ecological communities, there will be benefits in improving overall biodiversity monitoring and the collection and storage of data if the broad principles are adopted. The collection of data on SSEC has been a key objective of the Species and Communities Branch within DEC.
Comparison and interpretation of data is hindered by the lack of structured monitoring and standardized protocols for collecting monitoring data. These will build the capacity of all involved to undertake monitoring as well as data collection, storage and management.
Progress to date
Soils RCM update as at February 2009
To establish baseline soil condition in WA's agricultural SW in relation to soil organic carbon, pH, wind erosion and water erosion. Baseline data for all four indicators, using monitoring protocols developed by the National Land and Water Resources Audit (NLWRA), will be recorded in WA's enhanced land database and shared with the national soil data (ASRIS). The project will establish baseline soil condition in WA's agricultural south west in relation to soil organic carbon (SOC), pH, wind erosion and water erosion.
The same approach will be used to establish permanent wind and water erosion transects. Conduct baseline assessments of soil condition in six catchments as identified in the Soil Condition Project RCM Plan.
Assessing estuarine status and response to watershed activities by understanding the vulnerability of estuaries and their response rate to changes in watershed stressors. To develop indicators for measuring estuarine status, focusing on sediments and underwater vegetation that reflect changes in catchment load and estuarine dynamics. Set up programs in estuaries not subject to basic monitoring and develop an understanding of how environmental measures relate to river basin management processes, including indicators and targets suitable for monitoring the effectiveness of earthworks.
Our experience to date in WA estuaries shows that sediments and submerged aquatic vegetation are important measures of estuarine condition and reflect changes in both catchment load and estuarine dynamics. With an understanding of how environmental measures relate to catchment management processes (for example, how water column nutrient concentrations vary according to the percentage of catchment land used for cattle-by-cattle farming), indicators and targets suitable for monitoring the effectiveness of earthworks can be proposed.
Additional funding requested
Determine whether investments on the ground are producing enough changes in the state of natural resources to make a difference. Where applicable, establish remote sensing techniques for assessing vegetation integrity and provide training to regional groups and agencies to conduct baseline and ecosystem process studies and to interpret the developed data. Determine and establish a sample of fixed sites for assessment of quantitative changes in native vegetation and ecosystem processes.
Provide extension and training of regional NRM teams and agencies to conduct baseline and ecosystem process research and to interpret information provided by the three activities above. A set of attributes has been developed that can be tested as signatures for the state of natural vegetation using remote sensing.
February 2009
Progress update
To identify gaps in our understanding of our wetlands at risk as a basis from which to build RCM and integrate river health protocols with the new national river and wetland health assessment framework. Determine whether investments in the field are producing changes in the state of natural resources on a scale sufficient to make a difference. Much of the work has been carried out by DEC (Section of Wetlands) with the objectives of developing a standard monitoring protocol for wetlands in WA and to undertake a rapid assessment of the condition of important wetlands in WA.
All field work has been completed and identification of collected specimens is well advanced. Training sessions will be jointly organized for the project team covering the 'Manual for Wetland Management and Restoration'.
Overall objective
Objectives from schedule
Milestones
Sub-report 3
OUTPUT REPORTING
They count the planted hectares (production) and report them to the state every six months. The State Government captures production data related to these two funding programs from the six Regional NRM Groups on a six-monthly basis. Project providers reported 'current' (completed) production data to the state on a semi-annual basis, separate from the Quarterly Financial Reporting process.
Only a small amount of this data was used by the state for reporting to the treasury. The state is currently considering the future of NRM reporting requirements and this review will inform this process.
State consultation
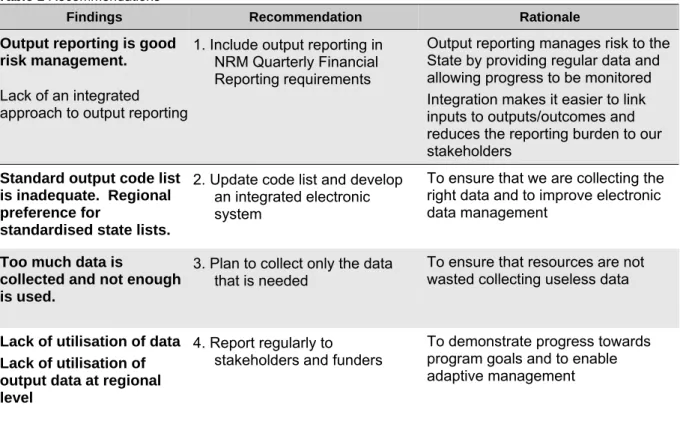
Too much data are collected and not enough are used
Regional consultation
- Include output reporting in NRM Quarterly Financial Reporting requirements
- Update code list and develop an integrated electronic system To ensure that we are collecting the right data and to improve electronic data management
- Plan to collect only the data that is needed
- Report regularly to stakeholders and funders
- Output Codes used for reporting to Treasury 2006-2009 2006-2009
- Draft list of 36 standard output codes for WA
Area (ha) treated for erosion control OG9.1 and OG9.2 Number of people involved in MKR events. 7 RA3.3 None Number of other decision support tools developed 8 RA4.1 None Number of researches and. 13 CB1.1 None Number of awareness raising events such as demonstrations, field days or study visits conducted.
15 CB1.4 None Number of successful published articles in media events that led to articles in newspapers or on radio or television that were created. 17 CB2.1 None Number of training sessions, workshops, seminars or other skills and training opportunities offered.
WA Monitoring and Evaluation
Implementation Plan (NAP and NHT2) Review
Sub-Report 4
STAKEHOLDER SURVEY
The purpose of this sub-report on the review of the national M&E implementation plan was to identify the strengths and weaknesses of the previous monitoring and evaluation system. These findings and recommendations will inform the development of new requirements for the monitoring and evaluation of NRM in WA. A survey of key monitoring and evaluation stakeholders was conducted to obtain feedback on the strengths and weaknesses of the state's M&E implementation plan for NAP and NHT2 in WA.
Its purpose is to provide an idea of the strengths and weaknesses of the state's M&E implementation plan to enable improvements for the future. The plan's strengths and weaknesses, as identified in the customer survey results, are summarized below.
Key strengths
Key weaknesses
State M&E Implementation Plan Summary
A SUMMARY GUIDE to NAP/NHT2 MONITORING and EVALUATION
Survey questions