Some evidence suggests that leakage of medical marijuana from legitimate patients or dispensaries may be common (Salomonsen-Sautel et al., 2012; Thurstone et al., 2011). On the other hand, based on the same datasets, Pacula et al. 2013) find some evidence that certain dimensions of medical marijuana laws, such as home cultivation and legal dispensaries, are clearly associated with marijuana use. From the UCR, medical marijuana laws are associated with an average 15-20% increase in marijuana possession arrests among male adults.
However, based on the large number of dispensaries, it is believed that California has many more patients than other medical marijuana states.
Empirical Model
The legalization effects and law enforcement responses may differ from other medical marijuana states. Furthermore, Figure 2 shows that marijuana arrests (annual averages) increase more slowly in medical marijuana states than in non-medical marijuana states. There are some implications of the above decomposition for identifying the consequences of medical marijuana laws based on marijuana arrests.
In this paper, I adopt a flexible specification to account for unobserved heterogeneity such as law enforcement, and to estimate city- and year-specific arrests as a function of whether the state has an effective medical marijuana law in effect in that year. .
The Results
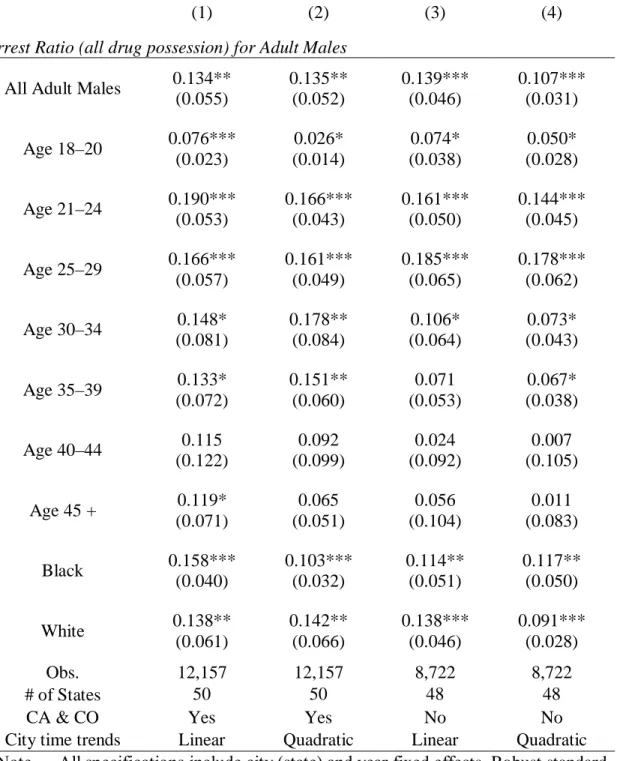
Since the estimates for Lawst in column (4) are essentially zero for all three measures, it suggests that the positive estimated effects on the two arrest ratios under the no-time-trend specification in column (1) are entirely due to California. Similar to Table 2, the estimates are not sensitive to the exclusion of California and Colorado. Estimates are quite similar between blacks and whites, and there is no significant racial difference in estimated effects.
The hierarchical order in the UCR data may also bias the estimates.
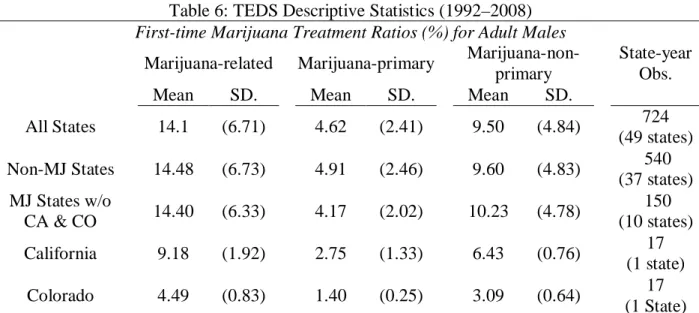
The Analysis of Treatment Episode Data Set 1. The Data
The Results
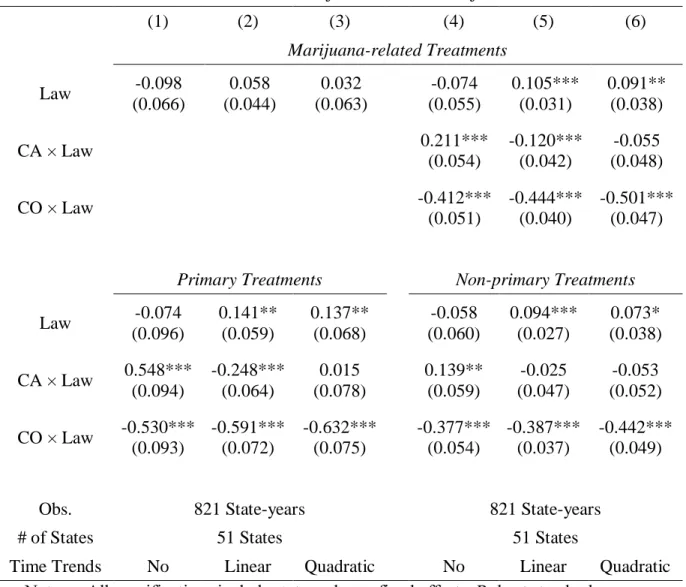
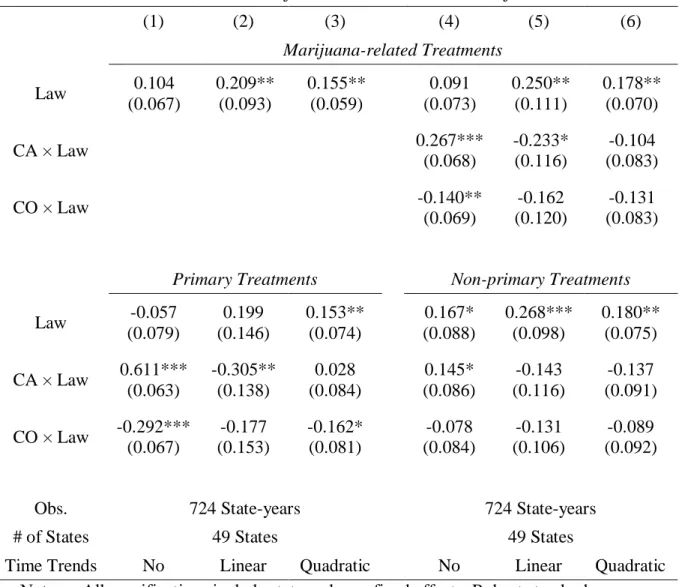
In Table 8, the top panel shows the estimates of the number of first marijuana-related treatments. In the bottom panel of Table 8 I present the estimates of primary and non-primary first treatments. In Table 9, the top panel shows the estimates of the number of marijuana-related treatments [columns (1) and (2)] and the number of first marijuana-related treatments [columns (3) and (4)].
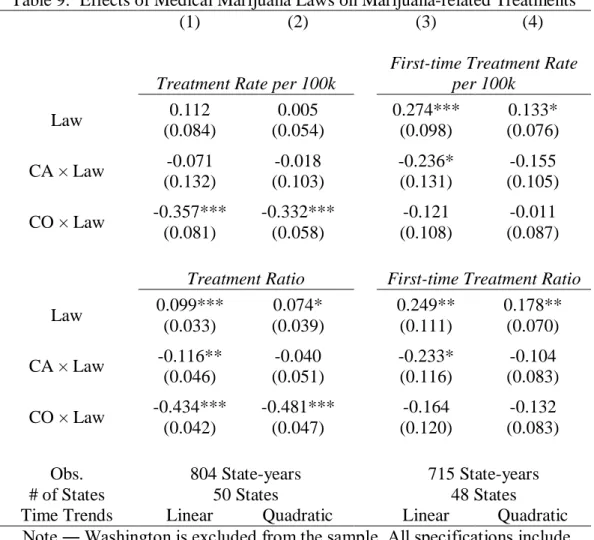
For comparison, the bottom panel shows the estimates for marijuana-related (first-time) treatment conditions without Washington in the sample.
Discussion of Results and Conclusion
Notably, the estimates for Colorado on first-time treatments appear to be more in line with other medical marijuana states. In particular, this article is unable to answer whether these medical marijuana laws increase initiation rates among general populations. In summary, due to the preliminary stage of the literature on medical marijuana laws, this paper alone is far from being able to provide a definitive conclusion; rather, it provides evidence that some indicators of heavy marijuana use do respond to these medical marijuana laws.
Medical marijuana legislation in 50 states: examining the relationship between state legalization of medical marijuana and marijuana use, abuse, and addiction. 34;Sending the Wrong Message": Did Medical Marijuana Legalization in California Change Attitudes toward and Use of Marijuana. Exploring the Impact of Medical Marijuana Legislation on the Validity of Self-Reported Marijuana Use Among Juvenile Arrestees Over Time.
Assessing the effects of medical marijuana laws on marijuana and alcohol use: The devil is in the details. Very Uncertain Times: An Analysis of the Executive Branch's Decision Not to Investigate or Prosecute Individuals Pursuant to State Medical Marijuana Laws. Teen marijuana use from 2002 to 2008: Higher in states with medical marijuana laws, cause still unclear.
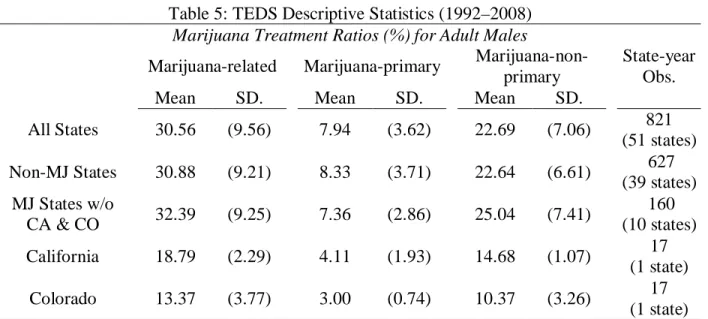
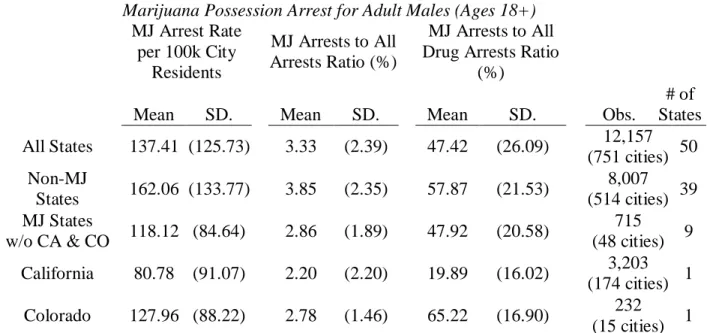
15 cities) 1 Note. ― Medical marijuana states (MJ states) include only states that passed laws before July 2008; states that later passed laws are in non-MJ states. Medical marijuana states (MJ states) include only states that passed laws before July 2008; states that later passed laws are in non-MJ states. For legal documents and details, see "18 Legal Medical Marijuana States and D.C." on the ProCon.org website:.
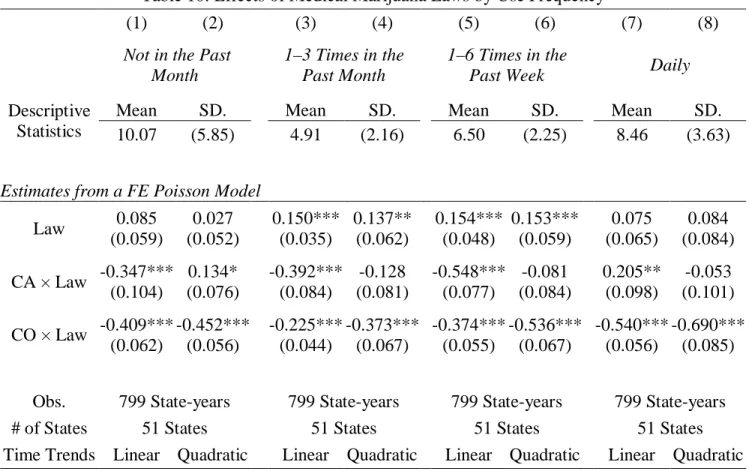
I estimate the effects of medical day laws from a log-linear model or a fixed-effect Poisson model, and I estimate the legalization effects of California and Colorado separately as (5) and (6) in Table 2 .
Inclusion of Control Variables
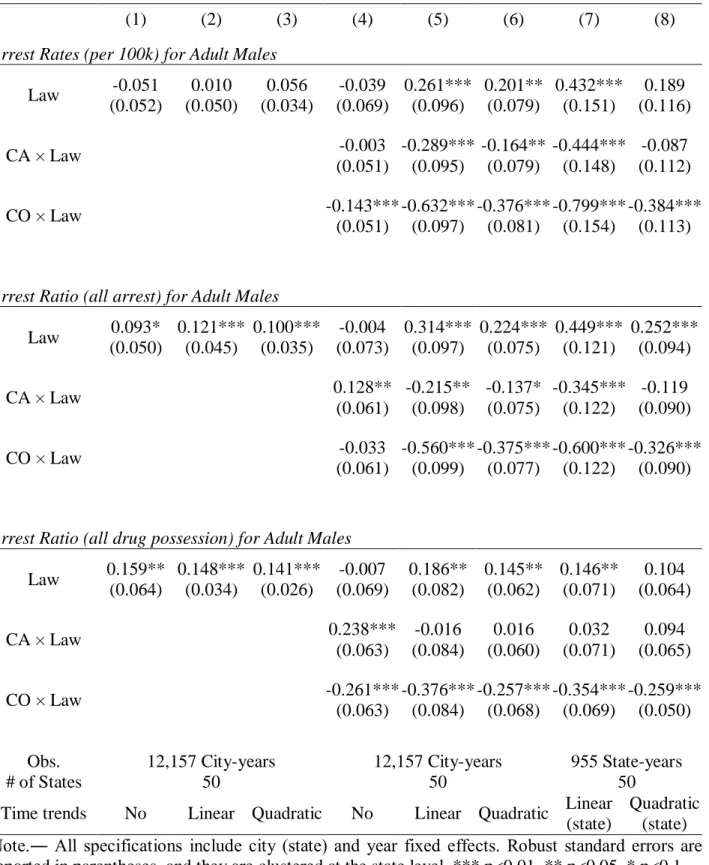
In Appendix B, Table B1, I check the robustness of the main results to different constructions of the sample. The dependent variables are the arrest rate in the top panel, the ratio of marijuana possession arrests to all arrests in the middle panel, and the ratio of marijuana possession arrests to all drug possession arrests in the bottom panel [all dependent variables are in logarithm except for column ( 5) and (6)]. In the last two columns, columns (7) and (8), the dependent variables are state-level arrest rates/ratios for adult males.
Columns (1) - (4) are based on the full sample, and Columns (5) - (8) are based on the restricted sample excluding California and Colorado. The sample size is smaller when government expenditures are included in the model because the 2001 and 2003 government expenditures were not developed by the Census Bureau due to sample redesign. As can be seen from Table B3, the inclusion of these control variables does not affect the Lawst estimates, and they remain similar to those in Table 2.
In Table B3, I examine the reliability of the main results based on alternative coding of the first year of legalization. Columns (1) and (2) are based on all medical marijuana states, and columns (3) and (4) are based on the sample excluding California and Colorado. The results are almost identical to those in Table 2 in the article. 2012), I code the legalization dummy by transition years; and regardless of the month in which the law was passed, the first transition year always has a value of one and not a fraction.
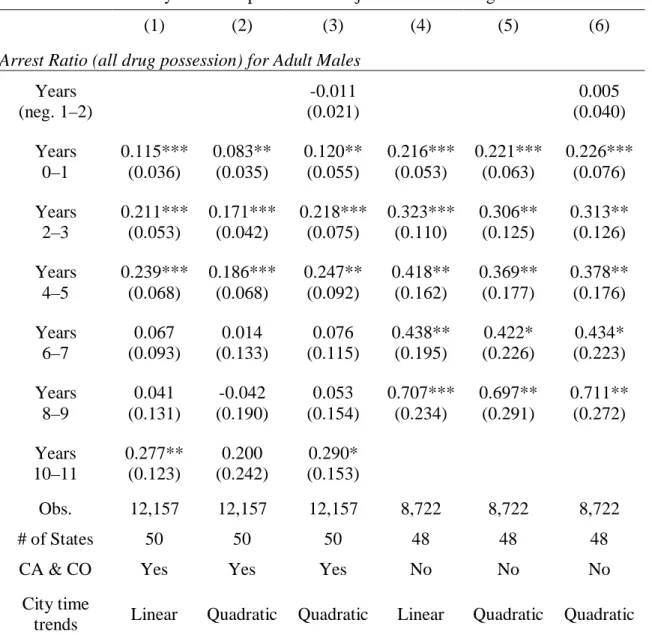
Note that I continue to code Michigan as a non-medical marijuana state so that the estimates in (5) - (8) are comparable to (1) - (4) and those in the paper. We recall that the estimates for copies before the law are close to zero from Table 4 in the paper.
Marijuana arrests and the number of police officers
Trends Linear Quadratic Linear Quadratic Linear Quadratic Linear Quadratic Note. ― Columns (1) and (2) include cities that report at least six months, and the arrest count is scaled by a factor equal to the reported fraction of a year. Columns (7) and (8) include all available city and county agencies reporting positive marijuana possession arrests for adult males. Robust standard errors are reported in parentheses and are clustered at the state level.
Time Trends Linear Quadratic Linear Quadratic Linear Quadratic Linear Quadratic Note.― All specifications include city police officer rates and the following state-level variables as controls: black male rates, unemployment rates, and state 0.08 BAC laws. As a robustness check, I estimate the effects of laws on marijuana treatment admissions among criminal justice referrals. Please note that criminal justice referrals are generally defined as patients referred by anyone connected to the federal, state, or county justice system and may be referred on the basis of a civil or criminal commitment.
All treatments are in the top panel and the first treatments are in the bottom panel. The share of primary marijuana treatment under criminal law references in Table C1 is 17%, which is about twice the share under non-criminal references in the newspaper. The proportion of non-primary marijuana treatment among criminal referrals in Table C1 is similar to that among non-criminal referrals in Table 5 in the article.4 Table C2 presents the regression results.
For first treatment, scores for Lawst are always positive for both primary and non-primary treatments, but are only significant during primary treatment. In summary, the primary treatment results from criminal referrals are similar to the results based on drug arrests and noncriminal referrals in the paper, but the nonprimary treatment results from criminal referrals are different.
Exclusion of Alcohol-Primary Treatments
Excluding alcohol-primary treatments, the estimates for Lawst are slightly larger than those in the paper and indicate an increase in all-time marijuana-primary treatment ratios and an 18.2–. This implies that the negative estimates for Colorado in the paper are largely driven by changes in alcohol treatment. The main reason for including criminal references is to compare with the results in the TEDS of Anderson et al.
Marijuana-related treatments are in the top panel, and marijuana-primary treatments are in the bottom panel. 6 Alaska data for 1998–2003 are in the sample because I can include state years that have missing data in referral sources. Unlike the results for adults in the article, the estimated effects of medical marijuana laws on male minors ages 15 to 17 are quite similar with or without California and Colorado.
In the bottom panel, because Michigan passed a law in November 2008, it is considered a medical marijuana state. 9 Except for eight large states, the number of observations in each year is 900 in the other 42 states and D.C. As in the paper, I estimate a log-linear model, with or without control for state-specific time trends, and the standard errors are clustered at the state level.
In the left panel, the coding of medical marijuana laws is the same as Lawst in the paper; the first year of legalization is coded according to the effective date. In the right panel, the first year of legalization is coded by transition date, as in Harper, Strumpf, and Kaufman (2012). In the bottom two panels, the estimates are uniformly negative for my coding of medical marijuana laws, but none of the estimates are significant and the estimated standard errors are very large.
In addition, these estimates are very sensitive to alternative coding and become negative in the two upper right panels.