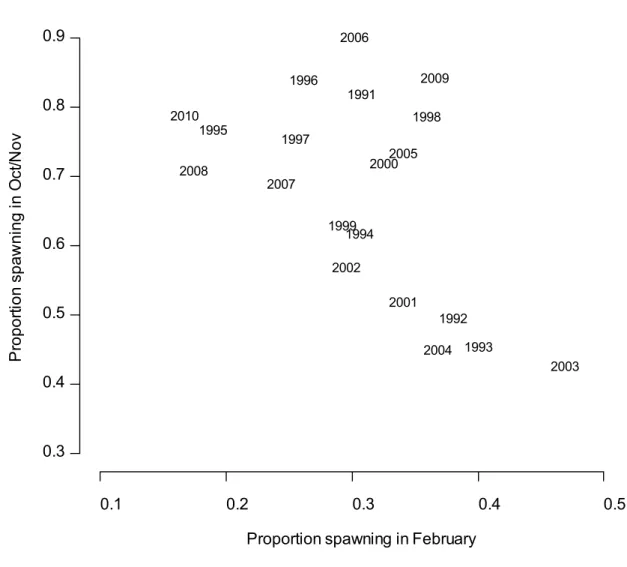
38 Figure 3.6–10 Relationship between the proportions of female lobster spawning at the beginning and end of the spawning season. 93 Figure 4.8–5 Number of days captured per month from the telephone diary survey for the six.
The Fishery
Commercial Fishery
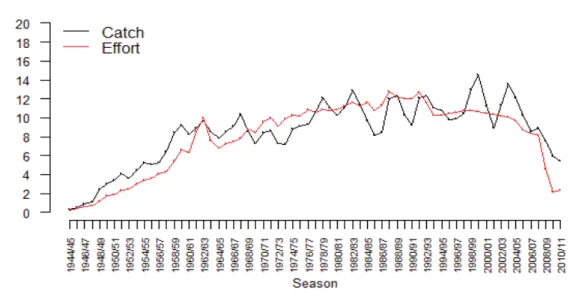
Fisheries Research Report [Western Australia] No. Figure 1.0–2 Annual catch and effort for Panulirus cygnus in the WCRLMF. The pots are left overnight to attract the nocturnal lobsters to the bait in the tanks.
Recreational Fishery
Illegal Catch
Illegal fishing activities
To assess the impact of these activities, fishermen who had fished during this period were interviewed in 1985 or asked to complete a questionnaire anonymously. Time series of recorded catch and effort figures were then adjusted using these estimates and data on prosecutions, under the Fisheries Act, for relevant offenses during this period.
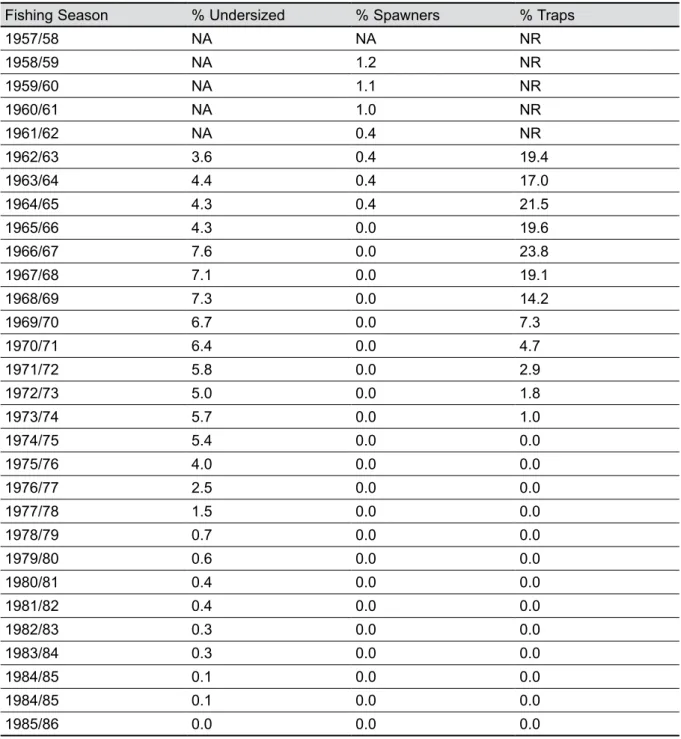
Understating catch
Management
Management Objective
History of Commercial Management Regulations
February 24 - Closure of Grootbank for the rest of the season March 1 - Effort reduction: unit values (number of pots per unit) of. Zone A prohibits fishing in Zone B for the remainder of the season from February 15, 2010; and.
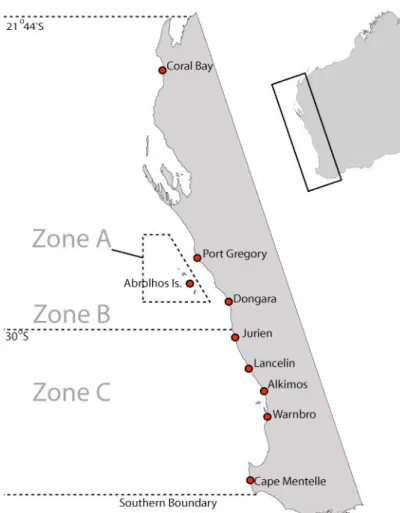
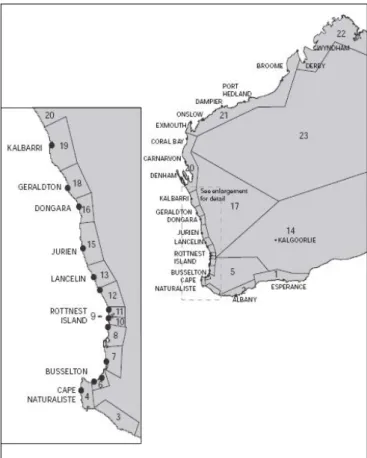
Boundaries and Zoning
Current Management Strategies
Management strategies specific to Recreational Fishing
The recreational fishing season runs from November 15 to June 30 each year, with a shorter season (March 15 to June 30) in the Abrolhos Islands. Recreational anglers abide by the same legislation as commercial anglers regarding the size and condition of lobsters they can take and when, except there is a daily bag limit of 6 lobsters per person. fisherman per day.
Marine Stewardship Council Certification
If three or more people are fishing from the same boat, a daily boat limit of 12 lobsters provides further control over high individual catches. At the same time, a holding limit of 24 lobsters was also introduced in response to the projected low catch years 2011/12 and 2012/13.
Integrated Fisheries Management
Biology
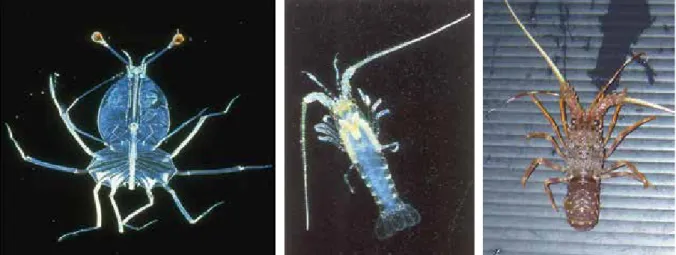
Taxonomy
Stock Structure
However, they require the assessment and management of fisheries in the areas so that this biological variation is taken into account and management adapted accordingly (Section 2). Currently the stock structure is being re-addressed through the use of the most advanced genetic techniques (microsatellite markers).
Habitats
Oceanography
At this stage there is uncertainty as to whether these observed changes in life history parameters are the result of changes in environmental conditions, a response to selective fishing practices or a combination of possibilities (Melville-Smith & de Lestang 2006). Driven by the strong southwesterly winds that characterize the Western Australian summer weather pattern, it causes cool water with high salinity to flow north along the coast.
Physical habitat
Water depth, light and exposure to waves influence the flora and fauna on these limestone reefs and banks. The influence of the Leeuwin Current also creates a range of habitats within the distribution of P.
Life History
These reefs and banks often contain a matrix of crevices and ledges, which are the primary diurnal habitat for P. While the limestone reefs and pavements predominate, there are some coral reefs, particularly at the Houtman Abrolhos Islands, which are important rock lobster habitats.
Movement
Migration
Foraging
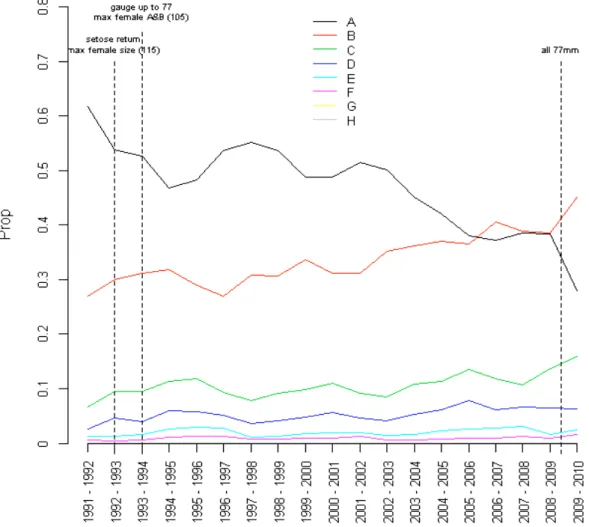
Reproduction
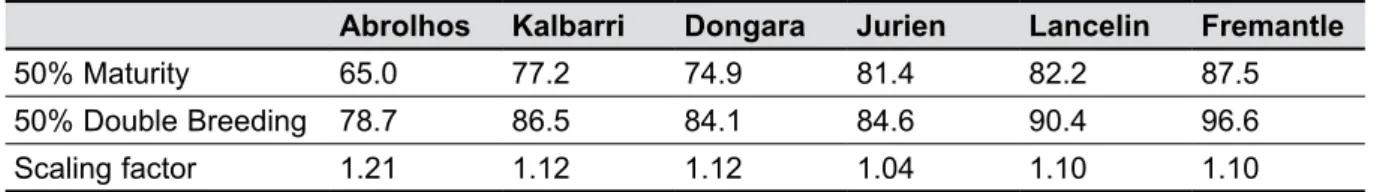
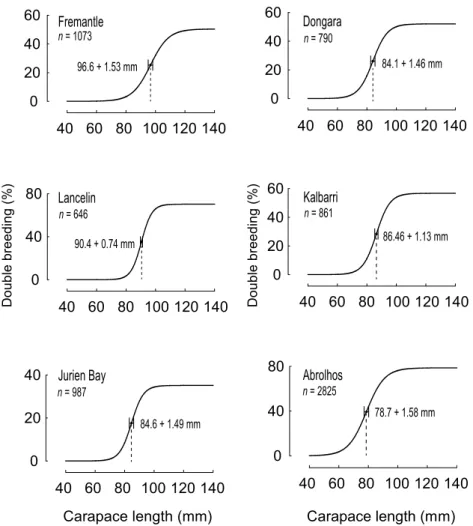
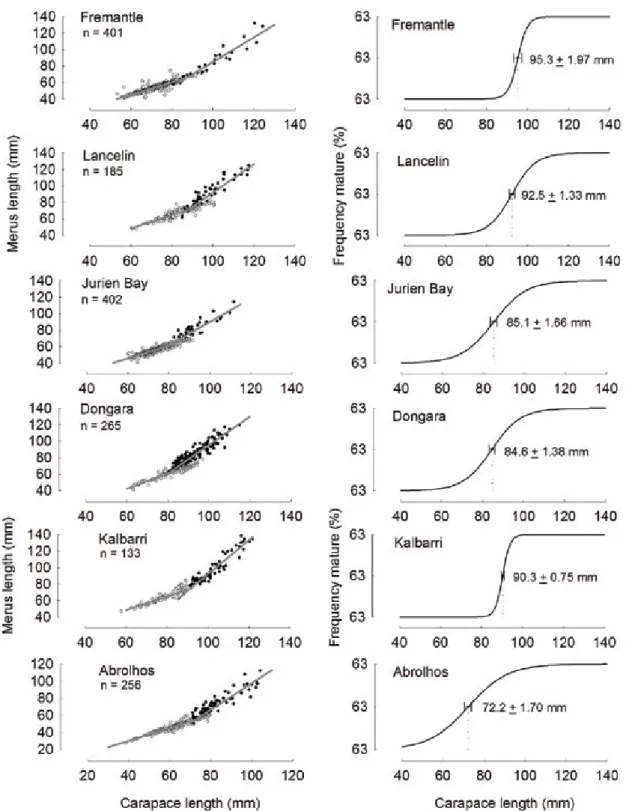
Size at maturity
This time interval also covers the period before and after the introduction of the setosis rule (1993), which has been shown to affect the size of maturity estimates (see above). The IBSS survey, on the other hand, is conducted at the peak of the spawning season, when all mature females are spawning.
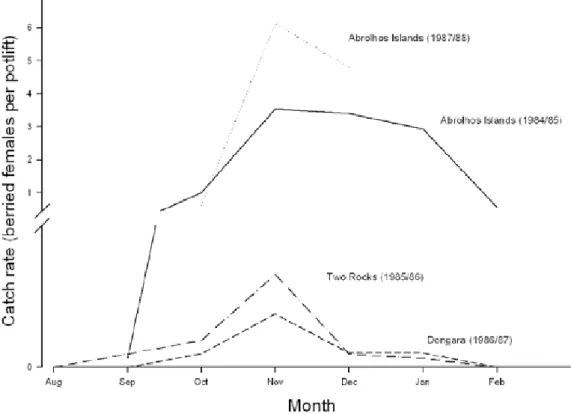
Spawning season
Fecundity
Juvenile Recruitment
Age and Growth
However, above 68 mm CL in the upper 2 length bins (ie, mm), the plots show a small but consistent underrepresentation of the observed data. At this age, many lobsters in the elevated water temperature treatment matured prematurely and their growth rate was dramatically reduced.
Diet
Effects of Climate Change
Fisheries Time–Series Data
Puerulus
Methods
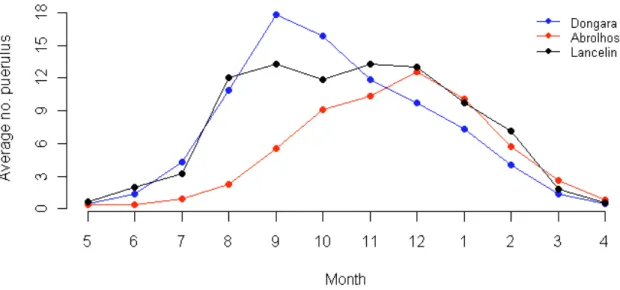
Collectors are sampled every full moon period (five days on either side of a full moon) during the settlement season, which runs from May to the following April. Between each sample, the collectors are removed from the water to the boat, where each of the three plates is removed one by one and placed face down in a shaking rack above the collection tank.
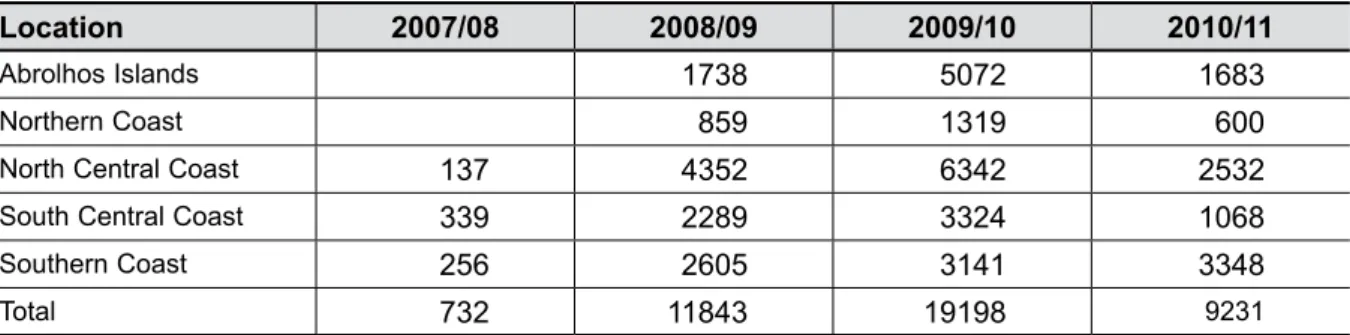
Results
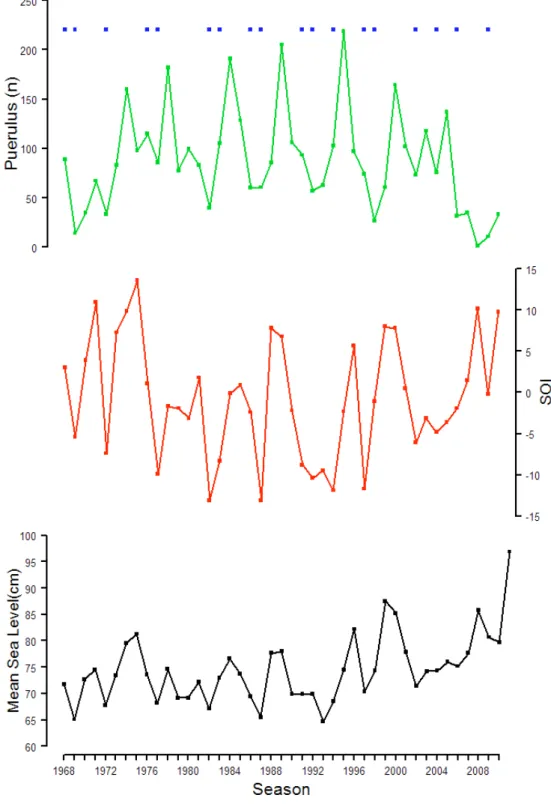
Puerulus establishment indices in each management area (Figure 2.3–1) are based on one or more Puerulus collection sites (Table 4.1–2). Water temperatures prior to the 2010/11 puerulus establishment season (February/April 2010) were again below average.
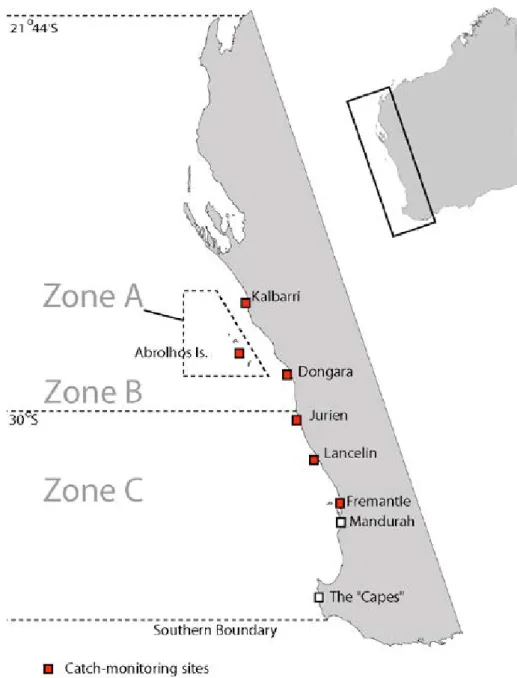
Commercial Catch-monitoring
Methods
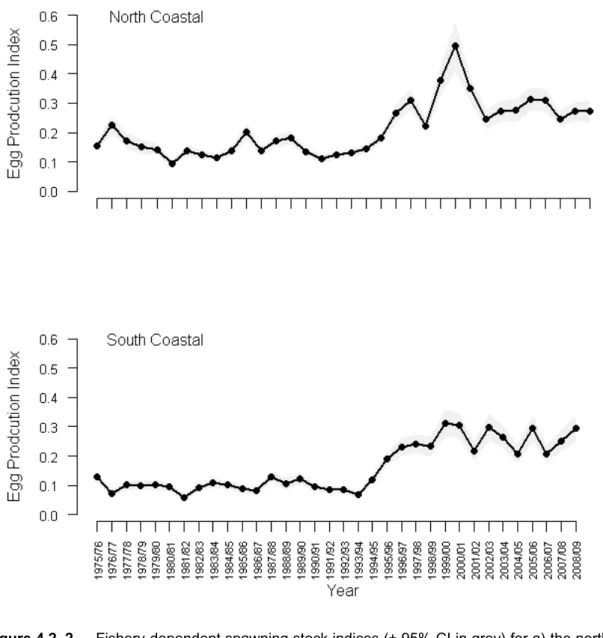
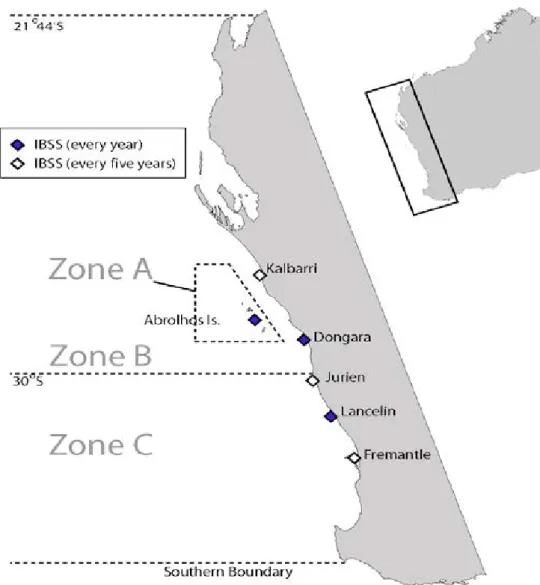
Breeding stock indices are prepared for each of the two coastal regions: the north coast index of monitoring in Dongara and Jurien, and the south coast index of monitoring in Lancelin and Fremantle. Each index is a least squares mean (SAS, 1987) of eggs per potlift in the region's deepwater breeding grounds during the spawning season (September–February).
Results
These indices will therefore not be updated until a time series of catch rates has been developed under quota management. These indices will therefore not be updated until a time series of catch rates has been developed under quota management.
Independent Breeding Stock Survey (IBSS)
Methods
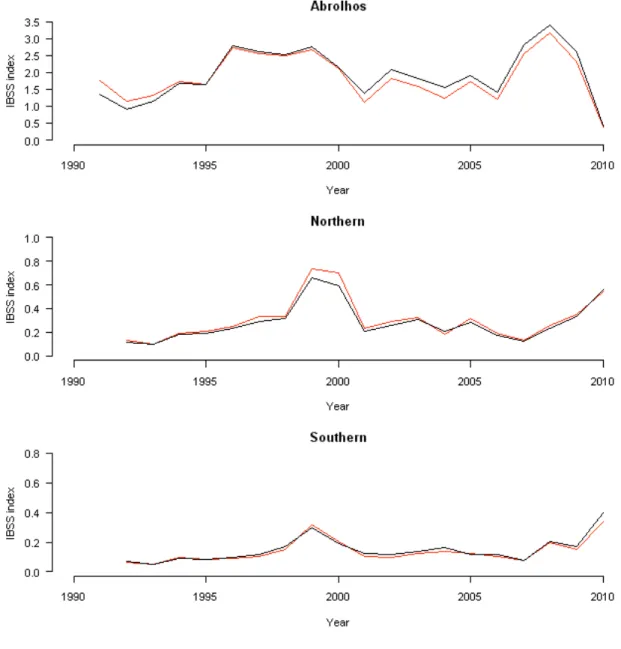
Back-transformation of the resulting least squares means (SAS, 1987) for the factor year provides standardized annual indices of brood stock. In constructing fisheries-dependent breeding stock indices (section 4.2) and biological model breeding stock indices (section 5.5), females are assigned a probability of being mature (as opposed to deterministically knowing it) based on site-specific size at maturity. (SAM) trends (Section 3.6.1), which may also change annually due to environmental factors.
Results
However, in the Abrolhos Islands, the 2010 survey produced the lowest breeding stock level on record. The fishery-independent index provides a cross-check for the long-term fishery-dependent breeding stock index and the model-derived breeding stock index.
Volunteer Research Log books
Methods
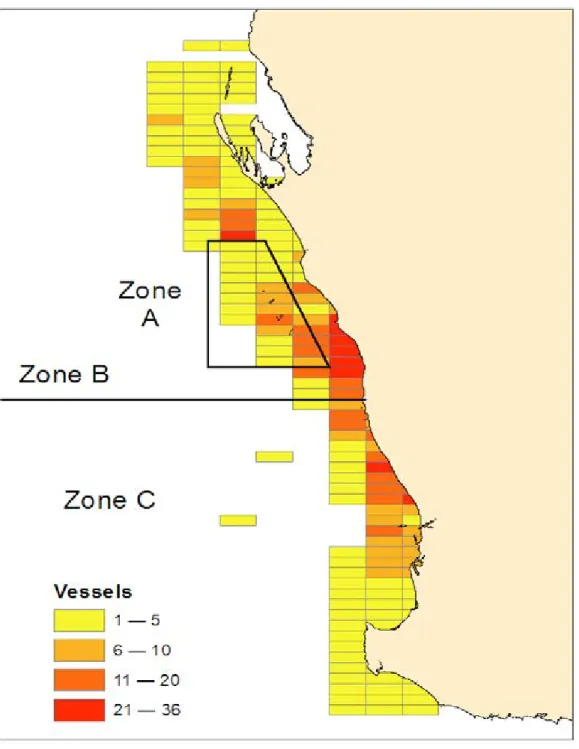
Results
The color of each block represents the number of vessels that have returned logs for that block.
Catch and Effort Statistics (CAES)
Methods
For seasons up to and including 2009/10, monthly returns were received from fishermen with a deadline of 15 days after the end of the month. At the end of each season, a gear survey is sent to all fishermen requesting details of the type of gear used, boat modifications and technology installed.
Processor Returns
Methods
Once a year, fishermen are sent a written reminder that a license is required to ensure yield. Another monthly summary is sent to Department of Fisheries District Offices and processors detailing that month's catch for three areas: Fremantle (Capes to Wedge Island), Jurien (Green Island to Green Head) and Geraldton (Leeman to Shark Bay) .
Results
This is compared to the catch at the same time last year and also the 10-year cumulative average to give an indication of how the season is progressing. Predictions of catches of A- and B-grade lobster using a standardized coast-wide puerulus settlement index (least square mean of Dongara, Jurien, Lancelin and Alkimos) lagged 3 and 4 years, adjusted for water temperature and management factors.
Environmental Data
The Reynolds satellite temperatures, obtained monthly from the CSIRO, provide sea surface temperatures since January 1982. These were obtained from BOM at (http://www.bom.gov.au/climate/current/soi2.shtml) and provide a monthly value of the SOI, with archive values available from 1876.
Recreational Fishery Surveys
Methods
Initially, 400 to 450 people were randomly called from the permit holder database; in the 2006/07 season, however, it increased to 800 participants. The boat ramp survey will be used to validate catch rate estimates from the Hillarys and Ocean Reef Area telephone diary survey.
Results
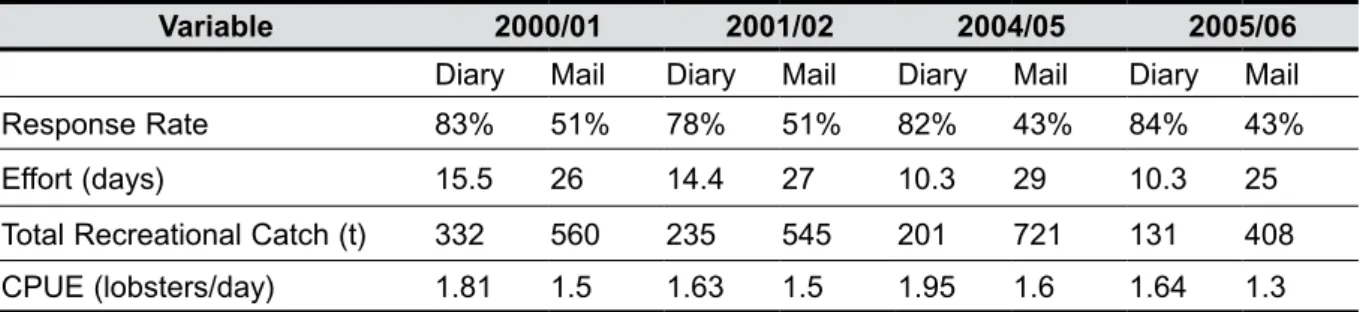
As postal and telephone diary surveys produced very different catch estimates, a conversion factor was developed to adjust the results of the postal survey to those of the more accurate telephone diary survey, using only the four seasons in which telephone diary surveys were made. When the conversion factor is applied to catch rates since the beginning of the postal survey (1986), it shows a much reduced recreational catch (Figure 4.8–3).
Meshed Pot Surveys
Methods
Recently, due to a nominal TTV for the commercial sector, the recreational ratio of the catch has increased in both northern and southern zones, with further increases predicted due to the limitation of commercial catch in future seasons. However, this is predicted to decline as the two weak recruitment seasons (Figure 4.1–4) begin to enter the fishery.
Results
For the 2010/11 season, analyzes were conducted on the previous years' data on catch rates and size distribution, using a standardized mesh wire pot provided to all fishers in the study. This does not appear to be the case with very low catch rates of small lobster in water depths greater than 20 fathoms (Figure 4.9-3).
Stock Assessment
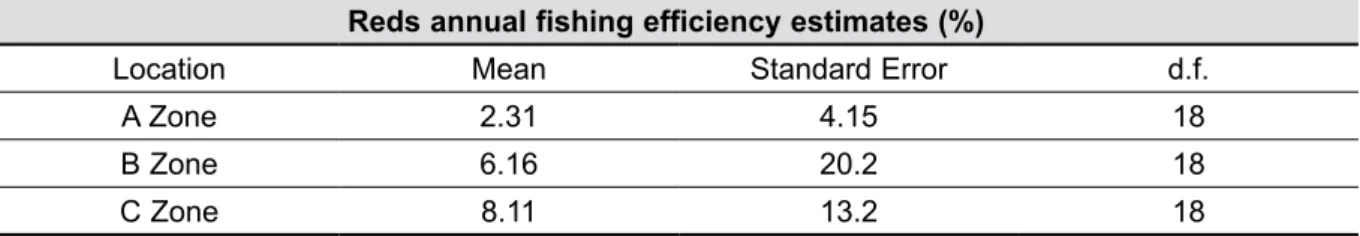
Fishing Efficiency
Methods
The changes in catchability between successive years are considered representative of the change in fishing efficiency between those years (see section 5.4 for more information). The initial difference in fishing efficiency at the beginning of the time series ( ) was determined (cf. 5.1.1).
Results
Standardized volunteer logbook catch rates recorded for the end of the trapping season (April–June) were compared with the following IBSS catch rates recorded four months later in that year (October/November). Any increases or decreases in this difference in subsequent years were considered to represent further changes in the efficiency of the commercial fleet in this area.
Catch Prediction
Methods
The recreational catch has increased significantly since lobster-specific licenses were first introduced in the 1986/87 fishing season. Recreational catch forecasting uses several fisheries datasets: recreational fishing license numbers, estimation of participation rates and catch and effort (Section 4.8), estimation of commercial catch (Section 4.5), and index of recruitment (Section found that a multiple regression of puerulus settlement at the Alkimos collector (Figure 4.1–1) for three and four years before and seasonal license use best explained the recreational catch for that season, as most of the recreational catch is caught in the Metropolitan Coast.
Results
This increase, and corresponding increases in the recreational share of the total catch (Figure 4.8-7), is of particular interest in relation to the new management initiative of Integrated Fisheries Management (Section 2.6). However, Melville-Smith et al. 2004) modeled future recreational efforts to improve the prediction of recreational catch.
Stock-Recruitment–Environment Relationship
Methods
For the recruitment–spawn stock relationship (RSR), nominal fishing effort (pot lifters) was obtained from CAES (Section 4.5) and standardized for increased efficiency (Section 5.1).
Results
Discussion
Due to the low establishment of puerulus over three years (2006/07 to 2008/09), including the record low establishment in 2008/09, two FRDC projects are underway to examine the possible causes (ie environmental conditions and breeding) of the low establishment (see section 7.1.2).
Depletion Analysis
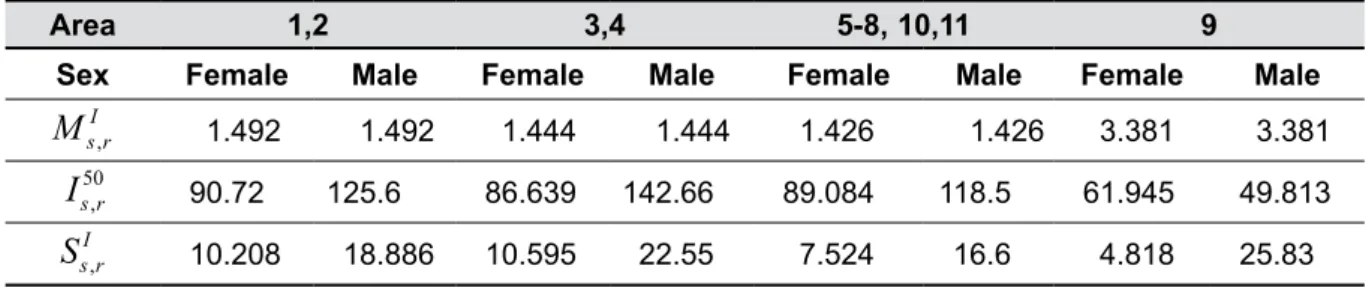
Biological Modelling
This proportion of "whites" that move is estimated in the model from tagging data. Λr,y,r,Ls is the proportion of animals of sex s in length class L in region r in time step t of year y that are 'white'.
Biological Reference Points and Stock Status
Management Decision Framework
- Taking Account of Uncertainty
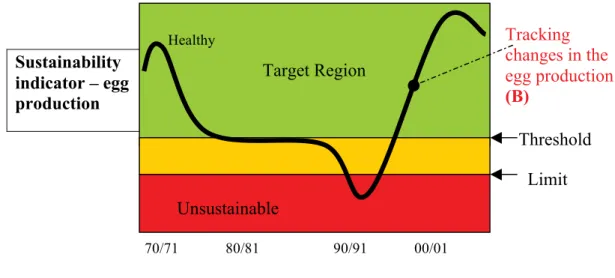
- Indicators, Reference Values and Performance
- Management Objectives
- Indicators
- Reference Values
- Decision Rules Framework
The purpose of this sustainability objective is to ensure that egg production (breeding stock) is at a safe level, i.e. therefore the model breeding stock estimate has been chosen to produce the egg production index for the fishery .
Stock Status
Stock Status by Zone (2010/11 fishing season)
It is projected to remain relatively stable at current catch rates over the next five fishing seasons (Section 5.5). It is projected to remain relatively stable at current levels of fishing effort over the next five fishing seasons (Section 5.5).
Current Issues and Research
Identifying factors affecting low puerulus settlement in recent years
- Background
- Project Objectives and Preliminary Findings
- Finding from additional projects
- Conclusions
Evaluation of the use of new statistical techniques for determining harvest rates and increasing efficiency in the western reef lobster fishery. Assess whether estimates of harvest rate and fishing efficiency are reliable and can be used to help manage the western lobster fishery.
Lobster Movement through Acoustic Tracking
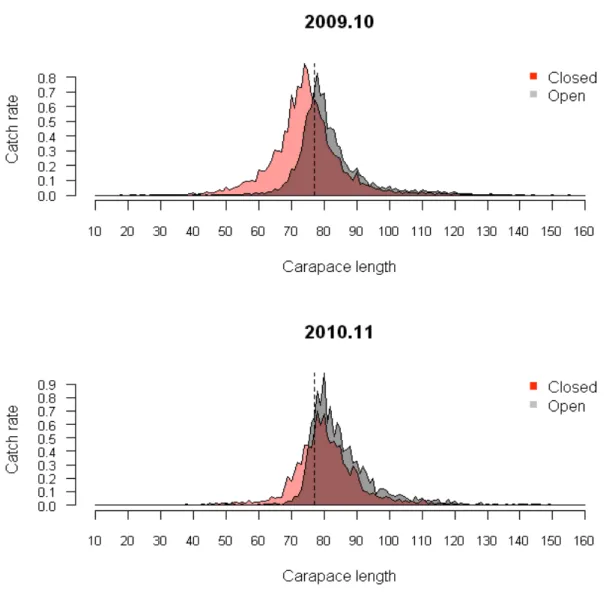
Effects of Closed Areas
Suggestions for Future Research
Bio-economic Modelling
Background
Evaluation of market-based within-year management strategies to assess the within-year economic performance of different management strategies of the white (December) and red (March–April) pike perch fishery.
Integrated Fisheries Management
Evaluating source-sink relationships for the western rock lobster fishery using oceanographic modeling (FRDC Project 2008/087). A semi-quantitative collector of the puerulus larvae of the western rock lobster Panulirus longipes cygnus (George) (Decapoda, Palinuridae).
Appendices
Appendix J – Parameter input of proportion of white lobsters in each length class in each region and time step for the stock assessment model. Appendix M – Parameter input of the proportion of setose females in each region and time step for the population assessment model.