Copyright in this document or any part of this document remains with Talis Consultants Pty Ltd and may not be used, transmitted or reproduced in any way or form without the prior written consent of Talis Consultants Pty Ltd.
Background
Scope of the Report
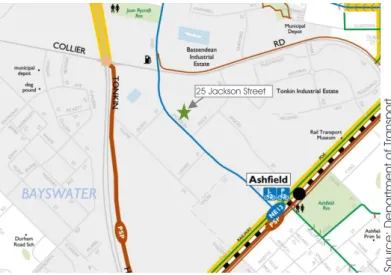
The site is located at 25 Jackson Street, Bassendean in the Bassendean Industrial Area within the administrative boundary of the town of Bassendean, approximately 10km from the center of Perth. The site is bounded by Jackson Street on its south-west side with a separate access road to the site from Alice Street to the south-east of the site.
Surrounding Land Uses
Surrounding Road Network
Crash Blackspots
Speed on the Surrounding Road Network
Site Access
Staff Access
Pedestrian and Cyclist Access and Networks
TW15042 - Traffic and transport assessment.1b December 2016 | Page 3. Plate 2-1), which links with cycle routes to the east (towards Bassendean), north (towards Morley), west (towards Embleton) and south (towards Ashfield).
Public Transport Access
On-site Parking
Loading and Unloading Areas
Environmental Noise
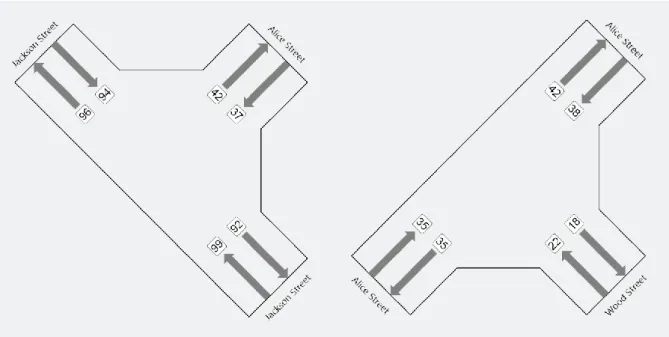
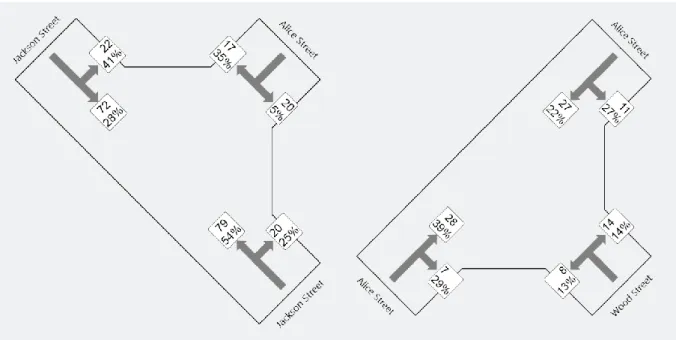
TW15042 - Traffic and Transport Review.1b December 2016 | Page 5 parking bays along the northwest edge of the Site. As part of this analysis, two intersections were analyzed including Jackson Street and Alice Street, as well as Alice Street and Wood Street, as shown in Diagram 3-1. As previously mentioned, Jackson Street is classified as a local distributor road and Alice Street and Wood Street are access roads, both of which have a 50 km/h speed limit.
These three roads surround the Site and are likely to experience the most direct impact of any increase in traffic volume resulting from the operation of the Facility. As a result, in order to analyze the current traffic movement, Talis performed a manual traffic count on these intersections. The traffic count was carried out between on a weekday to get an average representation of peak traffic volumes.
The results of the manual traffic count are shown below in Diagram 3-1, where the number of vehicles passing and percentage of heavy vehicles are displayed. The manual traffic count provided a breakdown of heavy vehicle traffic and overall volumes to be determined for the hour in question. From these volumes, the traffic flow to the two primary Facility entrances can be calculated and used to determine the traffic impact.
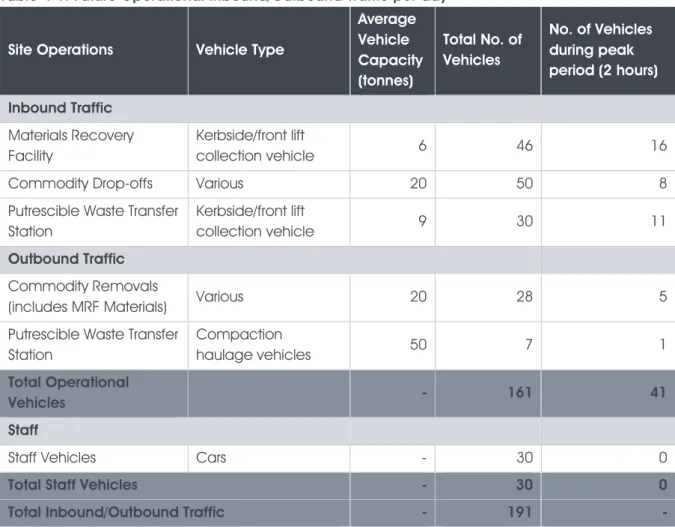
At the time of the traffic count, none of the traffic movements involved vehicles entering and leaving the site, as the facility is currently operating with limited traffic movements. Talis modeled the vehicle movements based on the amount of waste and material expected to be accepted at the Site per year, along with the type of vehicles expected to carry loads. As shown in Table 4-1, the traffic data modeling indicates that there would be an estimated 161 vehicle movements or trucks unloading and collecting waste and materials to and from the Site during normal operating hours along with 30 personnel vehicles.
This is a conservative "worst case" approach to expected vehicle movements and volumes are not anticipated to exceed these volumes. Freight and express vehicle movements are not expected to experience "peak periods" and are designed to arrive and depart continuously during the 12.5 hour workday. Operating staff will be required to be present at the site prior to the arrival of waste vehicles and after the end of the day, so it was assumed that staff vehicle traffic did not affect site operation vehicles and was analyzed separately.
Assumptions
This equates to 41 vehicles during the two hour period or 20-21 vehicles during the one hour peak period.
SIDRA Analysis
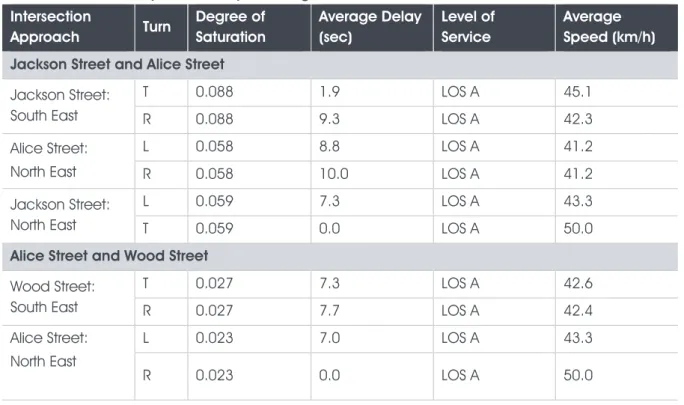
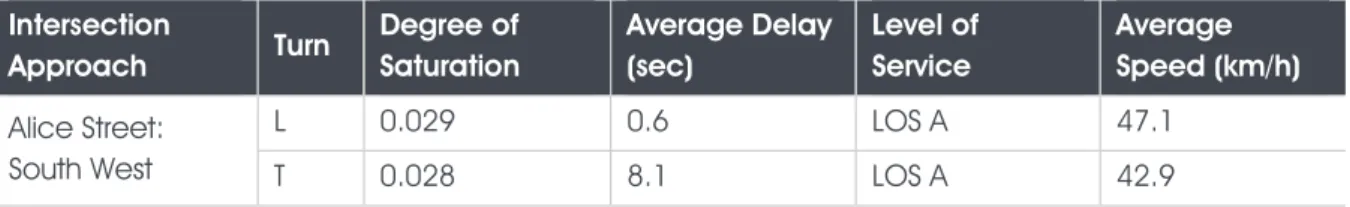
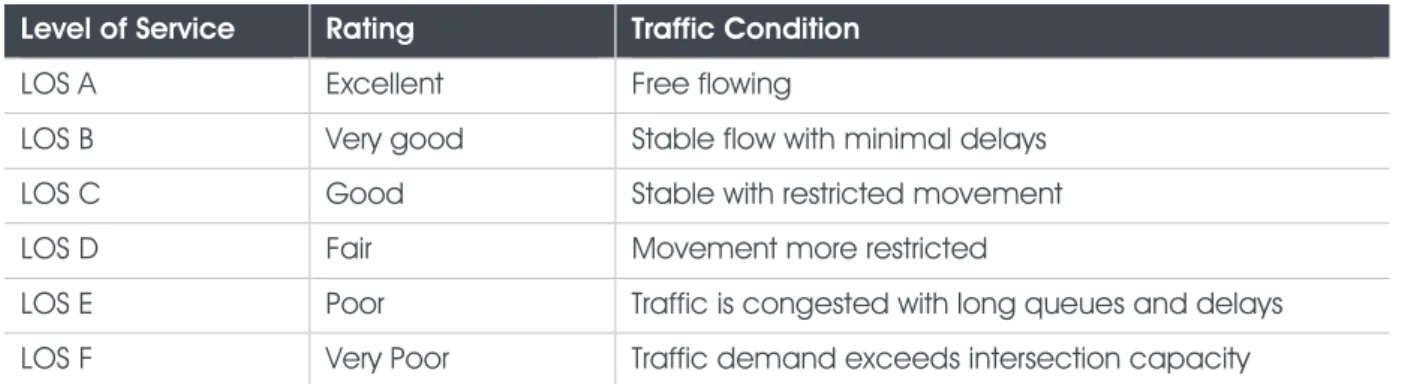
Saturation rate: the ratio of demand to capacity on the approach to the intersection; One of the main outputs of the SIDRA analysis is the Level of Service for each intersection approach. Level of Service (LOS) is a quality measure used to describe the operating conditions of a road.
By performing an analysis of current conditions and forecast traffic, Level of Service provides a comparison tool to easily identify the overall impact on the intersection. Actual traffic volumes, as discussed in Section 3, were modeled in SIDRA to allow a comparison to be made with predicted conditions. The analysis results are shown below in Table 4-3 including left (L), right (R) and through (T) traffic movements.
As shown in Table 4-3, the current traffic movements of both intersections are categorized as LOS A (excellent) in all directions. Traffic is free and there are no major traffic jams in any direction.
Impact on Scenario 1 and 2
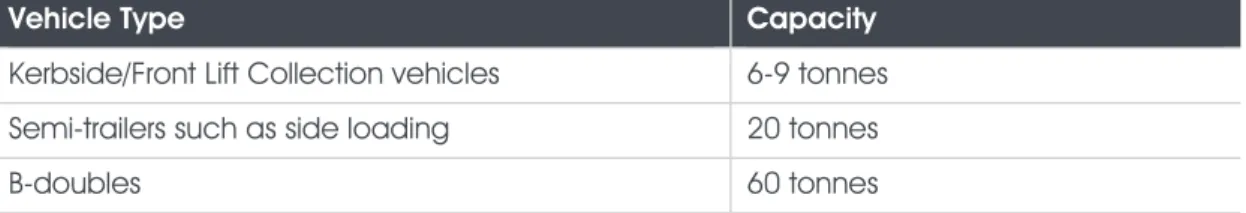
The Alice Street entrance also has enough space for one B-double, the longest vehicle accessing the Site, to queue on the access road.
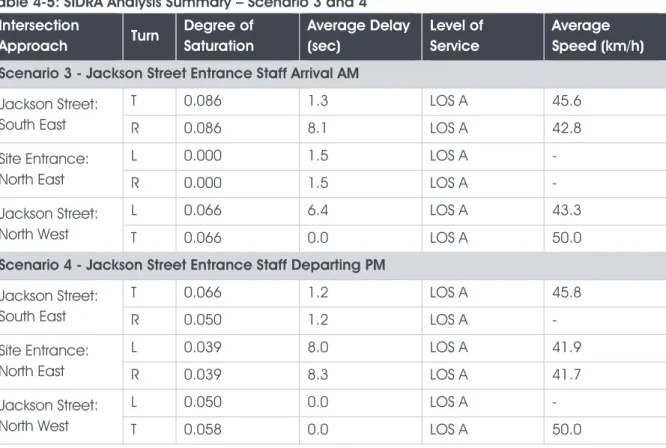
Impact on Scenario 3 and 4
Committed Developments
Lot 10 – Railway Parade, Bayswater
The traffic generated as a result of this development is expected to affect the volume of traffic around the site. However, all vehicles accessing the site during operation will access and exit the site using Jackson Street and Collier Road or Alice Street and Collier Road for the Tonkin Highway and are not expected to use Railway Parade or the new Wick Street junction /Jackson Street.
On-site Vehicle Movements
Turning Path Movements
Traffic Safety on-site
The current traffic volumes on the road network around the Site will experience minimal impact due to the predicted traffic movements during the Facility's peak times. The development of the proposed Facility is estimated to generate 161 heavy vehicle and 30 personnel vehicle two-way movements (in and out of the Site) each day under the 'worst case'. Up to 70% of the total heavy vehicle traffic is expected during the morning and afternoon peak periods between and for material recycling facility and waste transfer station drop-offs.
This would result in up to 41 vehicle movements per hour with these vehicles using Jackson Street and Alice Street to access the site and Collier Road. Turnpike movements performed show that the site has sufficient capacity for all vehicle types modeled to maneuver between the various loading and unloading points and still enter and exit the site without major obstruction. SIDRA analysis of the two entrances to the site determined that these intersections have sufficient operational capacity for the facility's vehicle movements.
Modeling indicates that the only delays created due to additional traffic associated with the site would be experienced by those vehicles entering and exiting the site with maximum average delays expected to be up to 21.9 seconds. Both entrances have enough space for a B-double, the longest vehicle entering the yard, to queue up on the entrance road. Modeling shows that surrounding businesses and other road users will not have any significant impact.
The development of Lot 10 Railway Parade, Bayswater was considered as part of this assessment. Traffic produced as a result of the development of Lot 10 Railway Parade is expected to interact with traffic volumes around the Site. Based on the modelling, available information and the assumptions made, the Facility will have a limited impact on the surrounding area and should not create a significant disturbance to surrounding business or other road users in the area.
Available at: http://www.bassendean.wa.gov.au/3_your_council/agendas_minutes/council agn.htm. This document and information are for the use of the authorized recipient only and this document may not be used, transferred or reproduced in whole or in part for any purpose other than that provided by Talis without written consent. TW15042 - Traffic and Transport Assessment.1b December 2016 | Page 19 SIDRA Analysis - Existing traffic flow for the intersection of Jackson Street and Alice Street.