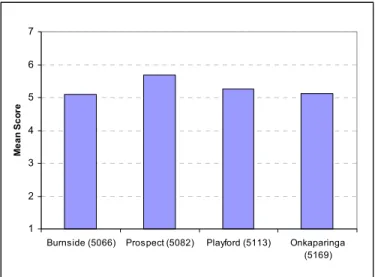
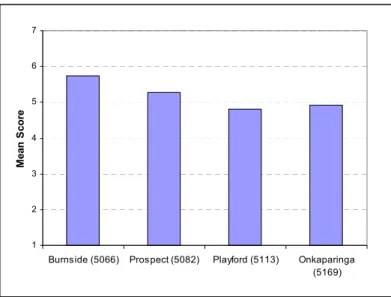
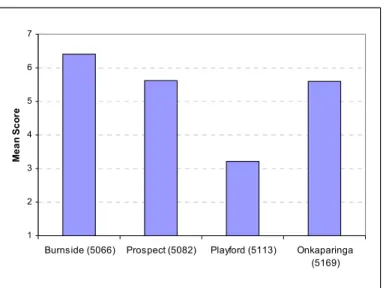
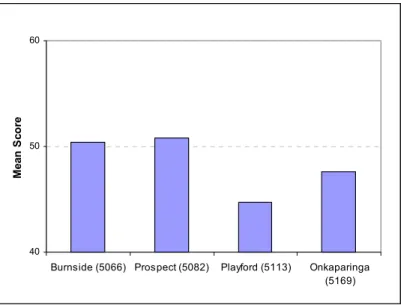
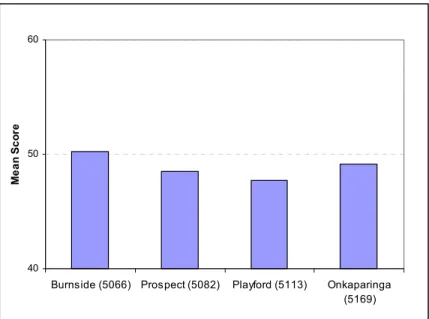
On both the physical and mental health components of the SF12 health measure, Playford residents scored the lowest (i.e. the least healthy) and Burnside the highest, followed by Prospect and Onkaparinga. The distribution of health across the four suburbs reflected the well-established picture that the physical and mental health of respondents in the more affluent suburbs – Burnside and Prospect – was better than that of the two less affluent areas – Onkaparinga and Playford.
Introduction
Understanding Local Differences in Health
- Compositional Explanations
- Contextual Explanations
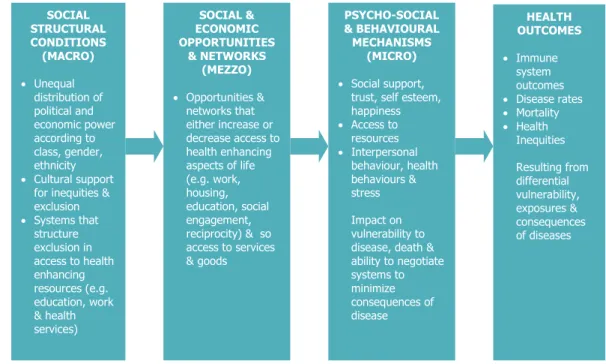
Contextual explanations focus on the characteristics of the areas themselves, which can affect the health status of the residents. This includes physical and environmental characteristics such as air and water pollution, housing density and amount of open space (Macintyre et al. 1993), as well as levels of social capital and socio-cultural characteristics of an area such as reputation or sense of community.
Social Capital and Health
- The Links between Social Capital and Health
- Differential Access to Social Capital and Locational Disadvantage
Studies have identified area-level differences in terms of both social capital that strengthens local services and facilities (such as meeting places, voluntary groups, shops and recreational facilities) and also in terms of socio-cultural aspects (such as area reputation, levels of trust, crime and sense of identity ). There is evidence to suggest that disadvantaged areas have different forms of social capital that are likely to bring fewer benefits to society.
Research Project Objectives
Access to social capital has been found to vary depending on a number of individual variables, including age, race/ethnicity, employment, income, socioeconomic status, family structure, and home ownership. It may be that while some elements of interaction in disadvantaged areas are strengthened in the face of poverty and deprivation, the resources available through these interactions are less valuable to health. Social capital promoting features of areas as measured by: a) availability and use of local services and facilities that promote community interaction (including community centers and transport, shopping and recreational facilities); b) features of the local socio-cultural environment (including trust and civic and social involvement).
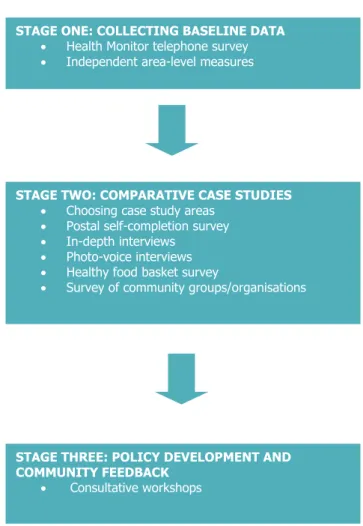
How We Conducted This Study
Stage One: Collecting Baseline Data
- Health Monitor Telephone Survey
- Independent Area-level Measures
A Health Monitor telephone survey was conducted in July 2003 by the SA Department of Human Services. These independent measures are mainly derived from the official statistics of various government departments and also from the 2001 census (see Appendix 5).
Stage Two: Comparative Case Studies
- Choosing Case Study Areas
- Postal Self-completion Survey
- In-depth Interviews
- Photo-voice Interviews
- Healthy Food Basket Survey
- Survey of Community Groups/Organisations
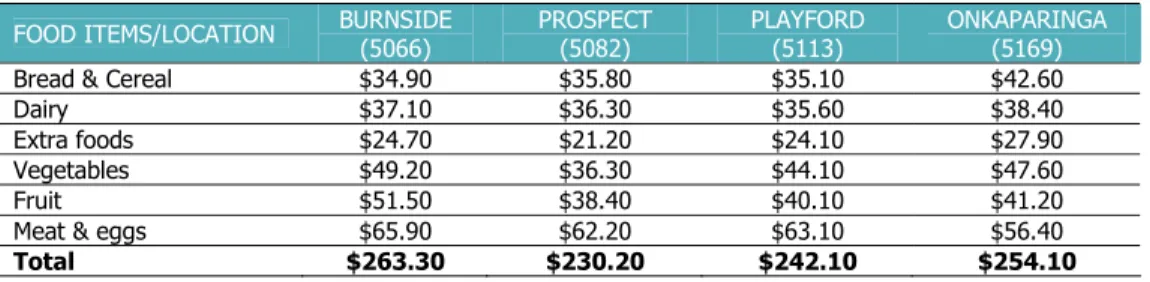
A food basket survey was conducted in September 2005 to investigate the availability and affordability of food for respondents in the four case study areas, as one of the contextual characteristics of the areas that may have implications for health. The questionnaire covered questions about the structure, function and operation of the community group/organisation, its membership and activity, health-related activities, resources and liaison with other groups/organisations.
Stage Three: Policy Development and Community Feedback
In October/November 2005, a self-completion questionnaire was sent to 117 community groups/organisations across the four case study areas. The survey aimed to examine the availability and function of community groups/organizations in case study areas, another contextual characteristic that may be relevant to health outcomes within areas.
Community Profile
- Socio-Demographic Profile
- Burnside
- Prospect
- Playford
- Onkaparinga
- Social and Physical Environment at the LGA Level
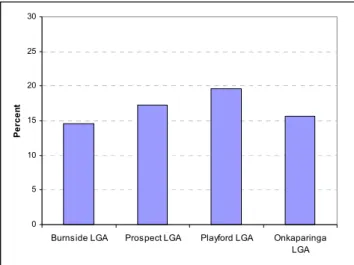
- Housing Stress
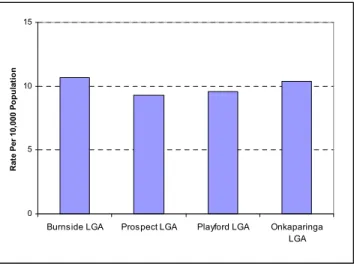
- Crime Rates
- Public Transport
- Private Health Insurance
- Sporting and Social Club Facilities
- Independent Measures at the Postcode Level
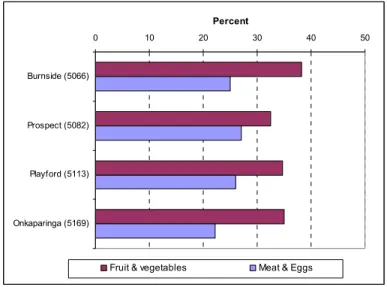
- Healthy Food Availability and Affordability
- Community Groups/Organisations
- Chapter Summary
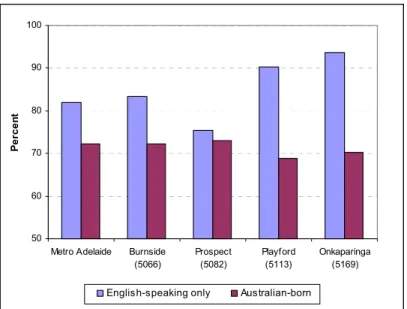
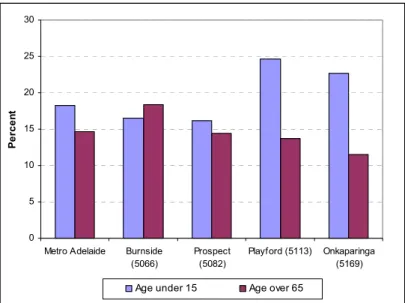
The proportions of people aged under 15 and over 65 were similar to the Adelaide average, while half of the population in Prospect was in the prime working age of 20-49. Playford has significantly more Indigenous residents than the other three areas, at 4 per cent of the total population, and also higher than the Adelaide average (1%).
Perceptions of Neighbourhood Environment and Social Life
- Perceptions of Neighbourhood Socio-cultural Environment
- Bad/Good Reputation
- Unfriendly/Friendly
- Dangerous/Safe
- Perceptions of Neighbourhood Physical Environment
- Perceptions of Neighbourhood Services and Amenities
- Public Transport
- Health Services
- Shops and Recreational Facilities
- Perceptions of Neighbourhood Social Life
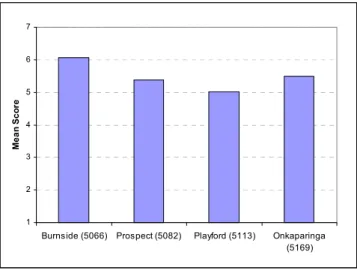
- General Perceptions of Neighbourhood Cohesion
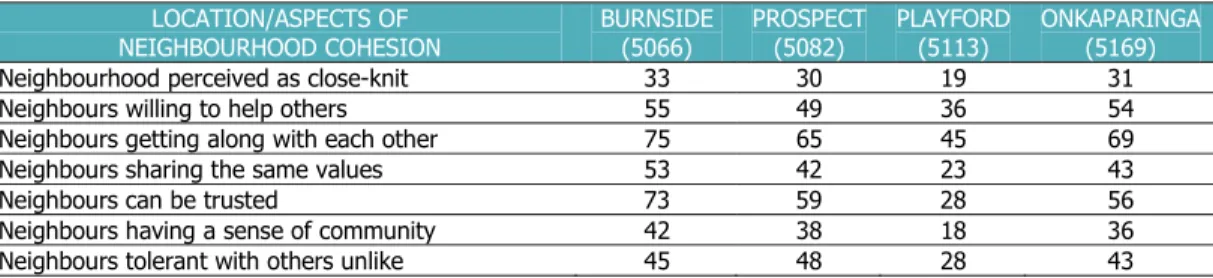
- Perception of Neighbourhood Cohesion by Postcode
- Chapter Summary
There were significant differences in perceptions of neighborhood friendliness between all postcodes except Burnside and Onkaparinga (Figure 4.2). There were significant differences in perceptions of a strong sense of community between respondents in Playford and the other three postcodes.
Social Networks, Help and Assistance, and Trust
Social Networks and Activities
- Group Activities
- Social Activities
- Civic Activities
Of the four postcodes, respondents in Burnside had significantly less face-to-face contact with their relatives than respondents in the other three codes. Just under half of respondents in Playford were satisfied with their social life, significantly less than respondents in other postcodes. More than half of respondents in Prospect and Onkaparinga knew people of the same or similar backgrounds through social activities.
Help and Assistance Available
- Perception of Reciprocity and Help
- Number of People Available for Help
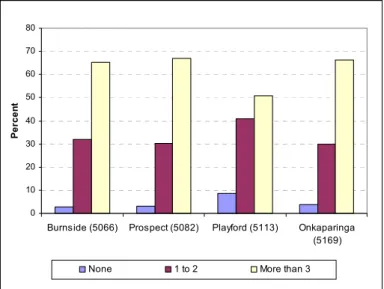
Figures 5.10 to 5.14 show the number of available people in different situations for respondents in the four postal codes. About two-thirds of respondents in Burnside, Prospect and Onkaparinga had three or more people available to talk to, and over 30 percent of respondents had one or two people available for such assistance (Figure 5.10). More than 60 percent of respondents in Burnside, Prospect and Onkaparinga had three or more people available (figure 5.11).
Levels of Trust
- Levels of Trust of Respondents across Postcodes
- Levels of Trust by Postcode
Burnside respondents showed the highest level of trust from people in Australia, while Playford respondents showed the lowest. Playford respondents reported significantly lower levels of trust than respondents in the other three areas and Burnside respondents reported higher levels of trust than Prospect respondents. Comparatively, Burnside respondents had the highest level of trust towards big business, followed by respondents in Prospect and Onkaparinga.
Social Isolation
Chapter Summary
Health, Social Capital and Neighbourhood
General Health
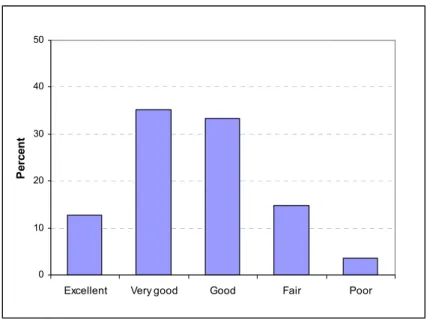
- General Health of All Respondents
- General Health of Respondents by Postcode
- General Health by Social Isolation
A significant majority of respondents in Burnside (90%), Prospect (88%) and Onkaparinga (85%) rated their health as good or better. Significantly fewer respondents in Playford reported their overall health as good or better (74%), while a quarter felt their health was good or poor. For example, 23 percent of non-trusting respondents reported fair/poor health, compared to 15 percent of those with higher levels of trust.
Locational Differences in Physical Health Status
- Physical Health of Respondents by Postcode
- Physical Health of Respondents by Age Group by Postcode
- Physical Health of Respondents by Gender by Postcode
- Physical Health of Respondents by Household Income by Postcode
- Summary of Physical Health Status
At Burnside and Prospect, male respondents had better physical health status than female respondents, but at Onkaparinga and Playford the differences were negligible. In the lower income group, Burnside respondents had the highest physical health status, but in the higher income group, Prospect and Onkaparinga respondents had higher health status. Residents of Burnside and Prospect enjoyed the best physical health, followed by Onkaparinga and then Playford.
Locational Differences in Mental Health Status
- Mental Health of Respondents by Postcode
- Mental Health of Respondents by Age Group by Postcode
- Mental Health of Respondents by Gender by Postcode
- Mental Health of Respondents by Household Income by Postcode
- Summary of Mental Health Status
In addition, in each postcode area, women always had a lower mental health status than men. In the lower household income group, Burnside and Onkaparinga respondents had a higher mental health status than the other two postcodes. In the middle income group, Burnside respondents had the highest mental health status followed by Playford respondents, with Prospect and Onkaparinga respondents reporting lower mental health status.
Individual Health-related Behaviour and Health
- Health-related Behaviour
- Health-related Behaviour and Physical and Mental Health
While Burnside had the highest percentage of non-smokers, almost 90 percent, Playford had the highest percentage of heavy smokers; 9 percent of them smoked more than 21 cigarettes daily (figure 6.13). Respondents who exercised regularly had significantly better physical and mental health status than those who did not (Figure 6.17). It was found that those who drank alcohol had better physical and mental health status than those who did not (Figure 6.19).
Social Capital, Neighbourhood and Mental Health Status
- Perception of Neighbourhood Influence on Health
- Social Capital and Mental Health
- Neighbourhood and Mental Health
- Summary of Social Capital, Neighbourhood and Mental Health
The state of mental health was significantly lower in respondents who perceived their neighborhood as noisy than in those who did not (Figure 6.26). There were no significant locational differences in mental health among respondents who did not feel they belonged to the neighborhood. There were no significant differences in mental health status among respondents who consider their neighborhood to be close-knit.
Chapter Summary
Engaging with Policy Makers
Introduction
Members of the research team have effective and enduring links with many committee members, service providers and policy makers who have attended both local and national workshops. As a result, this chapter begins by presenting the findings from both the local and national workshops, grouped into the five policy themes. The chapter then explores the implications for whole government and policy against the backdrop of the South Australian Strategic Plan.
Themes from State and Local Policy Consultations
- Education and Employment Opportunities
- Accessible and Affordable Transport
- Physical Design of Neighbourhoods
- Community Development and Social Capital at a Local Level
- Mix of Services and Facilities and Methods of Integrated Planning for These
It was noted that the GST meant the rich paid less tax and “the rest paid more because of broad taxes like the GST”. It was noted that there is no university campus in the north of the city and that training opportunities for trades and semi-skilled jobs are very limited and need to be expanded and available. The state workshop argued that strong links exist between housing mix, the physical design of suburbs, changing demographics and the need for programs to promote early childhood development and lifelong learning.
Policy Context
Time and again, in the policy consultations, it has been argued that the South Australian Strategic Plan (http://www.stateplan.sa.gov.au/index.php accessed 25 January 2007) sets out the broad visionary framework for addressing inequality and which brings about a significant change in the types of policies designed to achieve equality. It is recognized that there are many powerful barriers that stand in the way of fundamental change. The essential links between the fundamental and the incremental lie in the ability of federal and state governments to create a context that, at both state and local levels, is collaborative, whole-of-government and long-term policies that are explicitly focused on the social determinants , promote. of health and health equity.
Conclusions
- Compositional Effects on Health
- Contextual Effects on Health
- Setting Our Findings in a Broader Context
- Final Comments
Most of the patterns in our research were predictable, with residents in the most affluent case study area reporting the highest physical and mental health summary scores. This was the case for most of the social and physical assessments of the environment, for a number of the mental health scores by social capital, and for some of the civic activities. As such, it is just part of the understanding required to support more effective efforts to reduce health inequalities.
Members of the Project Team
Members of the Project Advisory Committee
Directorate of Health Services in the Community, Population and Primary Health Care. formerly Community and Allied Health Services, Noarlunga Health Services).
Summary of Respondents of the Postal Survey
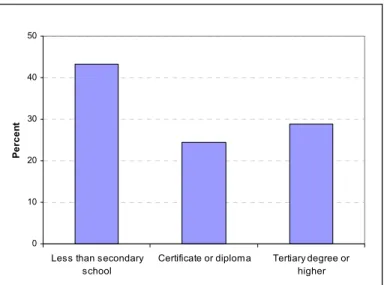
A total of 61 percent of respondents were employed at the time of the survey, of which full-time (36%), part-time (16%) and self-employed (9%), as opposed to 3% unemployed (Figure A3.3). Just over a third of respondents were not in the labor force, including retired (19%), homework (8%) and others such as full-time study. One-third of respondents had a household income of less than $32,000, and another slightly more than a third of respondents had a household income between $31,200 and $78,000.
Summary of Respondents in In-depth Interviews
List of Independent Measures
Location of the four case study postcode areas within Local Government Areas
There were also significant differences in the perceptions of neighborhood beauty between all postcodes except those between Onkaparinga and Prospect. There were significant differences in the perception that neighbors were willing to help each other between Playford and the other three postcodes. There were significant differences in the number of cigarettes people smoked per day between all postcodes.
Mental health status was significantly higher for those who felt they belonged to the neighborhood than for those who did not. However, for those who did not consider their neighborhood close-knit, the mental health status of respondents in Playford was significantly different to that of respondents in the other three postcodes. However, there were no significant locational differences in mental health among respondents who did not feel they belonged in the neighborhood.
However, in Playford, for those who did not consider their neighborhood close-knit, respondents' mental health status was significantly lower than respondents in the other three postcode areas.