I acknowledge the Traditional Owners of the lands where QUT is now located - and recognize that these have always been places of education and learning. If you would like to walk to dinner with the conference group, please meet at the Goodwill Bridge head (QUT side of the river) at 6:10 PM.
Indoor Environment Quality
Stephen Kajewski, Head of School of Civil Engineering and Built Environment, Queensland University of Technology, Australia. Housing and Health: Lessons from New Zealand Dr Nevil Pierse, University of Otago, New Zealand 10.30am morning tea.
Sustainable Design
November
November: Conference Day 1
Indoor Environment Quality
Sustainable Design
Neighbourhood Planning
Housing in the context of precints and cities
- Indoor Environment Quality
- Stakeholders / Markets / Performance
- Energy and Environment and Health
- Modelling / Simulation / POE
- Indoor Environment Quality
- Building Information Management
- Understanding the Links between Housing and
- Building the
14:45 4.1D - Effect of indoor air temperature on blood pressure among nursing home residents in Japan. 16:15 5.1B - Thermal environment and thermal comfort in a passive residential building in the severe cold area of China.
Energy Innovation in the Built Environment: Knowledge Transfer from Germany
Task group TG86 - Building healthy cities - addresses the planning, design, construction, management and maintenance and deconstruction of all components of the built environment. Contribute your knowledge and expertise to discussions on the links between healthy housing and healthy cities.
Research Collaboration Day
Energy Innovation in the Built Environment: Knowledge Transfer from Germany
Affordable Housing
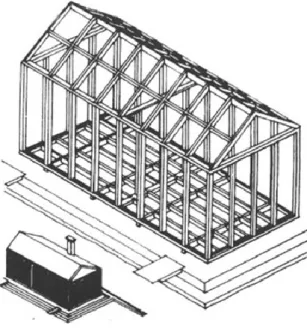
A flat-pack DIY Tiny House
Nathalie Röbbel is a technical associate in the Department of Public Health, Environment and Social Determinants of Health (SDH) at WHO in Geneva and is currently leading the department's work in developing WHO guidelines for housing and health. Her main duties are to provide technical support to streamline social determinants of health within environmental health programs.
Dr Nevil Pierse , University of Otago, New Zealand
Before joining WHO headquarters, she worked as a technical officer at the WHO Regional Office for Europe in Bonn and Copenhagen, where she was responsible for environmental health performance reviews and involved in several projects related to housing and health.
Professor Yinping Zhang , Tsinghua University, Beijing
Telecommunications at UNSW Australia, and Joint Director (Engineering) of the University's Center for Energy and Environmental Markets (CEEM). Iain's teaching and research interests at UNSW include electricity industry restructuring and Australia's national electricity market, renewable energy generation technologies, distributed energy resources, energy efficiency options, and energy and climate regulation, market design and policy.
Professor Sherry Ahrentzen, University of Florida, USA
Relationship between indoor and outdoor PM2.5 concentrations in the very cold region of China: based on a long-term field measurement. Thermal environment and thermal comfort in a passive residential building in the extremely cold area of China.
Last Name, First Name
Abstract
Introduction
Spores in the detector will grow if the microclimate is suitable for such growth. Fungal spores are always floating in the air, infiltrating buildings and attaching themselves to walls, ceilings, floors or objects in rooms.
Methods
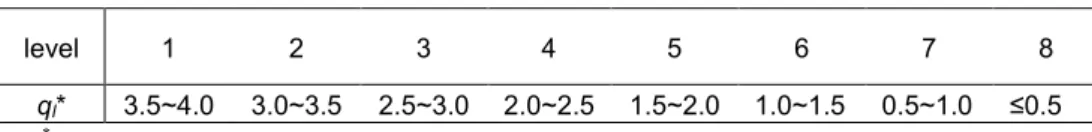
- A fungal index and fungal detector
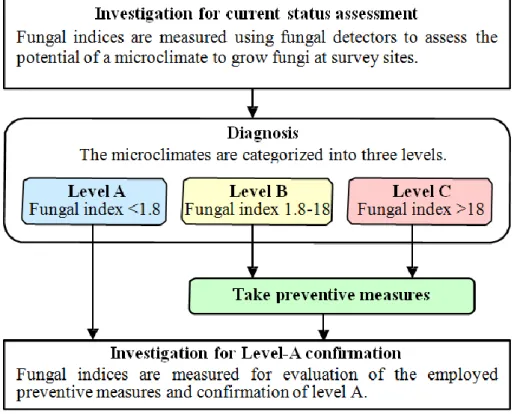
- Prevention strategy againsts fungal attack using a fungal index
- Application of the prevention strategy
If the exposure periods were different, the values of the fungal index would be different. A particular building for the storage and display of cultural values was selected to apply the prevention strategy shown in Figure 3.
Results and Discussion
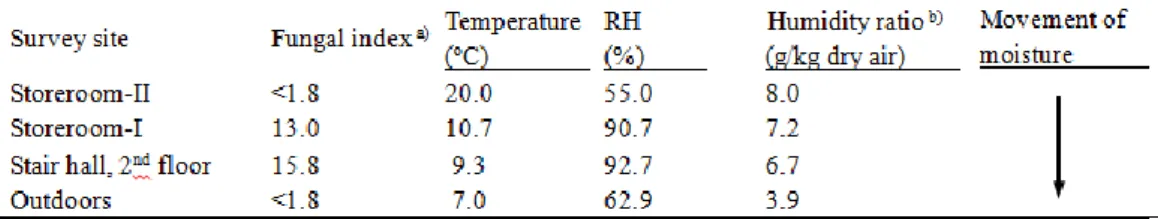
- Current status assessment and diagnosis
- Explanation for the fungal contamination
- Preventive measure
- Investigation for level-A confirmation
This proved that the cause of the high fungal indices in the building in the current condition assessment was due to the movement of moisture from Warehouse-II to Warehouse-I and from Warehouse-I to the stairwell. Fungal indices estimated from temperatures and RH were 0.0 in Depo-I and 0.2 in the 2nd floor of the stairwell.
Conclusions
Acknowledgement
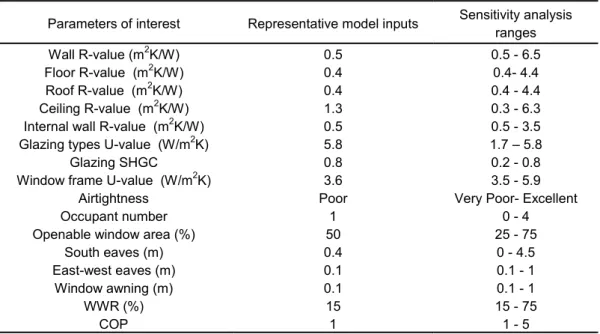
Taguchi and ANOVA methods were used to produce a smaller number of models that included significant energy performance determination parameters. A discussion of the process and criteria used to segment the building stock into representative typologies for the studies discussed above, and others, can be found in (Daly et al., 2016).
Methodology
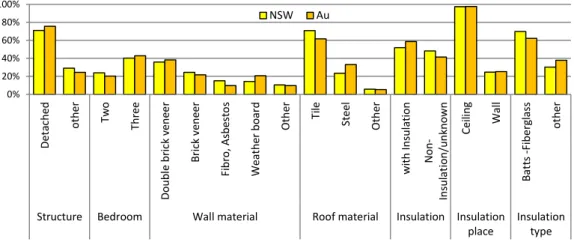
- Review of Australian Bureau of Statistics (ABS) Housing Data
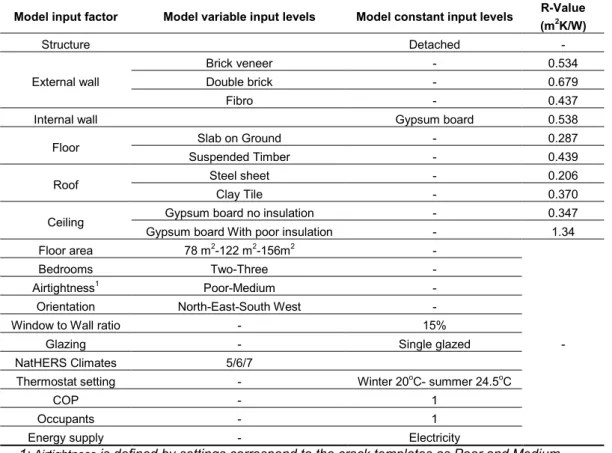
- Taguchi design of the simulation models
- Differential sensitivity analysis
- Statistical Review of ABS Housing characteristics
- Design of Experiment (Taguchi) and ANOVA methods analysis
- Differential sensitivity analysis of example reference building model
Simulation models were generated for different combinations of traits, which are shown in Table 3. ANOVA results from the Taguchi order analysis with the S/N delta ratio for the first experiment are presented in Table 4.
Discussion and limitations
DSA provides information about the sensitivity of a parameter at a single point in the parametric space, and does not provide insight into areas outside the parametric range of a given set of simulations unless the data can be linearly extrapolated. In this study, a linear relationship between the range of the parameters and the outputs of DSA was assumed, but the effect of this assumption should also be tested while expanding this study in the future.
Conclusion
Results – The thermal performance of the existing buildings meets the legal requirements at the time of construction (before 2006), but is 70% higher than current regulations. However, the benefits of the proposed renovation options are questionable due to the practical limitations of the existing building and the discrepancy between these users and the occupancy assumptions in the simulation tool.
Background
- Thermal performance requirements of Australian housing
- The case study context
Other research suggests that energy policies may not deliver the expected results due to the complex and dynamic relationships between energy efficiency and 'the myriad thermal experiences and preferences' of residents and their socio-cultural and individual contexts (Tweed, Humes, & Zapara- Lancaster, 2015). The growing evidence linking the resilience of older people to extreme temperatures and the characteristics of the buildings they live in (Loughnan, Carroll, & Tapper, 2015; Vandentorren et al., 2006) would indicate the importance of aspects to consider in renovation activities related to this demographic situation. .
Methology
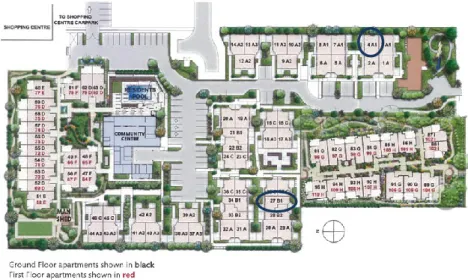
- Physical characteristics of units under study
- Occupancy and operation of case study units
- Simulation
After physical inspection of the buildings, three potential renovation options were selected for simulation, two of which related to improving the thermal performance of the building envelope (R2 bulk insulation for the ceiling; replacing single glazing with double glazing (clear glass, air-filled; the most common double glazing option in Australia)) and one where air movement is improved to improve the thermal experience of the occupants without cooling the space (i.e. the installation of ceiling fans). Using the climate files of the Reference Meteorological Year (RMY), the software calculates the heat flows into and out of the building envelope on an hourly basis to determine the space heating and cooling load.
Results
- Base Run
- Simulation of proposed retrofits
To specifically address summer conditions, the third option – adding ceiling fans – was considered in two phases. The simulation results show that the installation of ceiling fans would, theoretically, have the greatest impact on reducing summer cooling loads (about 50%), followed by ceiling insulation (about 20%).
Discussion
- Ceiling Fans and Insulation
- Occupancy protocols in simulation tools
- Limits to adaptive comfort and the ‘senior’ demographic
An increasing number of studies point to the need to consider not only energy efficiency, but also improvements to indoor environmental conditions other than thermal conditions (e.g. low VOC) (Ahrentzen et al., 2015), other qualities of the spaces (e.g. acoustic) and the residents' preferences for how they want to use the spaces and what value they attach to the home environment (Tweed et al., 2015;. In addition to calculating energy savings, greater efforts must be made to quantify the health benefits of retrofit actions (Ahrentzen et al., 2015) that require collaboration between built environments and health professionals.
Conclusion
The adaptive comfort principle assumes that people will take actions to create/maintain their comfort (Nicol & Roaf, 2007), with three categories of adaptation: physiological, psychological, and behavioral. Physiological studies have shown that older people may experience a reduced ability to maintain a stable core temperature (Lewis, 2015), possibly contributing to their higher vulnerability to heat waves such as those experienced in the UK (Brown & Walker, 2008).
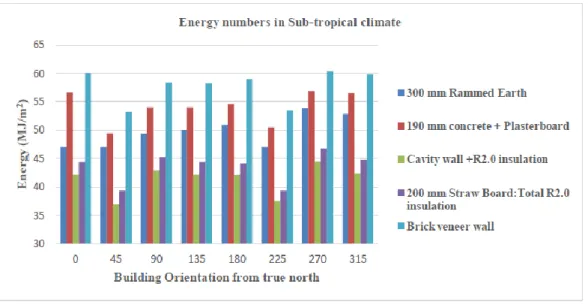
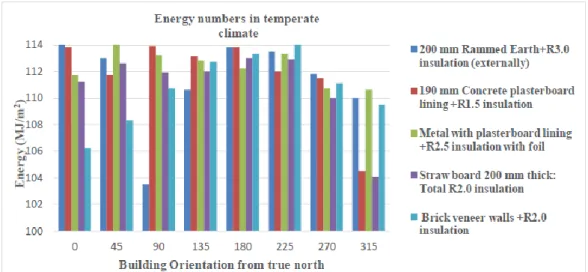
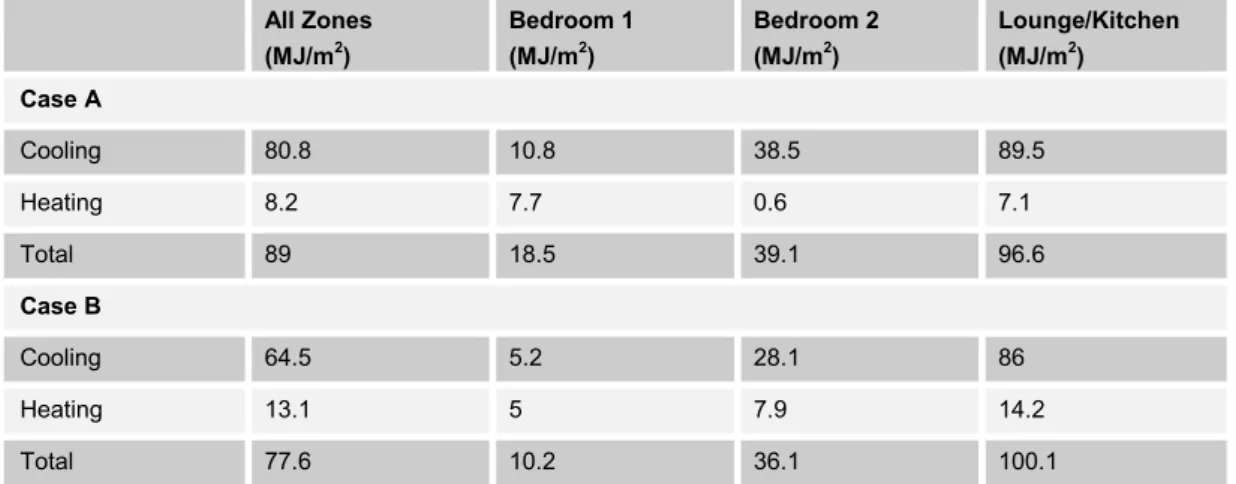
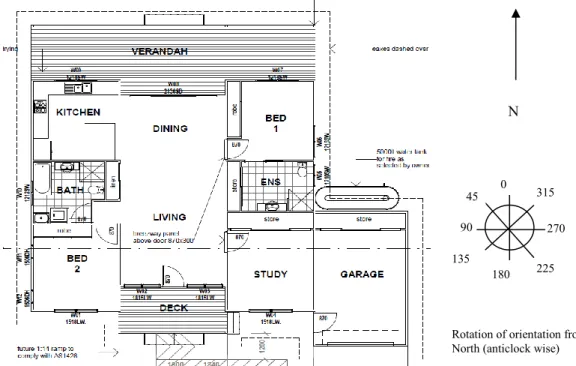
Insulation is not required for a rammed earth home in a tropical climate for the proposed floor plan. The energy performance of the earth-built house was also compared with lightweight and heavyweight constructions in the sub-tropical (climate zone 2), tropical (climate zone 1) and temperate (climate zone 6) climates of Australia.
Results and discussion
- Rammed Earth built house in Sub-tropical climate
- Rammed Earth built house in tropical climate
- Rammed earth built house in temperate climate
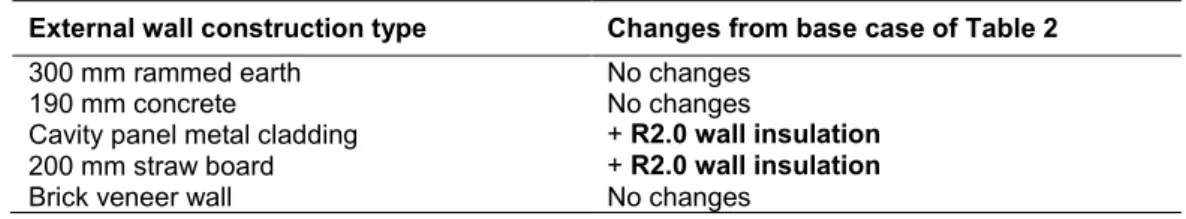
The difference between rammed earth and straw slab walls with R2.0 insulation was approximately 8MJ/m2. Without extra insulation in the exterior walls and roof, a house built in earth would not achieve 6 stars in a temperate climate.
Thus, there is a need to investigate how outdoor temperature relates to indoor temperature, especially in residential environments. ID Type of settlement Month of measurement Pearson correlation (r) between average hourly indoor and outdoor temperatures.
Conclusion
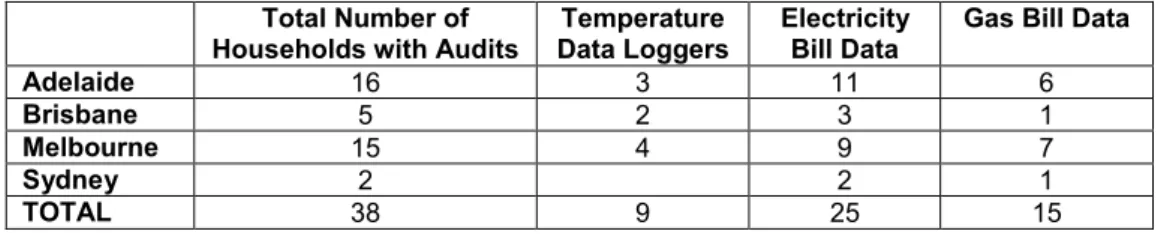
- Data collected from Energy Bills
- Using Energy Bills
- Air conditioning Survey Summary
- Electricity and Gas Bills
- Data from Temperature Loggers
Given this situation, a clearer understanding of energy use in households of people with MS is vital. In this research, energy audits were conducted in 38 households of people with MS across Australia.
Conclusion and Policy Recommendations
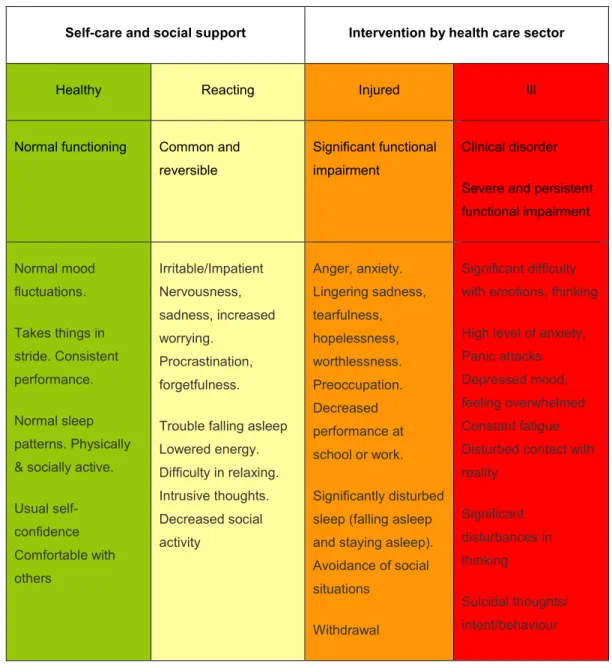
The average temperature in the 2 homes with PwMS was 1.5 °C lower than the 9 homes without PwMS. There is no advice on what we can do in our homes to maintain our mental health.
Methodology
There is long-standing recognition that a person's physical and mental health can be affected by the place in which they live (Chapin, 1951; Novick, 1971). Topics such as homelessness, alcohol, drugs and their impact on housing and mental health were not included in this review (despite their breadth in the literature).
Discussion
Poor quality housing has a greater impact on mental well-being than type of housing (Grigg et al., 2008). While Baker et al., (2013) "found little evidence of an intrinsic relationship between tenure and mental health".
Limitations of this work
Interestingly, Curl et al., (2015) showed that heating provision can also negatively affect residents' physical activity, which in turn can affect mental health. The behavior of the residents of the housing – violence or just disorder – can also have a negative impact on health (Suglia et al., 2015).
Recommendation for future work
The vast majority of the reviewed papers were based in a Western context with Marais and Cloete (2014), Marais et al., (2013) and Mridha (2015) being the exceptions. This is still true today, but we must first focus on the individual and their needs.
Declaration
However, the approach taken to this literature review meant that much of the literature on the role of intervention in prisons, police stations and similar settings was not included. It is important to recognize that the research methodologies used in Western cultures are not necessarily directly transferable to other parts of the world (Ferguson et al., 2013; Marais et al., 2013).
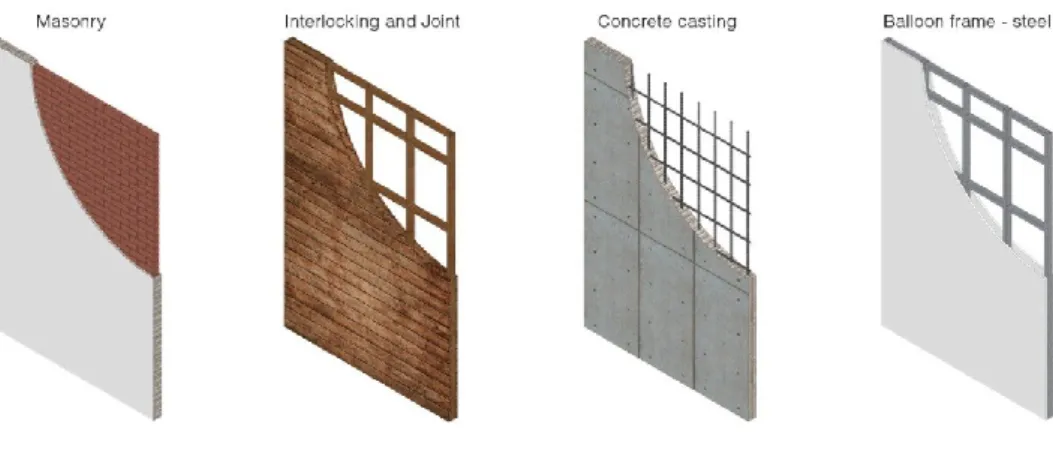
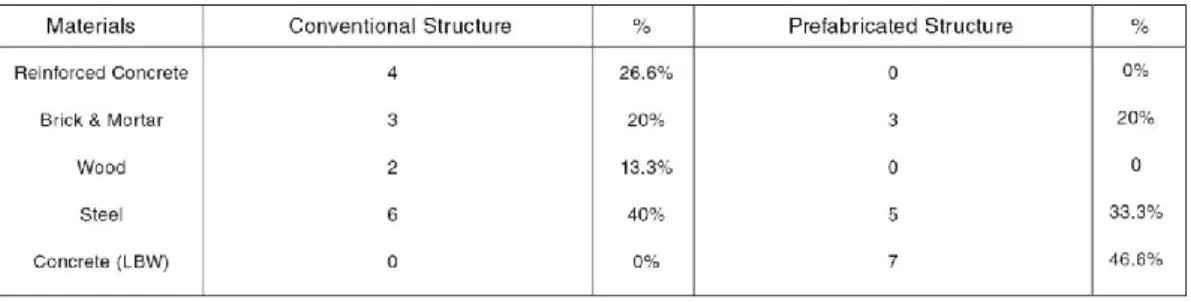
- Masonry and Concrete casting
- Prefabricated (Load bearing wall) and modular unit
Maslow and Mental Health Recovery: A Comparative Study of Homeless Programs for Adults with Serious Mental Illness. The effect of housing on the mental health of older people: the impact of lifetime housing history in Whitehall II.
Research method
Basically, the 3 types of structures are categorized according to defined criteria of characteristic, material and construction technique. Most prefab sites are designed and built by a development company using a retaining wall system that is custom made to architectural designs, prefabricated in the factory, and assembled on site.
Data Analysis
- Function of expansion of area
- Construction material of expansion area
- Cost
- Timing
- Opinions on existing structure toward expansion process (limitation, difficulty, ad- vantages and disadvantages)
One of the important factors affecting the expansion process was the characteristics of the existing prefabricated partition wall. T]his house uses the SCG HEIM modular housing system with an expansion process; it faced some difficulties due to the limitations of the existing structure.
Suggestions
Appendix
Keywords - Air pollution by fine particles (PM2.5); Infiltration characteristic; Penetration factor; Deposition rate; evaluation model. To solve this problem, this paper introduces a new method that can calculate the penetration factor, deposition rate and the dynamic air exchange rate based on field-measured indoor and outdoor PM2.5 mass concentrations.
Materials and methods
- Model development
- Model solution
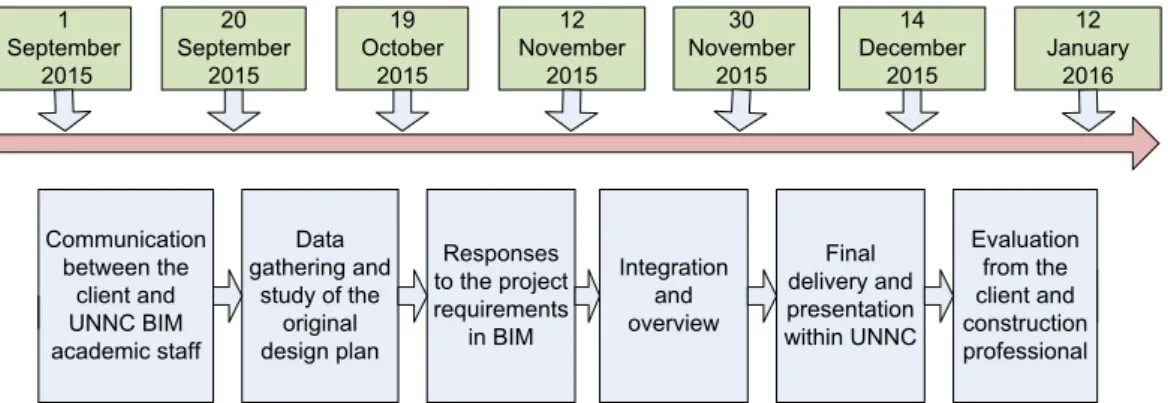
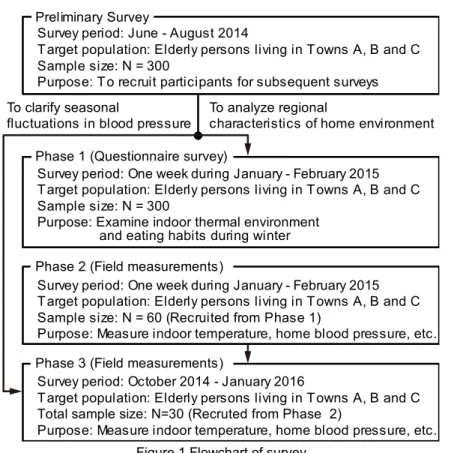
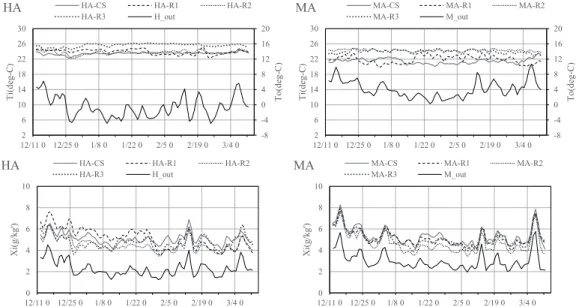
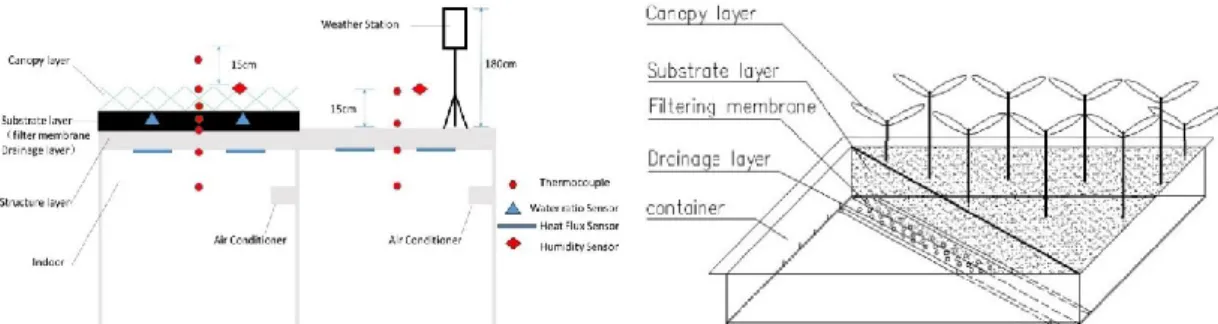
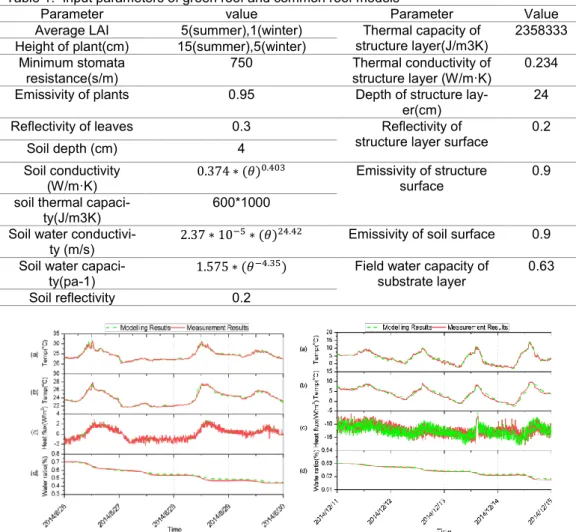
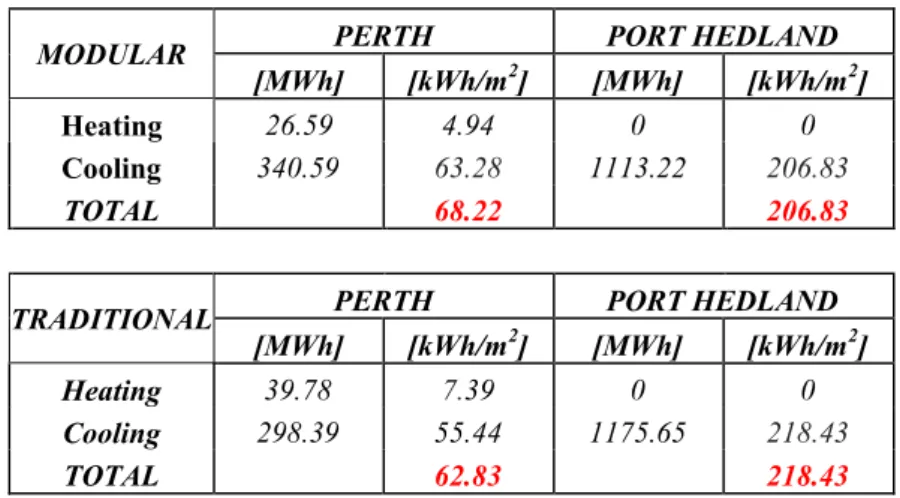
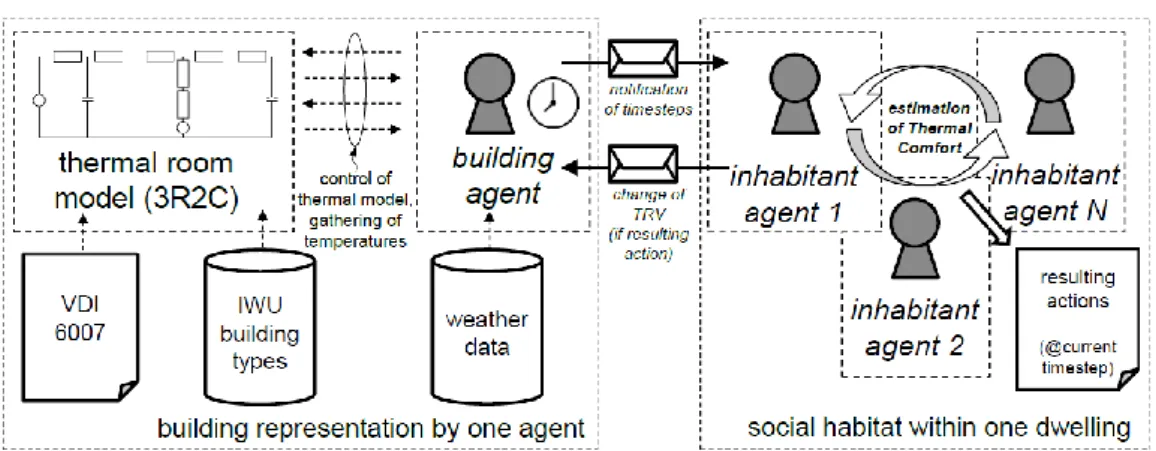
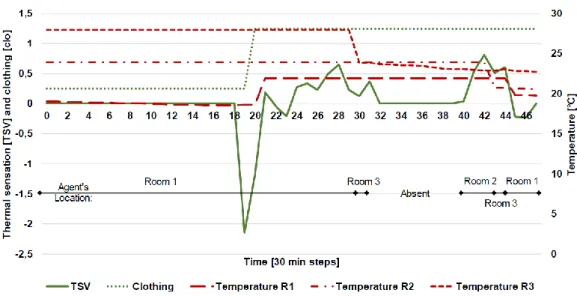
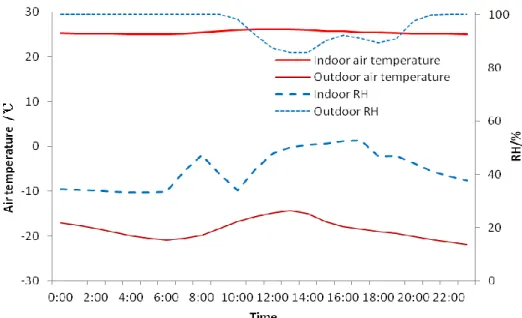
Based on the study conducted by Bennett and Koutrakis, Mleczkowska et al. 2016) required less than 5% of the minimum error to calculate the average penetration factor and deposition rate. All values of δi,j were sorted from low to high (the values within 1 So we can get some of the [P,k] value using the method in Model Solution. Thus, the value of P in site 2 is smaller. The wall roughness, the ratio of volume to chamber surfaces (V/S) can affect the deposition loss rate (k), k is positively correlated with roughness and V/S . The figure in site 1 and 2 is both 0.12. Therefore, the planning process and the decision-making process of the Bottrop case study will be analyzed. Problems, obstacles and impulses will be identified. The case study will analyze discrepancies between the development goals of the city and the implemented projects. It appears that the content of projects is mainly determined by the purpose of the funding programme. In this way, the municipalities' dependence on support programs and their limited capacity to implement urban development projects without funding will be clarified. Some of the activities are financed in the framework of public research or urban development programs, supported by the EU commission, national or land ministries. The Bottrop city administration successfully applied to EU-federal level funding programs and with the slogan "Blue sky - green city" they found a holistic strategy that fits the various funding programs. Originality – The findings of this research will contribute to knowledge about the link between the thermal indoor climate and health. The second and final phase (phase 2 and phase 3) included field measurements of the indoor thermal environment and blood pressure of selected subjects from phase 1. This paper describes the results obtained by measuring the internal temperature and blood pressure of 30 elderly people over a year. These results indicate that the systolic blood pressure of elderly persons is positively related to exposure to temperatures lower than 15°C. Residents know that it is necessary to keep humidity moderate for infection control and they use portable humidifiers. The average humidity was lower than 40RH%. the standard value in AMAB1970 / the law on the maintenance of sanitation in buildings established in 1970) in most of the rooms in the facilities. Therefore, the influenza virus concentration is calculated using the following equation (3) taking into account the effect of ventilation and absolute humidity. When we use the rate of generation of influenza viruses in a Minf p person, the following equation is given. The left figure shows a contour plot of Γ with indoor absolute humidity Xi and ventilation rate one person Qp. One of the factors for this increase is believed to be the increase in the ventilation rate of a person Qp. We measured the indoor temperature in nursing homes and collected data on the resident's blood pressure via a standardized questionnaire. We measured the indoor temperature in nursing homes and collected data on the residents' blood pressure through a standardized questionnaire. These results indicate that systolic blood pressure was affected by indoor temperature in winter. The warm group had a lower blood pressure increase in winter than the cold group (Figure 3). A green roof is usually divided into three major layers, namely the vegetation layer, the substrate layer and the structural layer. T-type thermocouples were placed at different heights along the vertical direction of the green roof and common roof and measured the temperatures of different layers. To quantify the relative advantage of green roof compared to conventional roof from the point of view of long-term thermal performance, equivalent thermal resistance based on hotbox method is used. Under the same climate, common roof with thermal resistance has the same heat insulation effect as green roof, this thermal resistance is called equivalent thermal resistance. The basic indoor temperature of the hot box is set to 25℃ in summer and 20℃ in winter, and the simulation uses typical annual meteorological weather data of Shanghai. Average temperature of the outer surface of the corresponding common roof.𝑇𝑇̅̅̅̅𝑠𝑠1: Average temperature of the inner surface of the corresponding green roof. This paper proposes a new model of the green roof system and based on this method, it is found that the green roof has a better insulating effect than the corresponding ordinary roof, no matter in Shanghai summer or winter. Moreover, the equivalent thermal resistance of the green roof is not a fixed value and is significantly affected by internal and external factors, such as plant LAI, outdoor temperature, etc. It also shows the importance of operational energy in the overall carbon footprint of a building and, more generally, how prefabricated construction can easily achieve a lower carbon footprint than on-site construction. This latest study focused on the difference in the carbon footprint of the construction process rather than the building itself. The literature review shows that some researchers have already addressed carbon and energy embodied in the building itself (Monahan and Powell in 2001), and some have shown that operating energy is the most important part of a building's carbon footprint (Aye et al 2012). The detailed load allowed the study of the thermal behavior of the building and the extraction of important information to understand the annual results. As a result, the carbon footprint of the structural elements of the modular building is higher than the concrete used in the traditional equivalent. Regarding the multi-storey building, the carbon footprint of operational energy is dominant in the life cycle assessment of the building. 34;Life cycle greenhouse gas emissions and energy analysis of prefabricated reusable building modules. “Energy and Buildings. 34;Preliminary Life Cycle Assessment of Modular and Conventional Homes in Benton Harbor, Michigan.” University of Michigan Ann Arbor. These figures are affected by the degree of insulation of the building, which must be analyzed in detail. The simulation progresses in time steps of 30 minutes, which preserves the transient behavior of the building and enables a realistic number of adjustments and actions for the occupants. The first time step of the simulation is defined as midnight on September 1, which is the beginning of the heating period in the given climate. The perceived need for modernization (i.e. the demand for heating) is not in balance with a household's financial capabilities to undergo such modernization. In phase (III) the demand for heating reaches the minimum, since all three residents spend most of their daily time at work. However, in the next phase of their life, the demand for heating increases significantly, but now the family may no longer have the financial potential to modernize their home. The continuous monitoring results of inner surface temperature in the outer wall for the same apartment were shown in Figure 2. The temperature difference between indoor air temperature and surface temperature varied by an average of 0.70℃. Where MTS is the average thermal sensitivity rating, and ta is the indoor air temperature. When the indoor air temperature was too high, most residents would feel uncomfortable and prefer a lower temperature. Because physiological acclimatization could occur within days or weeks and the indoor temperature was relatively constant during the heating period, occupants would adapt psychologically to the environment. In the passive building, the neutral temperature was higher than that in normal apartments, and the clothing insulation was lower than in normal apartments, both of which indicate the residents' adaptation to the current environment. Not only could the thermal comfort of the occupants be improved, but energy consumption was also reduced. This study aims to integrate real-world design context into BIM pedagogy and demonstrate the ability of BIM in improving teamwork in interdisciplinary collaboration. Originality – This work provides the case study in pedagogical practice demonstrating the multidisciplinary collaboration enabled by BIM in the areas of architectural visualization, structural design, budget control and sustainability strategies.Case study
Research Problem
The case
Methodology
Result and Discussion
Materials and Methods
Acknowledgments
Methods of estimating influenza infection control 1 Index for influenza infection control
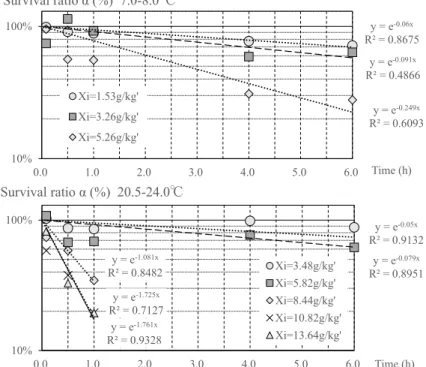
Estimation of influenza infection control in facilities for the el- derly
Acknowledgements
Results
Acknowledgements
Numerical model of common roof
Green roof and common roof's model validation
Green roof long-term thermal performance evaluation
Background of the two case studies
Results and discussion
Conclusion and lessons learned
Annexes
Validation and results
Conclusion and outlook
Measurement Results
Subjective Results
Conclusions
Acknowledgement