PREDICTION OF FACEBOOK ADDICTION USING MACHINE LEARNING
BY
MD. ZAHIRUL ISLAM ID: 162-15-7822
AND Ziniatul Jannat ID: 162-15-7679
This Report Presented in Partial Fulfillment of the Requirements for the Degree of Bachelor of Science in Computer Science and Engineering.
Supervised By
Md. Tarek Habib
Assistant Professor Department of CSEDaffodil International University Co-Supervised By
Md. Sadekur Rahman
Assistant Professor Department of CSEDaffodil International University
DAFFODIL INTERNATIONAL UNIVERSITY
DHAKA, BANGLADESHJULY 2020
APPROVAL
This Project titled “PREDICTION OF FACEBOOK ADDICTION USING MACHINE LEARNING TECHNIQUES Of Bangladesh Perspective”, submitted by Md Zahirul Islam, ID: 162-15-7822 and Ziniatul Jannat, ID: 162-15-7679 to the Department of Computer Science and Engineering, Daffodil International University, has been accepted as satisfactory for the partial fulfillment of the requirements for the degree of B.Sc. in Computer Science and Engineering and approved as to its style and contents. The presentation has been held on July 2020.
BOARD OF EXAMINERS
Dr. Syed Akhter Hossain Chairman
Professor and Head
Department of Computer Science and Engineering Faculty of Science & Information Technology Daffodil International University
Dr. Md. Ismail Jabiullah Internal Examiner
Professor
Department of Computer Science and Engineering Faculty of Science & Information Technology Daffodil International University
Nazmun Nessa Moon Internal Examiner
Assistant Professor
Department of Computer Science and Engineering Faculty of Science & Information Technology Daffodil International University
Dr. Mohammad Shorif Uddin External Examiner
Professor
Department of Computer Science and Engineering Jahangirnagar University
i
©Daffodil International University
DECLARATION
We hereby declare that; this project has been done by us under the supervision of Md.
Tarek Habib, Assistant Professor, Daffodil International University, Bangladesh. We also declare that neither this project nor any part of this project has been submitted elsewhere for award of any degree or diploma.
Supervised by:
Mr. Md.Tarek Habib Assistant Professor
Faculty of Science and Information Technology Daffodil International University
Dhaka, Bangladesh
Co-Supervised by:
__________________
Md. Sadekur Rahman Assistant Professor
Faculty of Science and Information Technology Daffodil International University
Dhaka, Bangladesh Submitted by:
____________________
Md. Zahirul Islam ID: 162-15-7822 Department of CSE
Daffodil International University
________________________
Ziniatul Jannat ID: 162-15-7679 Department of CSE
Daffodil International University
ii
©Daffodil International University
ACKNOWLEDGEMENT
First, we express our heartiest thanks and gratefulness to Almighty Allah for his divine blessing makes us possible to complete the final year project/internship successfully.
We really grateful and wish our profound our indebtedness to Mr. Md. Tarek Habib, Assistant Professor, Daffodil International University, Bangladesh. Deep Knowledge & keen interest of our supervisor in the field of “Machine Learning” to carry out this project. His endless patience, scholarly guidance, continual encouragement, constant and energetic supervision, constructive criticism, valuable advice, reading many inferior drafts and correcting them at all stage have made it possible to complete this project.
We would like to express our heartiest gratitude to Dr. Syed Akhter Hossain, Head, Department of CSE, for his kind help to finish our project and also to other faculty member and the staff of CSE department of Daffodil International University.
We would like to thank our entire course mate in Daffodil International University, who took part in this discuss while completing the course work.
Finally, we must acknowledge with due respect the constant support and patients of our parents.
iii
©Daffodil International University
ABSTRACT
In this modern age social media is a part and parcel of our everyday life. Our daily life is undergoing multiple changes that directly have positive and negative effects. Social media has positive and negative side too. Sometimes it is helpful but sometimes harmful. Facebook is one of the social media which uses mostly comparing to others. There are some changes in our daily life by using it. We are not concern about our time table and we are scrolling Facebook without any need. The main reason behind Facebook is communication. Now it is not only communication but also wasting some valuable time. It is called addiction and most of the people eat, sleep and repeat Facebook. It is quite hard to predict Facebook addiction without collecting and testing data.
Prediction is much easier when there is “Machine Learning”. The main purpose of the current study is to predict the addiction of people on Facebook and aware of their daily routine with high accuracy. For the prediction of Facebook addiction, we use seven ‘Machine Learning’
classification algorithms such as Support Vector Machine (SVM), Decision Tree (DT), Naïve Bayes (NB), Linear Regression (LR), Logistic Regression (LR), Linear Discriminant Analysis (LDA), k-Nearest Neighbors (kNN). After using algorithms, we use Principal Component Analysis (PCA) for reducing data mathematically. Our finding demonstrates that kNN with greater accuracy rate (93.53%) outperforms the k-Nearest Neighbors.
iv
©Daffodil International University
TABLE OF CONTENTS
CONTENS
PAGEBoard of examiners i
Declaration ii
Acknowledgements iii
Abstract iv
CHAPTER
CHAPTER 1: INTRODUCTION
1-41.1Introduction 1-2
1.2Motivation 2
1.3Rationale of the Study 2
1.4Research Questions 3
1.5Expected Output 3-4
1.6Report Layout 4
CHAPTER 2: BACKGROUND
5-92.1Introduction 5
2.2Related Works 5-8
2.3Research Summary 8-9
2.4Scope of the Problem 9
2.5Challenges 9
v
©Daffodil International University
CHAPTER 3: RESEARCH METHODOLOGY
10-233.1Introduction 10
3.2 Data Collection Procedure 11-12
3.3 Research Subject and Instrumentation 12
3.3.1 Research Subject 12
3.3.2 Research Instrumentation 13
3.4.1 Proposed Methodology 14
3.4.2 Data Preprocessing 15-16
3.5Statistical Analysis 17-23
3.6 Implementation Requirements 23
CHAPTER 4: EXPERIMENTAL RESULT AND DISCUSSION
24-324.1Introduction 24
4.2Experimental Results 24-29
4.3Descriptive Analysis 30-31
4.4Summary 32
CHAPTER 5: IMPLEMENTATION
33-365.1Introduction 33
5.2Comparative studies 33
5.3Challenges 34
5.4Work schedule both for research and development 34
5.5Business process modelling 34-35
5.6 Future Scope 36
vi
©Daffodil International University
CHAPTER 6: SUMMARY AND CONCLUSION
37-386.1Summary of the study 37
6.2Conclusions 37-38
6.3Implication for Further Study 38
CONTRIBUTION FROM THIS R&D PROJECT
39REFERENCES
40-42APPENDIX
43PLAGARISM REPORT
44-48vii
©Daffodil International University
LIST OF TABLES
TABLES PAGE NO
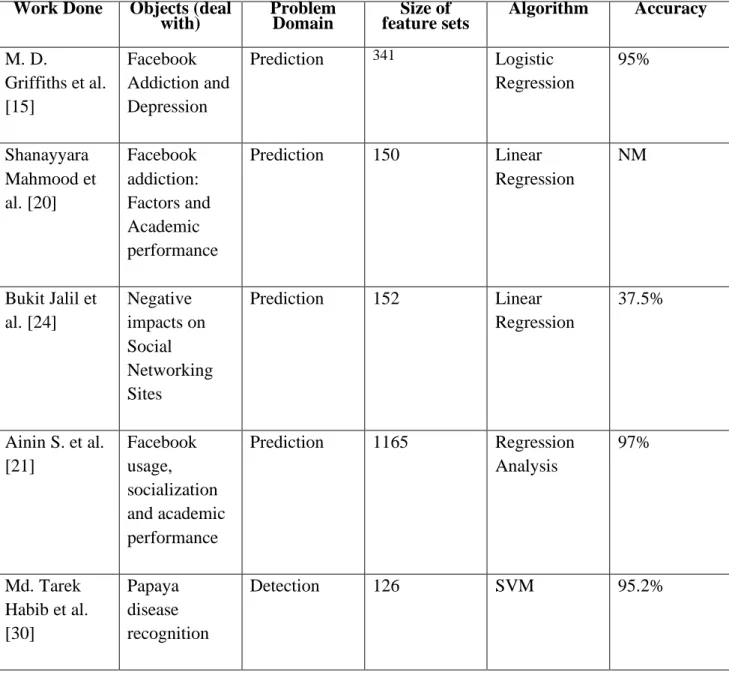
Table 2.1: Summary of Related Research Work 6
Table 3: Questionnaires of collected dataset 18
Table 4.1: Performance Study of Machine Learning Algorithms Before Using PCA 25 Table 4.2: Performance Study of Machine Learning Algorithms for Linear
Regression 25
Table 4.3: Performance Study of Machine Learning Algorithms After Using PCA 27
Table 4.5: Summary of Accuracy 29
viii
©Daffodil International University
LIST OF FIGURES
FIGURES PAGE NO
Figure 3.1.1: Proposed Methodology 13
Figure 3.3.2: Data Preprocessing 14
Figure 3.4.1: Statistical view of collected dataset 19
Figure 3.4.2: Statistical view of collected dataset 20
Figure 3.4.3: Statistical view of collected dataset 21
Figure 3.4.4: Statistical view of collected dataset 22
Figure 3.4.5: Statistical view of collected dataset 22
Figure 4.2.1: Performance Level of Machine Learning Algorithms 26 Figure 4.2.2: Performance Level of Machine Learning Algorithms 27
Figure 4.3.1: Addiction percentage according to gender 30
Figure 5.4.1: Gantt chart for Facebook addiction prediction system 34
Figure 5.5.2: Business process model 35
ix
©Daffodil International University
CHAPTER 1 Introduction
1.1 IntroductionFacebook is a marketing platform which continually evolving communication channel that gives the recent news coverage and insights. The following statistics highlight key relevant Facebook facts and can ultimately help you to navigate it better, increasing your return on investment (ROI) and leading to greater marketing success [1]. There are over 2.50 billion active users who uses monthly to December 2019. The users of Facebook are increasing day by day [1].
People log onto Facebook daily is 1.66 billion as an average and they are considered as daily active users. Comparing Facebook with other social media in Bangladesh is 96.3% people using Facebook and second most is YouTube which is probably not comparable [6]. The data is from 02, 2020 and 02, 2019 there was not as much differences between this 1-year data. In 02, 2019 it was 1.17% less than 02,2020 and second most was YouTube and which rate was 0.42% greater.
Women Facebook user is 26.2% and at the same time men user is 73.8% in Bangladesh [7]. And the age between 18-24 uses Facebook mostly and the rate is 46.3%. There are some symptoms when people are addicted with Facebook. Facebook fever is one of the most common diseases by Facebook addiction [5].
Different Machine Learning algorithms for example, k-Nearest Neighbors (kNN), Support Vector Machine (SVM), Decision Tree (DT), Naive Bayes (NB), Linear Regression (LR), Logistic Regression (LR), Linear Discriminant Analysis (LDA) are utilized for eminent and extricating valuable data from the clinical dataset with insignificant client inputs and efforts. Machine Learning is essentially the disclosure of learning from an immense measure of crude information.
Machine Learning is otherwise called subfield of information the executives [10]. Machine Learning has two primary models named as Predictive Model and Descriptive Model. The predictive model is characterized as a model that is made to tresses a specific result or result by utilizing prescient displaying systems [11].
In this research, by evaluating the dataset of Facebook Addiction, we suggested a Machine Learning (kNN) to predict the risk level using Facebook based on selected points. The
1
©Daffodil International University
projections of this technique will assist individuals to understand their addiction so that they can be conscious of it.
1.2 Motivation
The principle motivation of this research is to embellish a appropriate addiction analysis system with an increased list of capabilities. Mentally, the user needs to perform with different times to analyze a specific reason that requires a great deal of time and exertion. But our proposed system will extrapolate the addiction of Facebook with high exactness bringing about time and exertion decrease.
1.3 Rationale of the Study
The opportune discovery of Facebook Addiction can stop wasting of time. The fundamental issue is we can't distinguish or can't understand about addiction at beginning periods. For this situation, the Machine Learning method is a great system can identify addiction. On the off chance that we can distinguish addiction at the beginning period by various data mining techniques, we can diminish the rate of addiction.
2
©Daffodil International University
1.4 Research Questions
There are so many social media that have a serious effect on us, one of which is Facebook.
Most social media specialists observe that many times the majority of people may not conscious about addiction. These following questions arise when we thought to implement our idea -
• How to predict Facebook Addiction with higher accuracy?
• What will our original data be like?
• How to make people aware of their Facebook using?
• How to reduce addiction by Facebook?
• Does our data and machine learning will be compatible?
• Do we need to train our original data to the machine learning model?
• How to make people aware of their Social media life?
1.5 Expected Outcome
There are a lot of people who are very much unconscious about their Facebook Addiction. An addicted person is harmful to our society we should keep away from him. For this reason, they are suffering from various kinds of depression where Addiction is very common for people and in the long run, they are out from the real world but addicted with social media. If people are always monitored their spending time, they will be conscious of their addiction as a result of the addiction will be decreased. We can't provide any kind of support by our analysis but we can simply aware people change their lifestyle, by showing the predictive risk level of Facebook Addiction. There are some research has already done about Facebook addiction and risk prediction based on few numbers of features that’s why they don’t give us an accurate rate of risk of Facebook Addiction but in this research we analyze a lot of features like name, age, gender, spend time, status update anxiety, compare with real life, excessive time, add new friends, Facebook design, share personal life, check Facebook, share image, spending hours browsing, virtually date, fake id, Facebook Addiction, change mood, easiest way to contact, part of an exciting world, Facebook games, selfie post, food page, religious views, feel urge to use Facebook, forget personal problem etc. as a result we are able to show the risk of addiction with higher accuracy.
3
©Daffodil International University
Besides, the building of a large data set for Facebook addiction in the context of Bangladesh.
Publication of one or more articles in international conference proceedings or journals.
1.6 Report Layout
In this report, by evaluating the dataset of Facebook Addiction, we suggested a machine learning classification algorithm (kNN) to predict the risk level of addiction based on selected points. The projections of this technique will assist individuals to understand their addiction so that they can be conscious of it and if they encounter any problems, they will go to the social media consultants as quickly as possible as a consequence of decreasing the addiction rate. This report is divided into six parts. This is the first part where we're talking about our work motivation and the anticipated result. In the second chapter we address associated work, range of issues. We address the process and execution of information collection in the following chapter which is chapter three. Chapter four is for the results and evaluation of experiments. Chapter five discusses how we implement our proposed system. Lastly, chapter six represents the conclusion and future work.
4
©Daffodil International University
CHAPTER 2 Background
2.1 IntroductionIs Facebook a word coined to define a large amount of addiction in this social era? Classification algorithms for machine learning make predicting the addiction easier. In this social medium era, socialism is the main problem for everybody which is related with some social medium. Predicting the risk of addiction is simpler by using the classification algorithm in' Machine Learning.' The training and testing data belonging to distinct classes were classified using multiple method’s in' Machine Learning.' It seems vital to predict the risk of addiction through machine learning techniques in the addiction of Facebook. The purpose of this project is to assess distinct classification methods is the prediction of Facebook addiction. The number of data is provided to the people these days to find addiction. But using the method of ' Machine Learning ' can reduce it.
2.2 Related Works
Presently the primary concern is the prediction of Facebook addiction. By using various techniques in
“Machine Learning” such as k-Nearest Neighbors (kNN), Support Vector Machine (SVM), Decision Tree (DT), Naive Bayes (NB), Linear Regression (LR), Logistic Regression (LR), Linear Discriminant Analysis (LDA) we can easily predict the risk of Facebook addiction. Various studies have been done and increasingly more is going on in the prediction of addiction to get progressively accurate outcomes. For examining and prediction of addiction risk they have applied different data mining techniques used to predict addiction by various studies with their accuracy.
Table 1 shows the different data mining techniques used to predict Facebook addiction by various studies with their accuracy. The prediction of Facebook addiction through hazard factor classes is explained in [12]. In this work, four variables like age, sex, spending time and using time of the user are utilized to distinguish illness. The work of Mark D. Griffiths, M. A. Al Mamun [15]
proposed the classification techniques like logistic regression (95%) was received in this investigation.
5
©Daffodil International University
Table 2.1: Summary of Related Research Work Work Done Objects (deal
with) Problem
Domain Size of
feature sets Algorithm Accuracy M. D.
Griffiths et al.
[15]
Facebook Addiction and Depression
Prediction 341 Logistic
Regression
95%
Shanayyara Mahmood et al. [20]
Facebook addiction:
Factors and Academic performance
Prediction 150 Linear
Regression
NM
Bukit Jalil et al. [24]
Negative impacts on Social Networking Sites
Prediction 152 Linear
Regression
37.5%
Ainin S. et al.
[21]
Facebook usage, socialization and academic performance
Prediction 1165 Regression
Analysis
97%
Md. Tarek Habib et al.
[30]
Papaya disease recognition
Detection 126 SVM 95.2%
6
©Daffodil International University
The records with unessential information were expelled from the information distribution center before the mining procedure happens. According to paper [15] The association between Facebook addiction and depression Using Data Mining Techniques, M.A. Al Mamun, Mark D. Griffiths have utilized three data mining techniques. Extraction of concealed information from a recorded database, building and getting to models through DMX (Data Mining Extensions) inquiry language and capacities and the preparation and approval against a test dataset. Adequacy is represented by utilizing the Classification Matrix. The best model to anticipate users with some problems gives off an impression of being Logistic Regression pursued by Neural Networks and Decision Trees.
The work by Shanayyara Mahmood, Umar Farooq [20] Prediction of Facebook addiction using Classification Algorithms (SD and Linear Regression), an examination was performed for the expectation of Facebook addiction and connection with find the best system for conjecture.
6
©Daffodil International University
The work by Bukit Jalil [24] Study of Negative Effects of Social Networking Sites such as Facebook using Data Mining presents the various methods that are conveyed in the ongoing years for figuring the forecast rate in Facebook addiction. These methods incorporate Correlation, Regression and Coefficient of Determination and classification Algorithms. Facebook addiction prediction based on a weighted fuzzy rule explained in [14]. In this research, a hybrid algorithm involving the general mining approach, alongside the weighted credit technique is utilized to create fuzzy rules. Given the fuzzy rules, addiction is predicted/ anticipated. Ainin S, Naqshbandi M.M., Mogavvemi S. and Jaafar N.I. [21] checked how Facebook effects socialization and performance.
They demonstrated numerous insights and gave some thought about how the impact of Facebook usage on students’ academic performance. The results also illustrated that there is a positive relationship between students’ Academic Performance and Facebook usage i.e. the higher the usage the better they perceived they perform. They prescribe some future research, for example, input (antecedents), process (Facebook usage), output (i.e. the impact). By using regression analysis (RA), the percentage is (79%) of Facebook usage. They corelate it with the GPA and the accuracy was very high. The accuracy of expectation is about 90% and builds up an easy to use procedure. The work by Bukit Jalil [24] proposed the data mining procedures, for example k- Nearest Neighbors (kNN), Support Vector Machine (SVM), Decision Tree (DT), Naive Bayes (NB), Linear Regression (LR), Logistic Regression (LR), Linear Discriminant Analysis (LDA) to a huge amount of consideration data to predict the risk of a Facebook addiction.
7
©Daffodil International University
We have discovered that the existing systems depicted within the research papers have demonstrated fewer features than our proposed system, we used both public and some private datasets to these algorithms and we found the most noteworthy accuracy.
Md. Tarek Habib et al. [30] has done a study on Papaya disease recognition based on a machine learning classification technique. They used defective papayas color metaphors. They transformed all images into 300 x 300 pixels. Bicubic interpolation and histogram equalization were used for image processing. They used a total of 129 images of defective and defect-free in their model.
They divided their dataset into two parts, two-third as a training dataset and one-third as a testing dataset. They have used several machine learning classification techniques. The techniques are SVMs, C4.5, Naïve Bayes, Logistic Regression, kNN, Random Forest, BPN, CPN, and RIPPER.
They had worked with five common diseases in their work. Among these techniques, SVM has completed best. SVM has produced 95.2% accuracy among all classifiers.
2.3 Research Summary
There are a lot of people who are very much unconscious about their usage of Social media. For this reason, they are suffering from various kinds of social and mental problem and this is common and in long run, addiction, depression and mental problems are knocking at the door. If people are always monitored their usage of social media by using our prediction and analysis system, they will be conscious of their social media as a result of the addiction rate because addiction is decreased day by day. We can’t provide any kind of support by our research but we can simply aware people change their lifestyle by showing the predictive risk level of addiction. There are a lot of research has already done about Facebook addiction prediction based on few numbers of features that’s why they don’t give us an accurate rate of risk of Facebook addiction but in this research we analyze a lot of features like spend time, status update anxiety, compare with real life, excessive time, add new friends, Facebook design, share personal life, check Facebook, share image, spending hours browsing, virtually date, fake id, Facebook Addiction, change mood, easiest way to
8
©Daffodil International University
contact, part of an exciting world, Facebook games, selfie post, food page, religious views, feel urge to use Facebook, forget personal problem etc. as a result we are able to show the risk of Facebook addiction with higher accuracy.
2.4 Scope of the Problem
Facebook addiction is one of the common problems and unawareness about the time is the main reason. That’s why we decided to research Facebook addiction risk prediction so that by our system we can reduce the addiction rate. We proposed a system that gives people the predictive value of the risk of Facebook addiction so that people can aware about social media and their health. So, the scope of the present study is Facebook addiction prediction.
2.5 Challenges
Everything has its dark side. That’s why we faced a lot of difficulties to research and implement our system. Sometimes it was so tough to handle but by the grace of Almighty, we have passed these difficulties. These following difficulties made our research more difficult –
1. during data collection from social media 2. during the selection of algorithm
3. for applying machine learning classification algorithm 4. for implementing our proposed system
during the selection of external and internal factors of Facebook addiction
9
©Daffodil International University
CHAPTER 3 Research Methodology
3.1 Introduction
In this research, we are going to predict the risk of Facebook addiction by using seven machine learning algorithms such as k-Nearest Neighbors (kNN), Support Vector Machine (SVM), Decision Tree (DT), Naive Bayes (NB), Linear Regression (LR), Logistic Regression (LR), Linear Discriminant Analysis (LDA) because of its huge accuracy compared to other algorithms. For applying these algorithms, first of all, we had to collect datasets about external attributes of Facebook users. By studying research papers, we have already known that these seven machine learning techniques give more accuracy. Preprocessing of data is exhibited in an understandable introduction by transforming raw information into an accessible setting for a reason. Data cleaning is a procedure where information is cleaned by eliminating missing information, copy information and settling information irregularities. Subsequently, information quality is improved bringing about the helpfulness of information. Change of information or data starting with one organization then onto the next arrangement is known as data transformation. It is typically done when a source configuration is expected to change over into the required organization for a particular reason. It is basically the transformation of numeric or alphabetic advanced data into a revised arranged and rearranged structure tentatively or experimentally. The primary idea of information decrease is to diminish innumerable measures of information into helpful data. Features selection is likewise signified as factor determination, Attribute choice or variable subset choice for model development which hinders the way toward picking a subset of appropriate highlights (variable indicators).
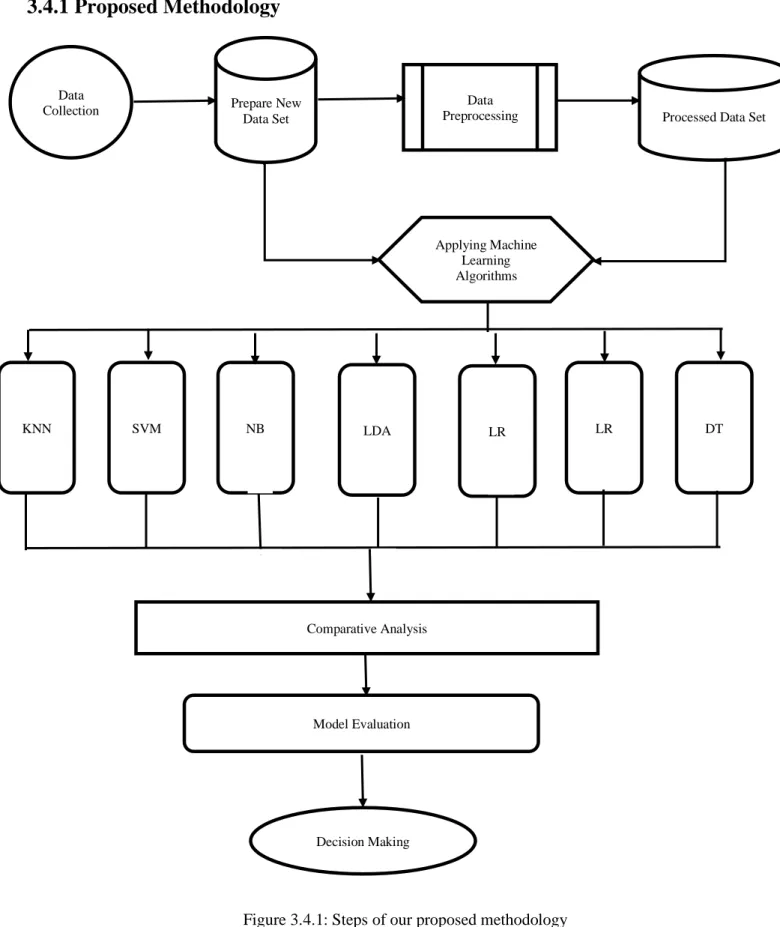
Figure 3.1.1 demonstrates the methodological framework to carry on this research.
10
©Daffodil International University
3.2 Data Collection Procedure
For completing our research, we need to collect data. We collected the data both online and offline.
We collected our necessary data from Facebook users of different schools, universities in Dhaka city which is called offline data collection. On the other hand, we made a google form to collect data from different people by distribution a link is called online data collection. We asked them our following questionnaires and we took the answers from them in the survey paper. According to this, we collected all the necessary data. We also collect data from past studies. For this reason, we had to gather a lot of research papers, journals, websites and report and then we combined these data and collected our necessary data to implement our idea. We collected our data based on the following factors:
• Age
• Gender
• Open Id
• Spending time
• Status update anxiety
• Excessive time
• Compare with Facebook life and real life
• Encouraging Facebook design
• Share personal life with others
• Check Facebook when it is possible
• Share image with others
• Spending hours
• Influenced to add new friends
• Attractiveness of Social life
• Virtually date
• Fake id
• Addiction to Facebook
• Changing mood
• Easiest way to contact
• Feel part of an expansive exciting world
• 11
©Daffodil International University
• Playing online games
• Picture uploading intention
• Attraction to food related pages
• Political and Religious views
• Forget personal problems
To identify the risk of becoming addicted to Facebook we have to consider each of these factors.
3.3 Research Subject and Instrumentation
We divide this section into two sub-sections so that it will be clear to all.
3.3.1 Research Subject
Facebook addiction is a wide word that includes many issues and conditions related to the socialism. A huge number of people faced the problem of addiction to Facebook because of unawareness about the social media usage. Their daily routine consists of about social media and they spend much time by using Facebook. That’s why in this current study we proposed a system which will give people the risk level of Facebook addiction based on machine learning classification algorithm so that people can aware about their daily life and conscious about social media. We can’t say that it will stop Facebook addiction but it will reduce the Facebook use time.
• 12
© Daffodil International University
3.3.2 Research Instrumentation
For collecting data, we designed a survey paper which included four general questions and 23 yes/no question. To get the expected result we distributed these survey papers to the Facebook and university students. We designed the survey paper that included the following questionnaires-
“name?”, “age?”, “gender?”, “spend time?” “status update anxiety?”, “compare with real life?”,
“excessive time?”, “add new friends? ”, “Facebook design?”, “share personal life?”, “check Facebook?”, “share image?” , “spending hours browsing?”, “virtually date?”, “fake id?”,
“Facebook Addiction?”, “change mood?”, “easiest way to contact?”, “part of an exciting world”?”,
“Facebook games?”, “selfie post?”, “food page?”, “religious views?”, “feel urge to use Facebook?”, “forget personal problem?”. At the same time, it is assumed that the data collected from Facebook users are legal and authorized.
Machine learning, Data mining algorithms are very prevalent for prediction and detection. We will apply our composed data to numerous algorithms to see which algorithms will perform well for our model. We use various algorithms; they are kNN, Support Vector Machine
(SVM), Linear Regression (LR), Decision Tree (DT), Logistic Regression (LR), Linear Discriminant Analysis (LDR), Naïve Bayes (NB). We used ‘Python’ as a programming
language and ‘Anaconda navigator’, ‘jupyter notebook’ as a data mining tool and ‘Microsoft Excel’ as our dataset in our research work.
13
©Daffodil International University
3.4.1 Proposed Methodology
Figure 3.4.1: Steps of our proposed methodology
14
©Daffodil International University
Processed Data Set Prepare New
Data Set
Data Preprocessing Data
Collection
Applying Machine Learning Algorithms
KNN SVM NB LDA LR LR DT
Comparative Analysis
Model Evaluation
Decision Making
F i g u r e 3 . 3 . 1 . 1 : S t e p s o f o u
3.4.2 Data preprocessing
After gathering the data, we get some missing data, categorical data, numerical and text data. Then we resolve that through data processing, we will type this data suitable for algorithms. Data processing is the capability to transform data into a suitable format after collecting data. Processing information or data in a specific format that helps to easily output.
Our data preprocessing method is shown below in Figure 3.4.2.
Figure 3.4.2: Steps of data preprocessing.
First, we underway the exertion of data cleaning. If there is a null value in the data set then encode the level that converts the text data to numerical data. We resolved the missing value problem using imputer and median. If there is a noisy value in the data set using a box, we can see that there was some noisy data in the numerical data. We analyze the correlation matrix as a data integration process. This matrix shows us the ratio of each data connected to each data and data is highly interrelated by a positive value and the negative value means that the data is negatively connected and zero indicates that the data does not connect to itself. We remove noisy values by using outlier quantile detection then drops our outcome feature, that
15
©Daffodil International University
Raw Dataset Null Value Check Label Encoding
Solving Null Value Problem
Solving Noisy Value
Problem
Check for Noisy Value Correlation
Analysis
Normalization Drop Outcome
Feature Processed Data
was, the addicted column. We generate a distinct histogram of each feature that helps us with data reduction and data visualization in feature engineering. By using normalization, we finalized the data transformation. Thus, we finally get the processed data set in our hands. This whole process of data processing was done using the “Jupyter Notebook” and “Anaconda navigator”.
16
©Daffodil International University
3.5 Statistical Analysis
After collecting data, we analyze and process these data in various steps. First of all, we have to preprocess these data. The collected dataset for this study is 1001 out of which 68.36% and 31.64% of males and females respectively. We then transform the dataset to extract missing and irregular data. Afterward, we selected external factors (associated with Facebook) to apply our selected algorithm through the collected dataset. By distributing questionnaires, we have collected our dataset and all questions’ outcome is shown in percentage in Figure 3.6.1.
The questionnaire designed for this research is shown in Table 3.1.
17
©Daffodil International University
Table 3.1: Questionnaires of collected dataset
Q1= What is your name? Q14= Do you influenced to add more friend?
Q2= How old are you?
Q15= Do you think offline social life is not as attractive as online social life?
Q3= Gender? Q16= Do you ever virtually date?
Q4= When you open your first? Q17= Do you have one or more fake id?
Q5= How much time you spend on Facebook every day?
Q18= Do you feel addiction to Facebook?
Q6= Do you have status update anxiety?
Q19=Facebook post can change your mood?
Q7= Do you have excessive time?
Q20=Do you think Facebook can make your contact with family in the easiest way?
Q8=Do you think real life and Facebook life are the
same? Q21=Do you feel part of an expansive Exciting world
by using Facebook?
Q9=Do you think, Facebook design encourages you to use it?
Q22=Do you play online games by Facebook?
Q23=Do you like to take selfie and post on Facebook?
Q10=Do you like to share your personal life with others?
Q24=Are you foodie and visit food related page, group on Facebook?
Q11=Do you check Facebook when it is possible?
Q25=Do you share your political and religious views on Facebook?
Q12=Do you like to share your image to others by
Facebook? Q26=Do you feel urge to use Facebook more and
more?
Q13=Do you spending hours browsing through Facebook every day?
Q27=Do you forget your personal problem When you browsing Facebook?
18
©Daffodil International University
Figure 3.6.1: Statistical view of collected dataset
Figure 3.6.1 represents the frequency of data set (in %) using two colors where the color blue points out ‘yes’ for our inquiry on the homepage and the other color which is orange that indicates
‘no’ for the same query. The following graph demonstrates that the percentage of status update anxiety is 31.67% whereas the percentage of who is not anxious about status is 68.33%, 60.43%
want to makes new friend, 43.65% people have excessive time, people who think real life and Facebook are same is 10.29%, the design of Facebook encourages 64.24% people, 22.18% people want to share their personal life with others, 83.12% people check Facebook when it is possible, 58.85% people share their own images with social media friends, spending hours by browsing Facebook is 64.44%, 34.07% people influenced to add more friends, the rate who think offline social life is not as attractive as online social life is 38.77%, 32.27% meet and make a relationship and also virtually date, 33.37% has one or more fake id by their own, 43.76% people admitted that they are addicted to Facebook, 55.54% people said Facebook can change their mood very easily, it is the easiest way to contact with family and friends says 57.04%, 55.44% think they feel part of an expensive exciting world by using Facebook, 48.75% people spend their time by playing Facebook games, 48.5% people take selfie and post it into Facebook, 62.54% people visit restaurant and food related pages and make their own post, 28.57% people share their religious and political opinion by using Facebook, 27.37% want to use Facebook more and forget personal problem when browsing Facebook and the rate is
19
©Daffodil International University
0 20 40 60 80 100 120
Q5 Q6 Q7 Q8 Q9 Q10 Q11 Q12 Q13 Q14 Q15 Q16 Q17 Q18 Q19 Q20 Q21 Q22 Q23 Q24 Q25 Q26 Q27 Yes No #REF! #REF!
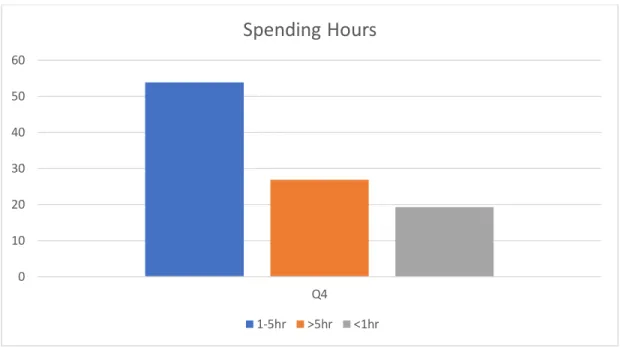
31.56%. In our collected dataset, 53.84% people using Facebook 1 to 5 hours daily but 26.88%
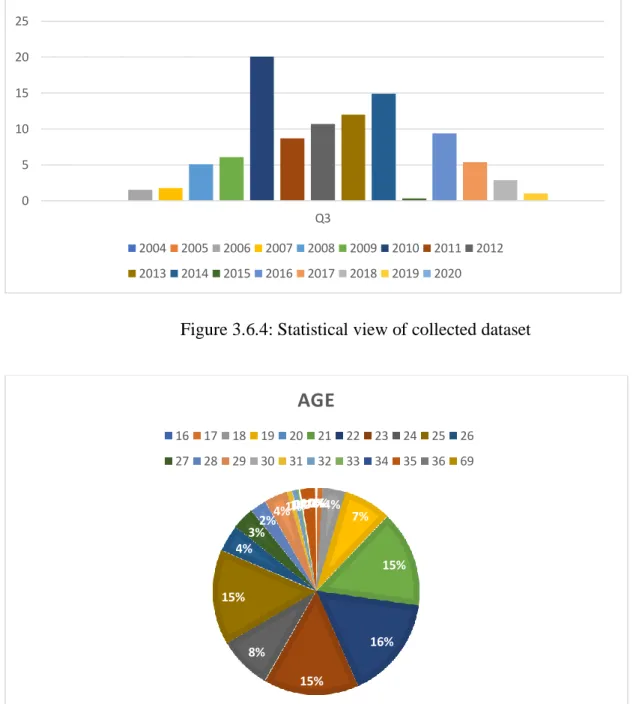
people using Facebook is more than 5 hours. Only 19.28% people using Facebook is less than 1 hour. There is another important information in our dataset. In the year 2010, 20.07% people open their Facebook account which year is higher than any year. 21- and 22-years older people using Facebook more than any other people and more addicted.
Figure 3.6.2: Statistical view of collected dataset
20
©Daffodil International University
0 10 20 30 40 50 60 70 80
Q2 Male Female
Figure 3.6.3: Statistical view of collected dataset
21
©Daffodil International University
0 10 20 30 40 50 60
Q4
Spending Hours
1-5hr >5hr <1hr
Figure 3.6.4: Statistical view of collected dataset
Figure 3.6.5: Statistical view of collected dataset
22
©Daffodil International University
0 5 10 15 20 25
Q3
Chart Title
2004 2005 2006 2007 2008 2009 2010 2011 2012 2013 2014 2015 2016 2017 2018 2019 2020
0%1%4%
7%
15%
16%
15%
8%
15%
4%
3%2%4%1%1%0%0%2%0%0%
AGE
16 17 18 19 20 21 22 23 24 25 26 27 28 29 30 31 32 33 34 35 36 69
3.6 Implementation Requirements
• Language: Python (Version: 3.7.0)
• IDE: PyCharm / Open source web application: Jupyter Notebook
• Library: Pandas (Data analysis)
• Library: Malplotlib (Data visualization)
• Library: Scikit learn (Machine learning)
• Fundamental package for computing: Numpy
• Microsoft Excel
• Microsoft Word
• Basic knowledge of computing
• Basic knowledge of python
23
© Daffodil International University
CHAPTER 4
Experimental Results and Discussion
4.1 Introduction
The authors developed a technique in this article to produce frequent itemset based on the user's indicators. It helps the people to know the risk level of Facebook addiction from the external factors. The results will assist experts to predict the risk level of addiction. The accuracies first identified before using PCA on the processed data, then calculate the accuracies after using PCA.
We used seven machine learning algorithms in which we had the k-Nearest Neighbors (kNN) as the best performer to get high accuracy.
4.2 Experimental Results & Analysis
We used seven machine-learning algorithms and compared them with each algorithm by calculating their accuracy, confusion matrix, precision, recall, f1-score.
4.2 Experimental Results
Our suggested system's primary objective is to predict the risk of Facebook addiction. Nowadays different machine learning approaches and data mining techniques make it simpler to predict addiction levels. We need to obtain information to apply these data mining methods and then we need to pre-process this information very closely. A total of 27 characteristics has been gathered.
The characteristics analyzed for this research are name, age, gender, spend time, status update anxiety, compare with real life, excessive time, add new friends, Facebook design, share personal life, check Facebook, share image, spending hours browsing, virtually date, fake id, Facebook Addiction, change mood, easiest way to contact, part of an exciting world, Facebook games, selfie post, food page, religious views, feel urge to use Facebook, forget personal problem etc. Then we used machine learning algorithms to estimate the addiction level. We accomplished distinct levels of precision after implementing seven machine learning classification algorithms. Table 4.1 and Figure 4.2.1 demonstrate the precision of our used algorithms.
24
©Daffodil International University
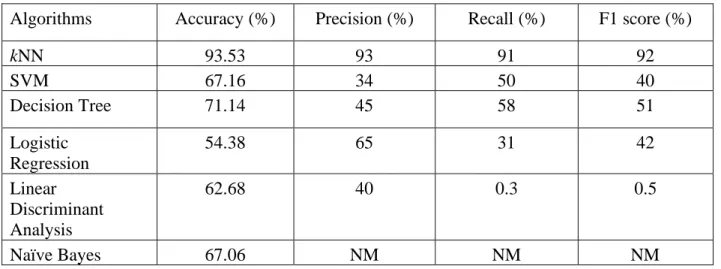
Table 4.1: Performance Study of Machine Learning Algorithms before using PCA
Algorithms Accuracy (%) Precision (%) Recall (%) F1 score (%)
kNN 93.53 93 91 92
SVM 67.16 34 50 40
Decision Tree 71.14 45 58 51
Logistic Regression
54.38 65 31 42
Linear Discriminant Analysis
62.68 40 0.3 0.5
Naïve Bayes 67.06 NM NM NM
Table 4.2: Performance Study of Machine Learning Algorithms before using PCA
Algorithm Mean Absolute Error Mean Squared Error Root Mean Squared
Error
Linear Regression 6.600262008951762e-16 7.026315550484442e-31 8.382312062005591e-16
25
©Daffodil International University
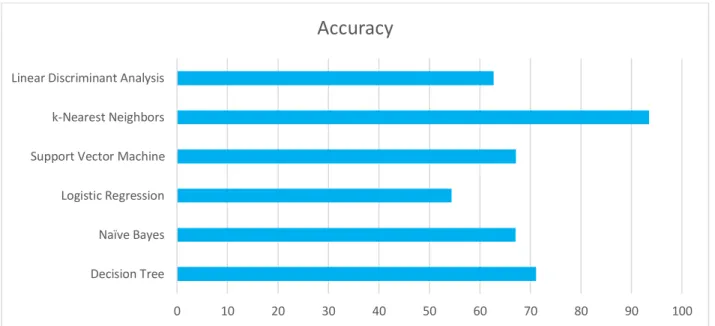
Figure 4.2.1: Performance Level of Machine Learning Algorithms
It is shown from the above Table and Graph that k-Nearest Neighbors (kNN) provides the greatest precision of 93.53%. We introduced our scheme with this algorithm because of its higher precision.
It analyses the performance of algorithms recall, precision, and F1 score. Based on this performance of algorithms and their accuracy performance, it will be determined which algorithm will appropriate for our model? It is shown based on the accuracy that k-nearest neighbors perform the best. Again, based on recall, precision, the k-nearest neighbors perform better. However, after performing unprocessed data and PCA, the k-nearest neighbors’ performance was also better than any other algorithm. So, considering everything, it is possible to get the best performance in the model using a k-nearest neighbors’ algorithm. And table 4.2 shown the error value of linear regression.
26
©Daffodil International University
0 10 20 30 40 50 60 70 80 90 100
Decision Tree Naïve Bayes Logistic Regression Support Vector Machine k-Nearest Neighbors Linear Discriminant Analysis
Accuracy
Table 4.3: Performance Study of Machine Learning Algorithms before using PCA
Algorithms Accuracy (%) Precision (%) Recall (%) F1 score (%)
kNN 88 90 64 85
SVM 67 67 100 80
Decision Tree 10.94 21 25 23
Logistic Regression
54 65 31 42
Linear Discriminant
Analysis
63 40 0.3 0.5
Naïve Bayes 63 NM NM NM
Figure 4.2.2: Performance Level of Machine Learning Algorithms
It is shown from the above Table and Graph that k-Nearest Neighbors (kNN) provides the greatest precision of 90%. We introduced our scheme with this algorithm because of its higher precision.
27
©Daffodil International University
0 10 20 30 40 50 60 70 80 90 100
Decision Tree Naïve Bayes Logistic Regression Support Vector Machine k-Nearest Neighbors Linear Discriminant Analysis
Accuracy
k-nearest neighbors (kNN) is a simple supervised machine-learning algorithm. Classification and regression problems can be explained with the kNN algorithm. kNN algorithm memorizes the training observation for classifying the hidden test data. kNN algorithm grabs similar things that exist in a close neighborhood [31].
Support vector machine is a supervised machine-learning algorithm. This also used for both classification and regression problems. Data objects are placed in n-dimensional space and the values of the features are presented the specific coordinate. It generates the most homogeneous points in each subsection that is why it is called hyperplane [31].
Logistic regression used logistic function and this Logistic function is called a sigmoid function.
An S-shaped curve takes the real values and put them between 0 to 1[31].
Naïve Bayes is one of the oldest algorithms of machine learning. This algorithm is based on Bayes theorem and basic statistics. Class Probabilities and conditional Probabilities are used in the Naive bias model. It extends attributes using Gaussian distribution [31].
Decision tree is a tree-based model. It distributing the features into the smaller section with similar response value using splitting rules. The divide-and-conquer method uses for making the tree diagram. Decision tree needs a small pre-processing and it can easily control the categorical features without preprocessing [31].
Linear regression tries to model the relationship between two variables by fitting a linear equation to observed data. One variable is considered to be an explanatory variable, and the other is considered to be a dependent variable [31].
LDA is a simple model in both preparation and application. It consists of statistical properties of your data, calculated for each class. That your data is Gaussian, that each variable is shaped like a bell curve when plotted. That each attribute has the same variance, that values of each variable vary around the mean by the same amount on average [31].
28
©Daffodil International University
TABLE 4.5: SUMMARY OF ACCURACY
Algorithms Accuracy before applying PCA
(%)
Accuracy after applying PCA
(%)
kNN 93.53 88
SVM 67.16 67
Logistic regression 54.38 54
Naïve Bayes 67.06 63
Decision tree 71.14 10.94
Linear Discriminant
Analysis
62.68 63
29
©Daffodil International University
4.3 Descriptive Analysis
Figure 4.3.1: Addiction percentage according to gender
For both males and females, the major cause is addiction. By analyzing our dataset, it is shown that female is highly addicted compare to male as shown in Figure 4.3.1 which also demonstrates that the percentage of male (43.71%) addiction is greater than the percentage of female (43.85%) addiction by Facebook. The primary cause of Facebook addiction is attraction to using Facebook, free time, attraction to eat various food etc. by our dataset. That's why we suggested a system/model in this article that allows individuals to understand their level of addiction for Facebook.
30
©Daffodil International University
Total People
Male Female
Total Male
Addicted Normal
Total Female
Addicted Normal
We not only calculated the accuracy of several algorithms but also calculated precision, recall, F1 score and confusion matrix of each algorithm. Classifications measured based on the test data set for better measurement. Precision is the measurement of exactness. It is the ratio of true positive value and predicted positive value. The recall is the measurement of completeness. It is the ratio of true positive value and true positive value. F1 score is the measurement of the harmonic mean of recall and precision. It considers both false positive and false negative values for calculation [30].
Precision is the measurement of exactness. It is the ratio of true positive value and predicted positive value.
𝑃𝑟𝑒𝑐𝑖𝑠𝑖𝑜𝑛 = (𝑇𝑃/𝑇𝑃 + 𝐹𝑃) × 100% (1)
Recall is the measurement of completeness. It is the ratio of true positive value and true positive value.
𝑅𝑒𝑐𝑎𝑙𝑙 = (𝑇𝑃 / 𝑇𝑃 + 𝐹𝑁) × 100% (2)
F1-score is the measurement of the harmonic mean of recall and precision. It considers both false positive and false negative values for calculation.
𝐹1 score = 2 x precision x recall
precision + recall (3)
Confusion matrix is one of the most important performances of measurement techniques for machine learning classification. It will perform on the classification models with the set of test data and provide the true positive value, true negative value, false-positive value, and false- negative value in a tabular format. The confusion matrix is very important for measuring the performance of any classifier [30].
31
©Daffodil International University
4.4 Summary
The primary motive of this project is to be conscious of their lifestyle by understanding the danger level of Facebook addiction and it will partly decrease the using rate. Our project is unable to provide any kind of suggestion. Suppose someone has enough free time and he spend all the free time by using Facebook. If he/she utilizes our scheme then he/she will be able to understand the amount of risk of Facebook addiction as a consequence he/she will be aware of the time of his / her that will protect individuals from Facebook addiction. For applying machine learning algorithms, data were gathered from social media and general writing it down. The other method of gathering information was from the university students. In such a way, an all-out 27 factors of about 1001 data were gathered. This gathered data were then arranged and organized proficiently in an Excel position. Exploiting this information, it tends to be exposed to various machine learning algorithms. From the data-set, twenty-one features are extricated. These credits are sustained into KNN, SVM, DT, Naive Bayes, LR, LoR, LDR grouping Algorithms in which KNN gave the best outcome with the highest accuracy which is shown in Table 3 Our proposed algorithms are observed to be better than the accuracy of other algorithms in the literature review. In light of the examination of the outcomes, it tends to be seen that the proposed models delivered sensible outcomes in arranging the conceivable addicting peoples. Execution of the proposed technique is contrasted with the leaving algorithms to build up the proficiency of the proposed method.
32
©Daffodil International University
CHAPTER 5 Implementation
5.1 Introduction
Using jupyter notebook, we created an easy strategy for predicting the addicted level of Facebook.
Several algorithms were using for this work and we make prototype for the work easier. Data from 1001 users and ordinary individuals have been analyzed and associated with some variables such as spending hours, want to make new friend, want to make statement about their opinion like religious and political views, status update anxiety, sharing life with others and the design of Facebook also encourages people to using it. Machine learning technology has been used to extract the information and a predictive score is produced.
5.2 Comparative studies
There are currently a few papers that can predict the addiction level of Facebook. Very few of them are popular and have some common characteristics at the same moment. There are also some distinctive characteristics in our paper that are distinct from other papers. At the same moment, before final step, a lengthy study has been performed which makes this research additional support to be as efficient as possible. This request is produced particularly for all kinds of individuals at the same time. From this perspective, this paper is unique in focusing more than others on the same field. The following screenshot demonstrates that there are few factors in this research in where we used some common information so that it will give you a better outcome than existing other papers. The following screenshot of the result/ algorithms which has been shown in Figure 5.4.1 and 5.5.1 has only two general information and factors. Based on this information we calculate the risk of addiction of Facebook accuracy. We calculate the accuracy both PCA and without PCA.
33
©Daffodil International University
5.3 Challenges
To fulfil our purpose, we antagonized several complications. Data collection and then implement data with seven different algorithms are the main challenge for us. We antagonized the following difficulties to create
a effective implementation:
• It was a large challenge for us to gather information and implement the algorithms.
5.4 Work schedule both for research and development
Figure 5.4.1: Gantt chart for Facebook addiction prediction system (Research Part) 5.5 Business process modelling
Business process modelling (or) process modelling is an analytical representation or merely an illustration of the company procedures of an organization. Modelling processes are a critical element for efficient leadership of business processes [4].
Figure 5.5.1 explains how user-specified information in Facebook addiction is calculated using an algorithm which produced the anticipated application-specific result. There will be some questionnaires provided to complete at first when the user opens our request.
34
©Daffodil International University
5-Mar-19 13-Jun-19 21-Sep-19 30-Dec-19 8-Apr-20 17-Jul-20
Literature Review Formulate Research Questions Formulate Research…
Survey Design Data Collection Data Preprocessing and…
Writing First Draft Writing Second Draft Writing Last Draft
Figure 5.5.1: Business Process Model
35
© Daffodil International University
5.6 Future Scope
We have suggested a scheme in this present research by which we can understand the predictive value of the risk level of Facebook addiction. We cannot afford any kind of support in this present research. But we will add some valuable message in the future that will help us for better result.
We're going to add another chapter where we're generating some information about the effect of Facebook and what effect on their life also.
36
©Daffodil International University
CHAPTER 6
Summary, Conclusion, and Implication for Further Research
6.1 Summary of the study
There is a lot of people who is not conscious about their addiction to Facebook. So that, they have to suffer from some different problems. There are many different problems heart problem is one of them. They are not aware of their heart health. Now a days, the death rate due to heart disease.
Some of them are overeating problem. Some of them cannot concentrate on their studies due to Facebook. People cannot properly use their time because Facebook kills their valuable time and energy. Some of them are suffering identity crisis. Facebook addiction lacks their personal emotion because they cannot properly use them because there is a lot of post and it cannot touch their heart.
6.2 Conclusions
There are so many addicted people that have a serious effect on us, one of which is Facebook addiction. Certainly, it is a common problem as we often hear that most individuals nowadays worry about this. Facebook remains the primary driver of addiction rate around the world. At the start of 2020, there are almost 4.5 billion active internet users and 3.8 billion are social media users [28]. Around 49% of internet users uses social media and the rate is very high [28]. From them 71% from Eastern Asia, 69% from North America and 67% from Southern America and Northern Europe. Middle Africa’s rate is only 6% and the rate is very much attractive [28]. There are 2.45 billion active users on Facebook and 1.62 billion daily active users [27]. The rate is higher compare to another platform [27]. When we see the global information then, there are 43% female users compare to 57% male users. India is the biggest Facebook market with 269 million active users and second best is US with 183 million [27]. In 2018, there are almost 2.27 billion users on Facebook but in 2019 it is 2.45 billion and comfortably the world largest social media platform.
In 2010 there were 550 million Facebook users but by the end of 2012 it was doubled and 1 billion [27]. From them, 88% users use Facebook to stay in contact with family and friends [26].
Wednesday and Thursday occur high traffic [26].
37
©Daffodil International University
For Bangladesh, according to BTRC 143 million phone users and from them 74% uses internet [29]. There are approximately 25-30 million Facebook users in Bangladesh. 72% male users compare to 28% female users [29]. Many of these users aged between 18 to 22 years old [29]. The rate is increasing day by day and addiction label is very high. In the future, the applied procedure can likewise be connected to ongoing data set and furthermore can be utilized with other techniques. This would bring about an increment of further accuracy and high geared. The implemented system is quite helpful to predict the risk of Facebook addiction.
6.3 Implication for Further Study
We have suggested a scheme in this present research by which we can understand the predictive value of the risk level of Facebook addiction. We cannot provide any kind of support in this present research. But in future we will do better result and higher accuracy. We're going to add another chapter where we're generating some information about the users. And, they will aware about their Facebook using.
38
©Daffodil International University
CONTRIBUTION FROM THIS R&D PROJECT
Contribution
:
1. International paper-1: Scopus & DBLP indexed
Md. Zahirul Islam, Ziniatul Jannat, “Prediction of Facebook Addiction Using Machine Learning Techniques”, Submitted to
Journal of ---, July 2020.
39
©Daffodil International University
REFERENCES
[1] Dan Noyes, “The Top 20 Valuable Facebook Statistics" Available at: https://zephoria.com/top-15- valuable-facebook-statistics/ [Accessed on April 2020]
[2] omnicoreagency.com. (2020). [online] Available at: https://www.omnicoreagency.com/facebook- statistics/ [Accessed on 22 April 2020].
[3] statista.com. (2020). [online] Available at: https://www.statista.com/statistics/264810/number-of- monthly-active-facebook-users-worldwide/ [Accessed on 30 April 2020].
[4] statista.com. (2019). Number of Facebook Users Worldwide 2015 to 2020 [online] Available at:
https://www.statista.com/statistics/490440/number-of-world-wide-facebook-users/ [Accessed 15 November 2019].
[5] theguardian.com, 2014. If Facebook is an infectious disease, here’s the guide to symptoms.
https://www.theguardian.com/commentisfree/2014/jan/23/facebook-infectious-disease- epidemiological-modelling-princeton, [Accessed on 23 January 2014].
[6] gs.statecounter.com. 2020. Social Media Stats Bangladesh. Available at:
https://gs.statcounter.com/social-media-stats/all/bangladesh, [Accessed on April 2020].
[7] napoleoncat.com. 2019. Facebook Users Bangladesh. Available at:
https://napoleoncat.com/stats/facebook-users-in-bangladesh/2019/01, [Accessed on January 2019].
[8] Zahirul, I, Ziniatul, J. (2020). “Dataset of: Facebook Addiction Prediction”
[9] analyticsvidhya.com. 2017. Commonly Used Machine Learning Algorithms. Available at:
https://www.analyticsvidhya.com/blog/2017/09/common-machine-learning-algorithms/, [Accessed on September 2017].
[10] sas.com, “Machine Learning, what it is and Why it is important?”, Available at:
https://www.sas.com/en_us/insights/analytics/machine-learning.html
[11] towardsdatascience.com. 2020. “Intuitive explanations of the most popular machine learning models”, Available at: https://towardsdatascience.com/all-machine-learning-models-explained-in-6-minutes- 9fe30ff6776a, [Accessed on 6 January 2020].
40
©Daffodil International University