My main focus of this work was to find out the factors that act as barriers to the successful implementation of technology in education. The global COVID-19 pandemic quickly demonstrated the importance of technology in education.
Background of the Study
This paper attempts to address the barriers and challenges faced by universities in Bangladesh in terms of technology adaptation and provide possible methods to overcome them for future improvement of the country's education system.
Statement of the Problem
Objectives of the Study
General Objective
Specific Objective
Explore the strengths and weaknesses of educational institutions in the context of aligning new technologies with their curriculum. Identify possible suggestions for avoiding obstacles or addressing implementation challenges.
Significance of the Study
Bangladesh should tend to adapt new forms of technology and enrich the educational standards with its help, which will further benefit the society as a whole.
Research Questions
This part of the research paper includes the literature review generated by mapping published articles, books as well as other recognized sources related to this research. Our previously generated research questions will also be answered using the literature review.
The Evolution of Technology in Education
In this section, readers are provided with an overview of the current status of research previously conducted on this specific topic. To get a new side of the tablet to write on, the wax was scraped off (Buck, 1989).
The Current State of Technology in Education
Modern Technologies in Education Today
The 5G network will allow us to connect our mobile phone to our laptop to access the Internet. Thanks to the tactile internet, playing musical instruments remotely becomes possible (Parvez et al., 2018).
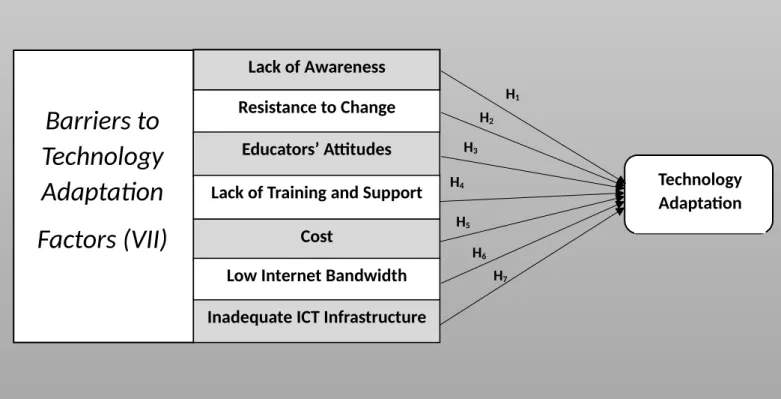
Factors Affecting The Adaptation of Technology in Education
- Independent Variables
- Dependent Variable
- Research Model
- Research Hypotheses
The Pedagogical Model – This model requires the AI system to be aware of the most efficient instructional methods. According to a survey by Khaled Mahmud and Khonika Gope on participants' desire to transform their learning environment using technology, 69% of respondents are not inclined to do so. The innovation and adoption classifications that Rogers discusses reveal the possible attitudes of the instructors (Rogers, Singhal, & Quinlan, 2014).
The availability of the necessary tools, the freedom to use them, and assistance via ongoing education are all necessary for creativity and exploration. The following are some of the possible barriers to the current diffusion and integration of technology in classrooms: resistance to change, teachers' attitudes, lack of training and support, the cost of integrating a new technology, low internet bandwidth and insufficient ICT infrastructure.
Chapter Summary
This chapter explains the research purpose, sampling methodology, sample size, sampling element, sampling technique, sampling location and sampling frame. This chapter also describes the research methodology, including the design of the questionnaires, their distribution and data collection methods that will be used in the research.
The Purpose of the Study and its Settings
Hypothesis testing is used in the study to describe the qualities of certain relationships as well as the correlational fluctuation between the independent and dependent variables.
Sample Design
- Sampling Frame and Sampling Location
- Sampling Element
- Sampling Technique
- Sample Size
In the probability sampling approach, a researcher uses certain characteristics and randomly selects individuals from a population. Using this sampling parameter, each member has an equal chance of being included in the sample. Non-probability sampling is seen to be significantly more effective than the other kind in cases of early phases of study or financial constraints on conducting research (QuestionPro, 2022).
In this research, we will use convenience sampling and snowball sampling as part of non-probability sampling. When gathering input is time and money limited, this non-probability sampling technique is used.
Research Instrument
- Questionnaire Survey
- Operationalization of Constructs
- Questionnaire Design
- Questionnaire Distribution and Data Collection
- Pilot Test
The survey questionnaire has also been adjusted to meet the study objectives based on the results of the literature review. A typical five-level Likert scale has been used to evaluate the responses of the respondents. The data are collected from a number of undergraduate students from Bangladesh studying in public or private universities.
The questionnaire has been developed using 'Google Form' and has been distributed to the students via email, messenger and WhatsApp. The questionnaire has been distributed to more than 300 students and we managed to collect 150 responses.
Chapter Summary
Independent variable lack of awareness 0.850 independent variable resistance to change 0.696 independent variable teacher's attitude 0.851 independent variable lack of training and support 0.750. The results of the reliability test given above conclude to be a good reliability for all the variables as the Cronbach's Alpha for each variable resulted to be greater than or equal to 0.7. By examining the seven main barriers believed to have a large and detrimental effect on technology adoption in education, this chapter demonstrates the study's findings.
In addition, multiple linear regression is a proven statistical technique for examining the standardized coefficient, beta, or direction of relationship, determining the significance level of the associations, and examining the variation among the components. This section discusses the descriptive analysis, the demographic profile of the respondents, the exploratory factor analysis of the independent and dependent variables, the normality test and the outcome of the data, the evaluation of the four hypotheses using multiple regression and correlation, the result of four hypotheses, and the conclusions of the research .
Descriptive Analysis
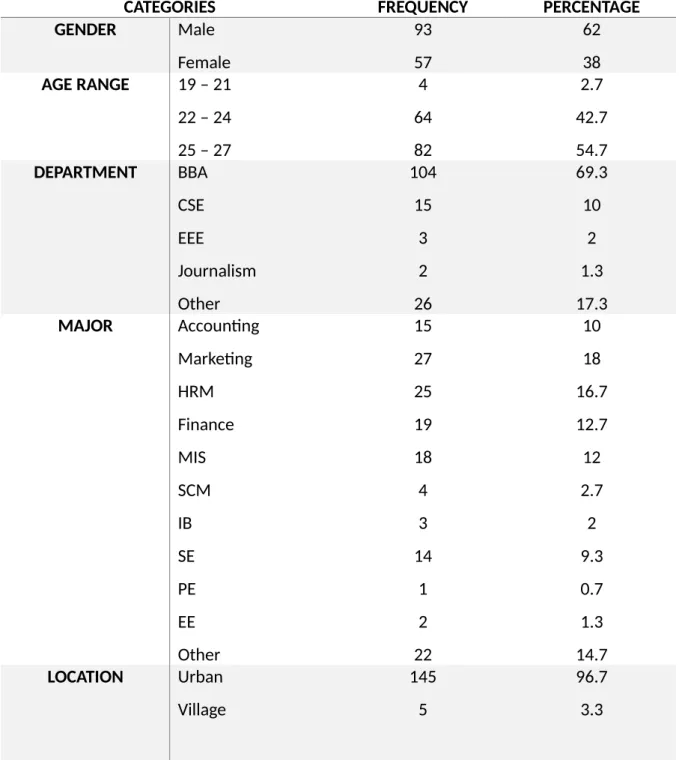
The Demographics of the Respondents
It is quite clear that the percentage of Business majors would be higher as 69.3 percent of the respondents belong to the BBA department. The results of the study show that the majority of graduate students are from urban areas with a percentage of 96.7.
The Dependent and Independent Variables
The lowest mean value of the item – Lack.of.TandS04 (most curricula are written with technology-driven teaching methods in mind) is 3.06. The lowest average value of the item – Cost02 (An appropriate amount of funding is allocated for the training facilities) is 3.17. The lowest mean value of the item – Low.Int.Band02 (I have never had any internet problem while giving online exams) is 2.26.
The lowest mean value of the item – Inad.ICT.Infra03 (There are enough computers at the university for all students) is 2.83. The lowest mean value of the item – Tech.Adapt09 (Wi-Fi access at my university is excellent) is 2.88.
Analysis of the Measures
Item - Inad.ICT.Infra05 (The University provided me with an official email address) has the highest average score of 4.13. For the dependent variable Technological Adaptation, the total mean score is 35.15, and the mean value is 3.515, which indicates the majority of the selected respondents. Item – Tech.Adapt06 (Using technology in education increases my productivity) has the highest mean score of 4.15.
The standard deviation is within a slightly larger range of the mean score and ranges between 0.865 and 1.347. This is consistent with the fact that all measurement variables were made using well-established instruments from previous research.
Testing Hypothesis
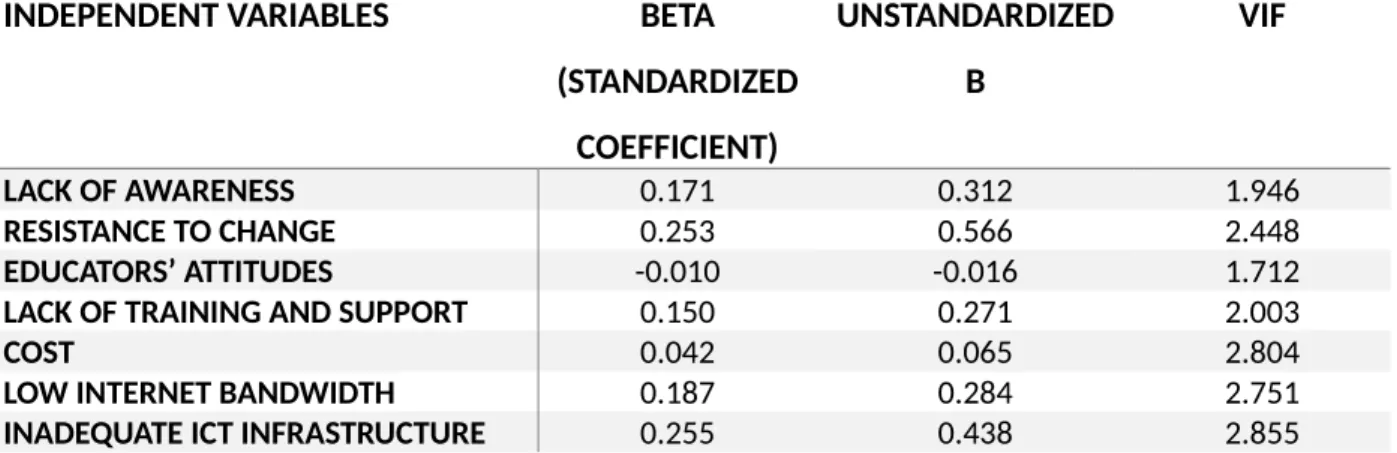
Regression Analysis
On the other hand, for every 1 unit increase in the standard deviation of that variable, there is a 0.010 decrease in the dependent variable. On the other hand, for every 1 unit increase in the standard deviation of that variable, there is a 0.150 increase in the dependent variable. On the other hand, for every 1 unit increase in the standard deviation of that variable, there is a 0.042 increase in the dependent variable.
On the other hand, for every 1 unit increase in the standard deviation of this variable, there is an increase of 0.187 in the dependent variable. On the other hand, for every 1 unit increase in the standard deviation of this variable, there is an increase of 0.255 in the dependent variable.
Chapter Summary
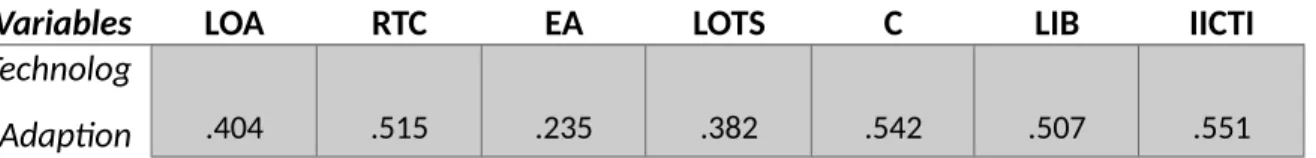
According to P Schobar, the traditional method of interpreting correlation coefficients considers correlation coefficient values between variables that range from having negligible correlation between them to having weak correlation to having moderate correlation to having strong correlation; and to have a very strong correlation (Schober, Boer, Schwarte, & Analgesia, 2018). All inter-correlation ratios in the table above are significant at the 0.01 level or at the 99% confidence interval, giving more precise results. Looking at the correlation coefficient values, we can identify that the variables 'Educators' attitudes' and 'Lack of training and support' have a weak correlation with 'Technology adaptation'.
Discussion
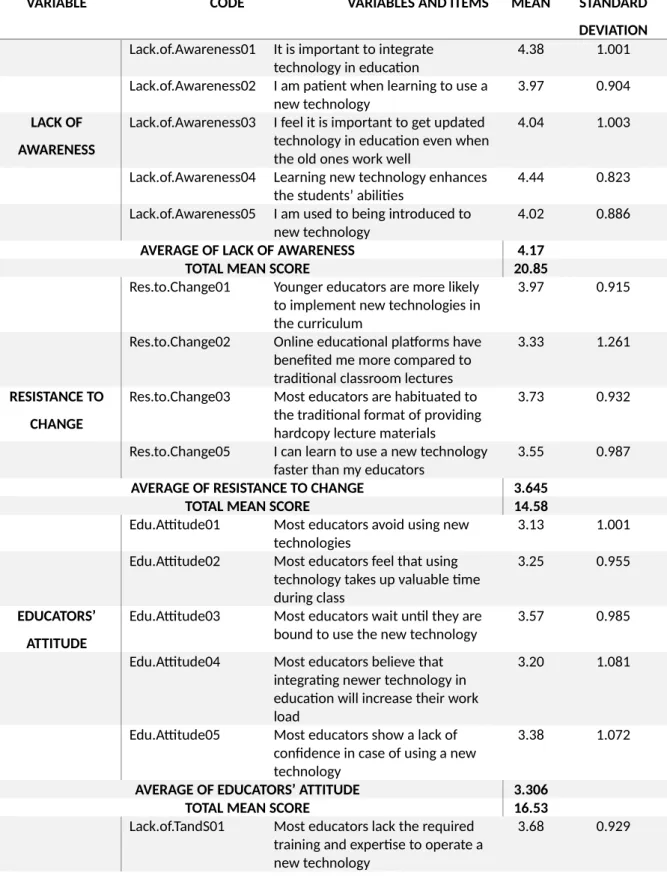
The item – Lack.of.Awareness04 (Learning new technologies improves students' skills), with the highest mean score of 4.44 within the variable 'lack of awareness', measures the strong relationship it has with technological adaptation . The item Res.to.Change01 (Younger teachers are more likely to implement new technologies in the curriculum) with the highest mean value of 3.97 within the variable 'resistance to change' highlights the fact that current students in Bangladesh feel that younger students Teachers contribute more to technologies implemented during sessions. The item – Lack.of.TandS01 (Most teachers lack the required training and expertise to work with a new technology), with the highest mean score of 3.68 within the variable 'lack of training and support', clearly indicates a of the most important problems.
The item – Cost01 (Adequate technical support is provided by my university), with the highest mean score of 3.36 within the 'cost variable' measures the strong relationship it has with technology adaptation. Another important record – Low.Int.Band05 (I have a reliable and cheap internet connection at home), with the highest mean score of 3.57 within the variable 'low internet bandwidth' shows the strength of the relationship this variable has with technology adaptation .
Limitation
Conclusion
A meta-analytic structural equation modeling approach to explain teachers' acceptance of digital technology in education. I think it's important to incorporate updated technology into education, even if the old ones work well. My university has adequate network coverage that allows students to work from anywhere in the university.
Teachers who use technology in teaching are considered more prestigious than those who do not.