CARDIOVASCULAR DISEASE PREDICTION USING DATA MINING BY
MOSAMMAT ROKEYA ANWAR TULI ID: 171-15-8925
TASMIM RAHMAN ID:171-15-9138
AND
SHUVAJIT SAHA ID: 171-15-8873
This Report Presented in Partial Fulfillment of the Requirements for the Degree of Bachelor of Science in Computer Science and Engineering
Supervised By Md. Sadekur Rahman
Assistant Professor Department of CSE
Daffodil International University Co-supervised by
Aniruddha Rakshit Senior Lecturer Department of CSE
Daffodil International University
DAFFODIL INTERNATIONAL UNIVERSITY DHAKA, BANGLADESH
JUNE 2021
APPROVAL
This Project titled “Cardiovascular Disease prediction using Data Mining”, submitted by Mosammat Rokeya Anwar Tuli, ID:171-15-8925 Tasmim Rahman, ID:171-15-9138 and Shuvajit saha, ID:171-15-8873 to the Department of Computer Science and Engineering, Daffodil International University, has been accepted as satisfactory for the partial fulfilment of the requirements for the degree of B.Sc. in Computer Science and Engineering and approved as to its style and contents. The presentation has been held on 3rd June,2021
BOARD OF EXAMINERS
Dr. Touhid Bhuiyan Chairman Professor and Head
Department of CSE
Faculty of Science & Information Technology Daffodil International University
Most. Hasna Hena Internal Examiner Assistant Professor
Department of Computer Science and Engineering Faculty of Science & Information Technology Daffodil International University
Internal Examiner Sumit Kumar Banshal
Senior Lecturer
Department of Computer Science and Engineering Faculty of Science & Information Technology Daffodil International University
Shah Md. Imran ExternalExaminer Industry Promotion Expert
LICT Project, ICT Division, Bangladesh
DECLARATION
We hereby declare that, this project has been done by us under the supervision of Md.
Sadekur Rahman, Assistant Professor, Department of CSE Daffodil International University. We also declare that neither this project nor any part of this project has been submitted elsewhere for award of any degree or diploma.
Supervised by:
Md. Sadekur Rahman Assistant Professor Department of CSE
Daffodil International University Co-Supervised by:
Aniruddha Rakshit Senior Lecturer Department of CSE
Daffodil International University Submitted By:
Mosammat Rokeya Anwar tuli ID: -171-15-8925
Department of CSE
Daffodil International University
Tasmim Rahman ID: -171-15-9138 Department of CSE
Daffodil International University Shuvajit Saha
ID: -171-15-8873 Department of CSE
Daffodil International University
ACKNOWLEDGEMENT
First we express our heartiest thanks and gratefulness to almighty Allah for His divine blessing makes us possible to complete the final year project/internship successfully.
We really grateful and wish our profound our indebtedness to Supervisor Md.
Sadekur Rahman, Assistant Professor Department of CSE Daffodil International University, Dhaka. Deep Knowledge & keen interest of our supervisor in the field of
“Mechine Learning” to carry out this project. His endless patience ,scholarly guidance ,continual encouragement , constant and energetic supervision, constructive criticism , valuable advice ,reading many inferior draft and correcting them at all stage have made it possible to complete this project.
We would like to express our heartiest gratitude to Prof. Dr. Touhid Bhuiyan, Head, Dept. of Computer Science & Engineering for his kind help to finish our project and also to other faculty member and the staff of CSE department of Daffodil International University.
We would like to thank our entire course mate in Daffodil International University, who took part in this discuss while completing the course work.
Finally, we must acknowledge with due respect the constant support and patients of our parents.
ABSTRACT
The word "cardiovascular disease" refers to any illness that affects the heart or blood vessels. It's normally linked to fatty deposits in the arteries (atherosclerosis) and an elevated chance of blood clots. When this happens, a blood clot will occur on the plaque, obstructing blood flow. Heart disorder is exacerbated by elevated blood pressure, high cholesterol, and smoke. Diabetes, as well as a variety of other medical problems and lifestyle habits, may increase one's risk of heart failure. We have collected around 1200 dataset. The ever-increasing incidence of Cardiovascular Diseases (CVD) is a big problem for Bangladesh's health sector. The focus of this thesis was to find out how widespread CVD is in Bangladesh, as well as the socio - demographic and way of living factors that influence it. Our study is aimed on the estimation of cardiovascular disease. We developed few features to predict cardiovascular diseases patient's symptoms. We gathered our data from the heart foundation hospital, the peoples hospital, and the al insaf hospital with the assistance of certain doctors and coworkers.
We add our algorithm to the most appropriate ten features to forecast the disease.
Choose KNN, Logistic regression, Support Vector Machine, Decision Tree, Random Forest, and XGBoost algorithms to really get the best possible results for cardiovascular disease prediction. In the future, we intend to create a model based on this research paper to professionalism, researchers in this field, and random people in determining their heart condition in an efficient manner.
TABLE OF CONTENTS
CONTENTS PAGES
Board of Examiners I Declaration II Acknowledgement III Abstract IV
CHAPTER
CHAPTER 1:INTRODUCTION 1-3
1.1 Introduction 1
1.2 Motivation 1
1.3 Rational of Study 2
1.4 Research Questions 3
1.5 Expected Outcome 3
1.6 Report Layout 3
CHAPTER 2 :BACKGROUND STUDY 5-13
2.1 Introduction 52.2 Related Work 5
2.3 Comperative Analysis and Summary 8
2.4 Scope of the Problem 12
2.5 Challenges 13
CHAPTER 3:Research Methodology 14-24
3.1 Introduction 143.2 Data Collection Process 14
3.3 Research Subject and Instrumentation 15
3.4 Statistical Analysis 18
3.5 Implementation Requirements 24
3.6 Implementation Requirements 24
CHAPTER 4:EXPERIMENTAL RESULT AND DISCUSSION 25-28
4.1 Introduction 254.2 Experimental Results & Analysis 25
4.3 Comparative analysis 27
4.4 Discussion 28
CHAPTER 5:IMPACT ON SOCIETY, ENVIRONMENT AND SUSTAINABILITY 30-31
5.1 Impact On Society 305.2 Impact On Environment 30
5.3 Ethical Aspects 31
5.4 Sustainability Plan 31
CHAPTER 6:SUMMARY, CONCLUSION, RECOMMENDATION AND IMPLEMENNTATION FOR FUTURE RESEARCH 32-33
6.1 Summary of the study 326.2 Limitations and Conclusions 32
6.3 Implication for Further Study 33
REFERENCE 34
APPENDICES 35
PLAGIARISM REPORT 36-41
LIST OF FIGURES
FIGURE PAGE
Figure 3. 1Proposed Methodology 16 Figure 3. 2 Data Preprocessing 17 Figure 3. 3 Corelation Matrix 18 Figure 3. 4 Statistical view of collected dataset
18
Figure 3. 5 Percentage of adult and non adult people
19
Figure 3. 6 percentage of smoking and no smoking
19
Figure 3. 7 percentage of male and female
20
Figure 3. 8 percentage of diabetes and no disbetes
20
Figure 3. 9 percentage of physical activity
21
Figure 3. 10 percentage of alcoholic and affected
21
Figure 4. 1 Comparison between two method
28
LIST OF TABLES
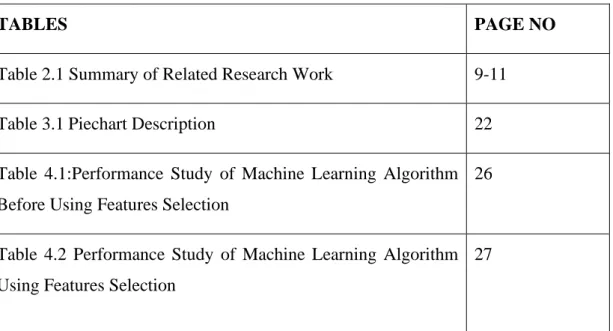
TABLES PAGE NO
Table 2.1 Summary of Related Research Work 9-11
Table 3.1Piechart Description 22
Table 4.1:Performance Study of Machine Learning Algorithm Before Using Features Selection
26
Table 4.2 Performance Study of Machine Learning Algorithm Using Features Selection
27
CHAPTER 1 Introduction 1.1 Introduction
In medical science history, cardiovascular disease has a very signification role for every medical sector and industry. There is a Vast amount of data on cardiovascular or heart disease in the medical sector. These data are very important for identify or give a treatment of people with heart disease. Unfortunately, maximum number of the data is not sorted to figure out a basic information in data. To find out the actual information in dataset of heart disease we can apply data mining advance technology. With this thesis paper, we will develop a model in future that will be helpful and obtainable to those who are working on and researching heart disease. This research paper will also help the random people using the model after developed. The features in this research will easily predict the heart condition of people in smart way. Cardiovascular prediction has been work on in the past; but not for random people for only those who work or research on it, by combining information from previous work and various knowledge and all latest information we vision to develop a paper and model with technology and digitalization. In cardiovascular disease prediction research paper we analyzed on heart disease problem with the help of data mining decision tree classification (DT), Random Forest Classifier (Rf), KNN, Support Vector Machine (SVM), Logistic Regression (LR), XGBoost(XG). Our aimed to identify and predict the disease of cardiovascular with the best accuracy applying those algorithms. In future we are develop a model base on CDP(cardiovascular heart prediction).
1.2 Motivation
The key goal of this study is to provide a heart disease prediction model that can be used to forecast the risk of heart disease. Furthermore, the aim of this research is to find the best classification algorithm for detecting the presence of heart disease in a patient.
The epidemic of heart failure is on the rise these days. According to a 2018 NICVD report, Bangladeshis have a 4.5 percent prevalence of cardiovascular disease, regardless of the form. People who live in cities have a higher prevalence rate, according to the report. The city dweller's lifestyle is toxic, and Dhaka's climate or weather is filthy,
exacerbating our heart ailments. Unknowingly, our numerous behaviors expose us to health threats, which manifest themselves first in our hearts.
The majority of people in our country are unconcerned with heart disease and do not consider it a priority. And if we sense anything strange in our hearts, we cannot take it seriously at the moment. Going to the doctor, seeking his diagnosis, taking medications, doing several examinations, and returning to the doctor are all activities that require time, which we are not generally willing to devote to our healthcare. In consideration of this, we attempted to conduct this study in a novel manner. In the future, we create a model based on the research paper so that the public can sit at home and see how their heart healthy. With the help of this research we want to make a healthy society, where the less people are faced heart disease problem. Our main aim is to figure out the heart condition of people in a simple and smart way by studying this subject and creating a model based on it. This paper and model assist cardiac surgeons, researchers, and average people in assessing how healthy their heart is or forecasting how risky it is.
1.3 Rational of Study
There are many work that done in this field previously. But in Bangladeshi perspectiove the work is not that much significant or they don’t get accuracy.As we know naïve bayes algorithm is good for prediction. And we have collected a large amount of data.A large of data prediction is a chellenge. The accuracy and other methods of the output.
Finding linearity is also a big thing.
1. How target variable will look?
2. In Bangladesh perspective medical data waste very much 3. How to use cheaper and more efficient model
4. As cardiac issue is the current trending issue
5. We have study all previous journals and found that there is an accuracy issue in previous studies
6. All the features previous studies shows are not mined properly
1.4 Research Questions
1. What is the target of this research?
2. Can we detect the disease by using this method at an early stage?
3. How to predict cardiovascular disease with high accuracy?
4. Does our data is appropriate for this work?
5. Does our algorithm is appropriate for this work?
1.5 Expected Outcome
We hope that our research will assist people in making predictions.
People can safely and quickly determine their risk of cardiovascular disease by using this strategy. Machine learning can also help people learn more about prediction.
Current or new machine learning algorithms for forecasting cardiovascular disease have been successfully deployed. One of the most serious diseases in our world is heart disease. We cannot deny the fact that heart disease is prevalent in our country.
We did not do many things in our everyday modern lives, which is bad for our well being. We are hooked to unhealthy ready-made meals, which have a high amount of preservatives and unhealthy ingredients. Such are the factors that have the most effect on our wellbeing. Whatever we eat or drink has an immediate impact on our hearts.
However, we can see the impact right away. It gradually deteriorates our organs. We need to aware our society about this issues which are make our heart slowly damage.
With the help of this research paper, we predict the cardiovascular effected people in our country easily and develop a model in future , which more easier for random people to find out their health condition.
1.6 Report Layout
The following is a list of the contents of this research paper:
a. Chapter one explains the introduction of the research with its motivation, rationale of the study, research questions, and expected outcome.
b. Chapter two discusses related works, research summary, the scope of the problem, and challenges.
c. Chapter three contains the workflow of this research, data collection procedure, and statistical analysis and feature implementation.
d. Chapter four covers experimental evaluation and some relevant discussions, the outcome of research via numerically and graphically.
e. Chapter five covers this research impact on society.
f. Chapter six contains a summary of this research work along with the limitation and future work.
CHAPTER 2 Background Study 2.1 Introduction
In this segment, previous relevant job summaries and challenges will be addressed. As a result, we've looked at a lot of research papers and other similar work to see which approach is best for our research and how effective it is. We'll also go into the difficulties that this area presents. As a result, we read a lot of research papers to learn more. In this section, we also look at which approach will be best and how accurate this work would be. We'll also discuss the complexity of the issue. We'll also provide some maps, graphs, and other visual aids to help you understand the subject better. The obstacle for this work will be included in the challenges art.
2.2 Related Work
We had studied many research papers to do this kind of research. Firstly we study the research paper and follow their work pattern then process those methods and apply them for our research. Here we are going to describe some of the important work The model proposed bySENTHILKUMAR MOHAN et al. (MOHAN, 2019)is based on machine learning, specifically data mining. They used a linear model and Hybrid Random Forest.K Nearest Neighbour(KNN), Decision Tree, Genetic Algorithm, and Nave Bayes are used.If we use two or more algorithm techniques, we refer to them as hybrid techniques. They use a Neural Network to measure heart rate as well. Seventy percent of the data is used for instruction, while thirty percent is used for classifications.
They use GA to Diagononsis their heart disease. They use the Cleveland dataset for experimental validation. Pulse rate, sex, age, and a variety of other factors are all taken into account. For detecting heart disease, an artificial neural network works well.
Accuracy HRFLM method 88.4%,Naïve bayes 75.8%,Support vector 86.1%,Decision tree 85%
The main goal of this study, according to Boshra Bahrami et al. (Bahrami, 2015) is to compare different classification techniques. They use the J48 Decision Tree, K Nearest Neighbour(KNN), Nave Bayes, and SMO to accomplish this. They use accuracy, precision, sensitivity, F-means, and the ROC curve to work. After putting all of those approaches to the test, they discovered that the J48 Decision Tree is the most efficient.
They used age, chest pain level, blood sugar, rest electro, and maximum heart rate to create the dataset. They gathered a total of 209 records for each feature. 83.73 percent of the time, the prediction is right.
Marjia Sultana et al (Sultana, 2016)clarified that they used Weka Software to run kstar, J48, SMO, Bayes Net, and Multilayer Perception. And the data collected is used to predict accuracy, ROC curve, and AUC value. SMO and Bayes Net provide the best results. The data collection came from UCI's machine learning repository. Age, sex, chest pain, resting blood pressure, fasting blood sugar, cholesterol, maximum heart rate, exercise, induced engine, and old peak are some of the characteristics. Kstar (75%), J48 (86%), SMO (89%), Bayes Net (87%), and MLP (75%) were among the medical data obtained (86 percent ). They obtained the information from Enam Medical College.
Sellappan Palaniappan et al. (Palaniappan , 2008)had also added that the main objective is an intelligent heart disease predictions system. For this, they use decision tree, Naïve Bayes, Data mining. IHDPS can discover and extract hidden data. It answers a complex question related to this work. They use the tabular and graphical form to enhance visualization. The neural network is three layer input hidden and output. IHDPS consists six major step: Buissness understanding, data unterstanding, data preparation, modeling, evalution and deployment. They collected 909 records and use 15 attributes.
IHDPS can be used to teach nurses and medical students how to diagnose heart disease patients. It can also help in decision-making. Naïve Bayes (47.58%) and Decision Trees (41.85%), Neural Network (85.68%) and Decision Trees (80.4%) to help doctors make informed clinical choices or at the very least have a "second opinion."
MUDASIR M KIRMANI et al. (KIRMANI, 2017) Tobacco use, an unhealthy lifestyle, obesity, physical inactivity, aging, and drug and alcohol abuse are only a few of the more common causes of cardiovascular disease. Hypertension, diabetes, hyperlipidemia, stress, and other illnesses are also high risk factors for cardiovascular disease. Using data mining-based methods, it is possible to make more accurate and effective predictions and diagnoses of heart diseases. We looked at a variety of methods, including decision trees and their variants, Naive Bayes, Neural Networks, and others.To name a few, there's the Support Vector Machine, Fuzzy Rules, Genetic Algorithms, and Ant Colony Optimization. The paper shows how data mining techniques and approaches can be used to provide reliable results for all forms of healthcare data, resulting in automated and accurate heart attack diagnosis and/or
prognosis. To improve efficiency, hybrid or integrated Data Mining techniques such as fusion of different classifiers, fusion of clustering with classification or association, and so on can be used. Finally, the experimentation was conducted on the UCI machine learning repository, and the findings in risk prediction demonstrated that the proposed clinical decision support system outperformed the network-based system significantly in terms of precision, sensitivity, and specifcity. Neural Network algorithm claiming 100% accuracywith 15 attributes which was only 99.25 in case of 13 medical attributes Mai Shouman et al. (Shouman, 2012)Nave Bayes, Decision Trees, Neural Networks, Kernel Density, and other data mining techniques are used in the diagnosis of heart disease.Automatically specified classes, a bagging algorithm, and a support vector machine with various levels of accuracies are shown. According to researchers, using data mining methods to find successful therapies for patients can help practitioners perform better. Researchers have been experimenting with various data mining methods in the diagnosis of heart disease to see which one can produce the most accurate results. Since they used different databases, the outcomes of different data mining studies cannot be compared. Over time, however, a de facto benchmark data collection has emerged.The Cleveland Heart Disease Dataset has appeared in the literature. Using a single data mining method, nave bayes [23] achieves the highest accuracy of 84.14 percent. However, hybrid data provided the most accurate results.89.01 percent of the time is spent mining.
ISTYAK AHAMED et al. (Ahamed, 2019) from Daffodil international university by senior lecturer saiful islam sir Some superior data mining techniques are used to use acceptable findings and make successful decisions on data, such as Logistic Regression, Decision Tree, Nave Bayes, and SVM. By We can predict the likelihood of cardiovascular disease using some characteristics such as age, gender, blood pressure, stress, and so on. They have used six different classifiers, with the Logistic Regression classifier providing the most accurate results (86.89 percent ). As compared to Logistic Regression, the other classifier generated similarly near and accurate results.A classifier is a device that categorizes objects As a result, we can conclude that using these types of data sets, logistic regression can have the highest precision for calculating the risk of cardiovascular disease.
R. Chitra et al. (Chitra, 2013)intelligent technique neural network is used for disease prediction. The MLFFNN with back propagation algorithm is proposed in papers discussed in this section. The main drawback of this system is training time and complexity. They use KNN, Artificial Neural Network (ANN), MLP with input neurons, fuzzy neuron expert system. The algorithms the applied Naïve Bayes 52.33%
609ms , Decision list 52% 719ms, K-NN 45.67% 1000ms. To of the time complexity, it is recommended that the neural network be trained offline. Only the most important attributes are extracted in the final model function subset collection to forecast correct results. The analyzed paper discusses data processing methods combined with intelligent and evolutionary computation. The accuracy of the method increased with the Feature subset collection, according to the results. However, the time complexity of this strategy is also high.
Navdeep Singh et al. (Singh)in this research paper they using hybrid technique and data mining algorithms to predict the heart disease. They applied nine algorithms to get the best result of heart prediction and take the data set in this paper with 303 records and 14 attributes. Different typs of algorithm came out different types of accuracy. The accuracy of Weighted Fuzzy Rules 57.85%, Logistics Regression 77% , Naïve Bayes 81.48%, Attribute Weighted Artificial Immune System 82.59% , Artificial Immune System 84.5% , Modified Artificial Immune System 87.43% , Neural Networks ensemble 89.01% , ANN_Fuzzy_HP 91.10% , GA_Fuzzy_Naive (Proposed) 97.14%.
In result , GA_Fuzzy_Naive algorithm give the best accuracy is 97.14% for this research study and Precision is 98%, recall is 97.14%
Hlaudi Daniel Masethe et al. (Masethe, 2014)predict the form that will be used
In this study, data mining algorithms such as J48, Nave Bayes and Bayes Net are used to forecast heart attacks. The study's findings indicate that prediction accuracy is 99 percent. The health sector will use data analysis to forecast trends in a dataset. They targeted on 12 attributes and five classifications and develop a model base on it. They predict 89 risk factor case. Highest accuracy came from simple cart accuracy is 99%.
2.3 Comperative Analysis and Summary
With the machine learning algorithm and data mining technique, some work has already been done on prediction and detection. The use of machine learning technology has grown in recent years, with applications such as alcohol user prediction, tobacco user detection, and more.and the identification of different diseases This section includes a comparison of these relevant works.
Currently, new technologies that combine machine learning, artificial intelligence, and deep learning are being investigated for use in some kind of prediction and detection model. Various machinelearning algorithms have recently been used to diagnose and detect content. Many algorithms, such as ANN, kNN, CNN, SVM, logistic regression, and others, are used.
For any detection model, this is a common option. According to previous study, the popularity and effectiveness of the kNN, SVM, random forest, ANN, nave Bayes, and Decision tree algorithms for prediction or detection models are strong.
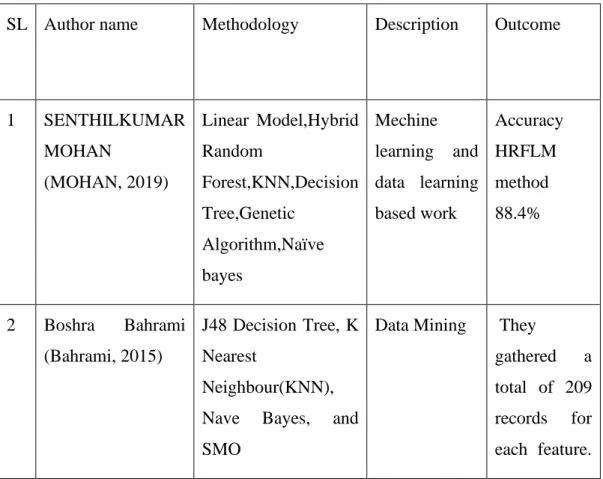
Table 2.1: Summary Of Related Research Work
SL Author name Methodology Description Outcome
1 SENTHILKUMAR
MOHAN
(MOHAN, 2019)
Linear Model,Hybrid Random
Forest,KNN,Decision Tree,Genetic
Algorithm,Naïve bayes
Mechine learning and data learning based work
Accuracy HRFLM method 88.4%
2 Boshra Bahrami (Bahrami, 2015)
J48 Decision Tree, K Nearest
Neighbour(KNN), Nave Bayes, and SMO
Data Mining They
gathered a total of 209 records for each feature.
83.73 percent of the time, the
prediction is right
3 Marjia Sultana (Sultana, 2016)
kstar, J48, SMO, Bayes Net, and Multilayer Perception decision tree, Naïve Bayes, Data mining.
IHDPS can discover and extract hidden data
decision tree, Naïve Bayes, Data mining.
IHDPS
Kstar (75%), J48 (86%), SMO (89%), Bayes Net (87%), and MLP (75%)
4 Sellappan Palaniappan
(Palaniappan , 2008)
decision tree, Naïve Bayes, Data mining.
IHDPS can discover and extract hidden data.
The neural network is three layer input hidden and output.
IHDPS
consists six major step
Naïve Bayes (47.58%) and Decision Trees (41.85%), Neural Network (85.68%) and Decision Trees (80.4%)
5 MUDASIR M
KIRMANI
(KIRMANI, 2017)
decision trees and their variants, Naive Bayes, Neural Networks
the Support Vector
Machine, Fuzzy Rules, Genetic Algorithms,
and Ant
Neural Network algorithm claiming 100%
accuracy
Colony Optimization
with 15
attributes which was only 99.25 in case of 13 medical attributes
6 Mai Shouman
(Shouman, 2012)
Naive Bayes, Decision Trees, Neural Networks, Kernel Density
Using a
single data mining method, nave bayes [23]
achieves the highest accuracy of 84.14 percent 7 ISTYAK (Ahamed,
2019)
Logistic Regression, Decision Tree, Nave Bayes, and SVM
Logistic Regression classifier providing the most
accurate results (86.89 percent 8 R. Chitra (Chitra,
2013)
KNN,Artificial neural network,MLP
Neural
network used for disease prediction Drawback is training time
Naïve bayes 52.33%
Decision tree 52%
KNN 45.67%
and
complexity
9 Navdeep Singh (Singh)
Nine algorithm 303 records 14 attribute
Hybrid
technique and data mining algorithm
Weight fuzzy rules 57.85%
Logistic regression 77%
Naïve bayes 81.84%
GA Fuzzy naïve best accuracy 97.14%
10 Hlaudi Daniel Masethe (Masethe, 2014)
J48,Naïve Bayes,Bayes Net
12 attribute 5
classification 89 risk factor
Accuracy 99%
Currently, new technologies that combine machine learning, artificial intelligence, and deep learning are being investigated for use in some kind of prediction and detection model. Various machinelearning algorithms have recently been used to diagnose and detect content. Many algorithms, such as ANN, kNN, CNN, SVM, logistic regression, and others, are used.
For any detection model, this is a common option. According to previous study, the popularity and effectiveness of the kNN, SVM, random forest, ANN, nave Bayes, and Decision tree algorithms for prediction or detection models are strong.
2.4 Scope of the Problem
Our research focuses on developing a model through data analysis and machine- learning algorithms. The probability of heart disease can be predicted using our proposed model. This prognosis would have a huge social effect.
Often hospital data sets are not adequately compiled or used, resulting in waste.
Collecting this information will allow us to build a model that will allow us to predict disease at home.
2.5 Challenges
We are having some difficulties while conducting our study. We found data collection to be extremely difficult. The first task in this study is to gather information on cardiovascular disease in Bangladesh. The data we used has been thoroughly pre- processed. In Bangladesh, on the other hand, finding this kind of dataset is very difficult. The data of the same patient is not held in a standardized manner.in every way The information is in an incomplete state. As a result of this type of data, inadequate or skewed training occurs, resulting in lower accuracy.
Since most patients with cardiovascular disease are only diagnosed at a late stage, the model is built with data that most patients can check without having to undergo any medical tests.
CHAPTER 3 Research Methodology
3.1 Introduction
The focus of this thesis is to develop a model for anticipating the onset of cardiovascular disease. The Prediction Model is built using data from people's daily lives as well as other similar data. To create this model, we have applied various machine-learning algorithms. We used kNN, logistic regression, SVM, decision tree, random forest, XGboost classifier in this research. Algorithms that were used in the model for classification. We used ten key factors that were all linked to addiction in some way.
We looked at some of the factors that contributed to the result. Prior to implantation, we processed our results. We computed three different forms and compared them. We calculated and computed the accuracy, sensitivity, specificity, precision, recall, F1 score of each algorithm to select the appropriate algorithm for the model. We also applied the algorithm for best accuracy with feature scaling and without feature scaling.
We get different type of accuracy for our research .We discovered that logistic regression has the highest precision and was the most appropriate for our proposed model.
3.2 Data Collection Process
The data set contains a large number of required and relatable coordinates that can be easily obtained and modified. We begin by attempting to locate heart patients in our neighborhood as well as many other locations. However, we also go much rural area to collect more data. The data of under poverty people is not too much but we collect few and we found so little amount to information about heart disease. Then we decided to go to the few institution and different profession people to know the range of cardiovascular disease affections. We also collect information from some private hospital and clinics. Some of those hospitals were in their privacy issues and they refused to give us information. we collect the maximum percentage of data from heart foundation hospital with the help of medical officer dr. Faisal ahmed and the rest of data we collect from Al-insaf and peoples hospital helped us with the information. We
may hear about even more critical factors from their experts and doctors in addition to supplying knowledge. We were unable to gather details when interviewing patients because hospital officials said that doing so would adversely affect the safety of the patients. As an outcome, we developed the form and gave it to them, and the hospital officials assisted us by contributing ideas from their patients. We were able to collect data of 1200 people based on 10 factors . We also collected our data from few private clinic, neighborhood, know person, peoples hospital, al-insaf and some other places and professions people like- labor, rickshaw puller, baggers and garments workers. Firstly we tell them about our work and when they are ready to cooperate, we ask them few questions frequently. First we ask them some genuine question about their heart related.
Like do they have any kind of heart pain, about their blood pressure, their daily routine?
Observing the following factors influenced how we gathered our data:
• Gender.
• Age.
• Weight.
• systolic blood pressure
• Diastolic blood pressure
• Smoke
• Alcoholic
• Physical activities
• Heart disease
We Should of these considerations must be considered when determining the likelihood of being a heart patient. We learned about these causes from different doctors.
3.3 Research Subject and Instrumentation
For any prediction or detection, machine learning algorithms, data mining, and deep learning are currently very common. We'll use our researchers will use descriptive different algorithms to see which ones would work well with our model. KNN, logistic regression, support vector machine (SVM), decision tree, random forest and Xgboosting classification are some of the machine-learning algorithms we use. In our
analysis, we used ‘python' as a programming language, as well as ‘Anaconda navigator,'
‘jupyter notebook' as a data extraction platform, and ‘Microsoft Excel' as a dataset.
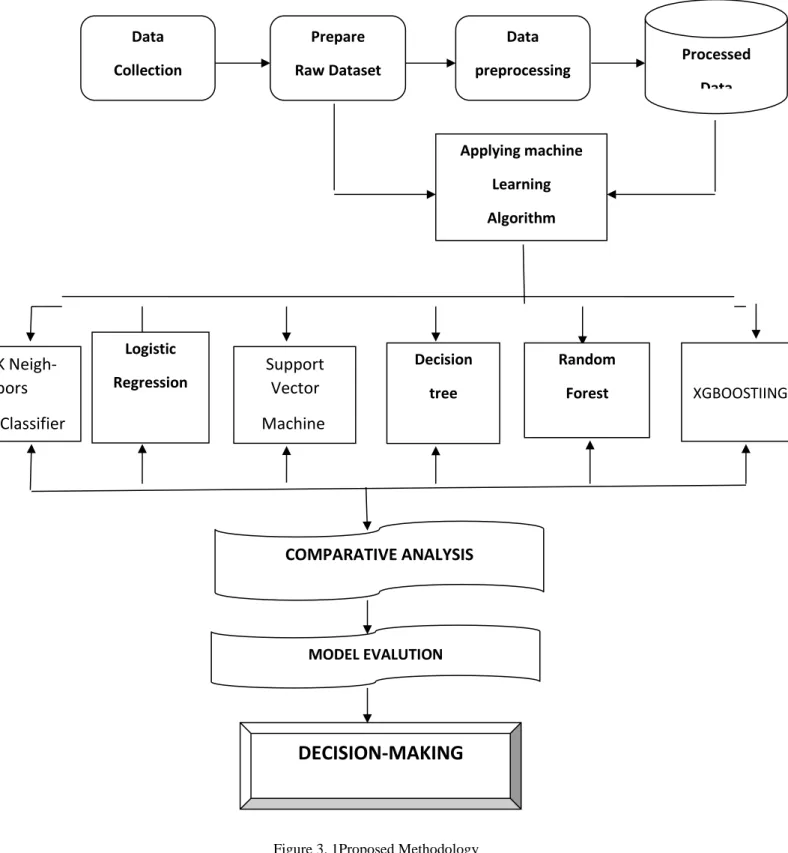
Figure 3. 1Proposed Methodology
Figure 3. 1Proposed Methodology Data
Collection Processed
Data
COMPARATIVE ANALYSIS
MODEL EVALUTION
DECISION-MAKING
Logistic Regression
Decision tree
Random
Forest XGBOOSTIING
Prepare Raw Dataset
Data preprocessing
Applying machine Learning Algorithm
Support Vector Machine K Neigh-
bors Classifier
We get some lost information, categorical data, numerical data, and textual data after we collect the data. Then we determine that by processing the data, we can make it perfect for algorithms. Data processing is the ability to convert data into an accessible format after it has been collected. Information or data is processed in a specific format to facilitate output.
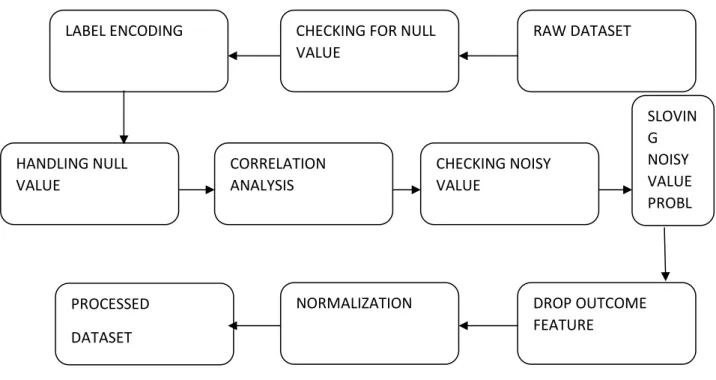
Figure 3. 2 Data Preprocessing
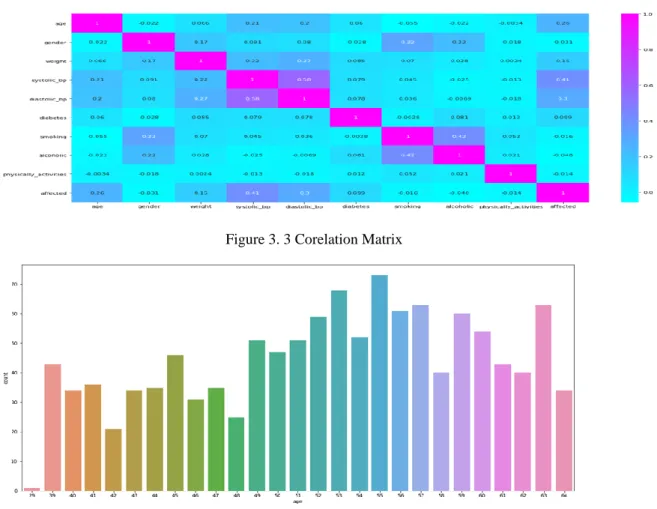
First, we began the data cleaning process. We look to see if the data set has any null values. The level is then encoded, which transforms the text data to numerical data. We used imputer and median to solve the missing value dilemma. So, using a box map, we see if there is a noisy value in the data set. We can see that the numerical data had some noisy data. We then ensure that the data set uses the box plot to show a noisy value. We can see here that the numerical data had certain noisy data. The association matrix is then analyzed as a method of data integration. This matrix displays the ratio of each linked data to each. The data is heavily correlated with a positive value and the negative value shows that the data is represented negatively and zero points to data not connecting with themselves. By using external quintile identification, we eliminate noisy values. We then reduce the alcoholic column on our results. We generate each feature with a different histogram, which lets us reduce data and view data in the feature design. We accomplished the data transition by standardization. We'll soon have data stored in our possession by the Daffodil International University. This entire data
LABEL ENCODING CHECKING FOR NULL
VALUE
RAW DATASET
HANDLING NULL VALUE
CORRELATION ANALYSIS
CHECKING NOISY VALUE
SLOVIN G NOISY VALUE PROBL EM
DROP OUTCOME FEATURE
NORMALIZATION PROCESSED
DATASET
collection process has been carried out using the ‘’Jupyter Notebook’’ and the
‘’Anaconda navigator’’.
3.4 Statistical Analysis
We have collected almost 1200 data.We mostly collected data from hospital.After collecting data, we have analyzed the dataset and statistical analysis of used dataset have given below using different kinds of graph.
Figure 3. 3 Corelation Matrix
Figure 3. 4 Statistical view of collected dataset
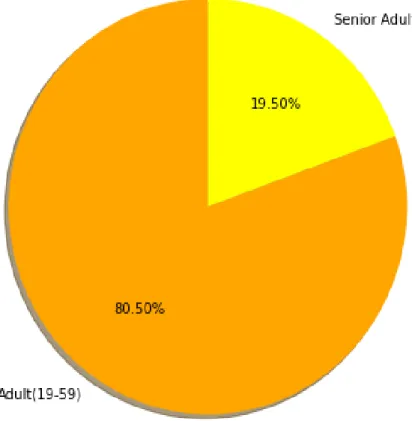
Figure 3. 5 Percentage of adult and non adult people
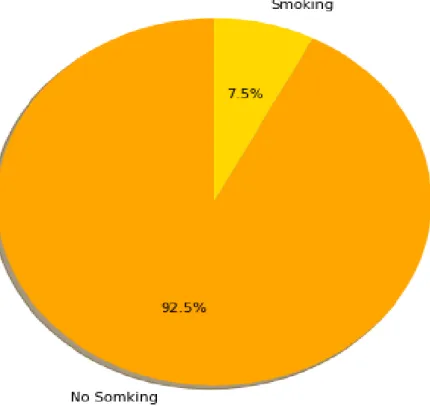
Figure 3. 6 percentage of smoking and no smoking
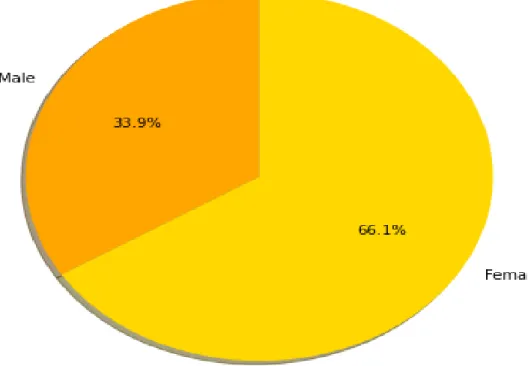
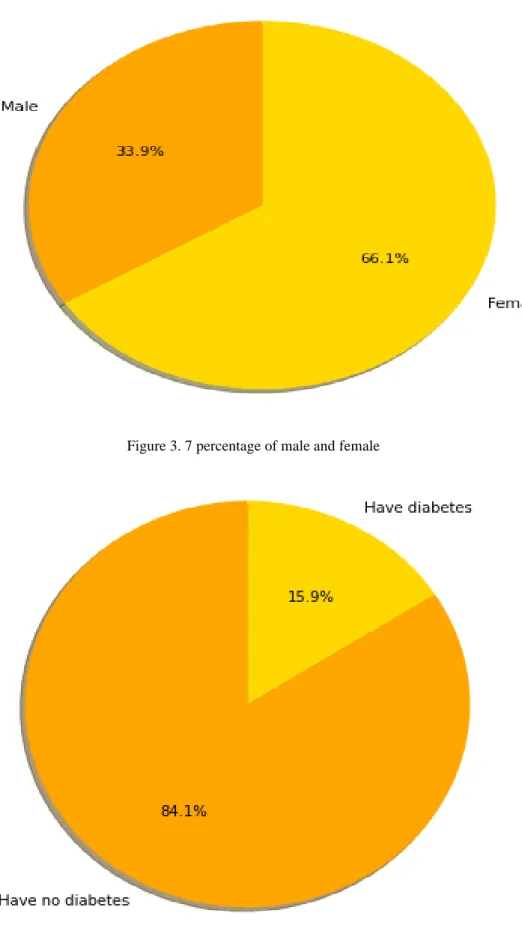
Figure 3. 7 percentage of male and female
Figure 3. 8 percentage of diabetes and no disbetes
Figure 3. 9 percentage of physical activity
Figure 3. 10 percentage of alcoholic and affected
Table 3. 1:Piechart description
Figure no Figure Name Description
3.5 Percentage of adult and not
adult people affected
That figure shows how many people affected from heart disease
That shows,adult affected from heart disease 80.50%
Senior adult whose age is above 60 affected from 19.50%
3.6 percentage of smoking and
no smoking
No smoking people 92.5%
and smoking 7.5%
3.7 percentage of male and
female
Male people affected from 33.9% and female affected from 66.1%
3.8 percentage of diabetes and
no diabetes
People who have diabetes affected from 15.9% and have no diabetes affected from 84.1%
3.9 percentage of physical
activities
Not involve in physical activity 19.4% and involved in physical activity 80.6%
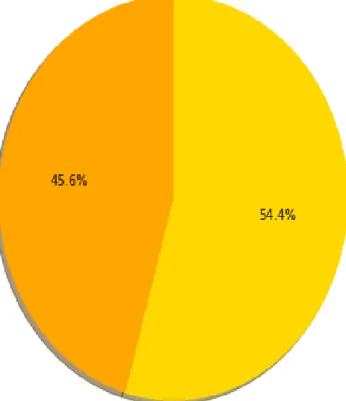
3.10 percentage of alcoholic
and affected
alcoholic and affected 45.6% and alcoholic but not affected 54.4%
First, we began the data cleaning process. We look to see if the data set has any null values. The level is then encoded, which transforms the text data to numerical data. We used imputer and median to solve the missing value dilemma. So, using a box map, we see if there is a noisy value in the data set. We can see that the numerical data had some noisy data. We then ensure that the data set uses the box plot to show a noisy value. We can see here that the numerical data had certain noisy data. The association matrix is then analyzed as a method of data integration. This matrix displays the ratio of each linked data to each. The data is heavily correlated with a positive value and the negative value shows that the data is represented negatively and zero points to data not connecting with themselves. By using external quintile identification, we eliminate noisy values. We then reduce the alcoholic column on our results. We generate each feature with a different histogram, which lets us reduce data and view data in the feature design. We accomplished the data transition by standardization. We'll soon have data stored in our possession by the Daffodil International University.
3.5 Implementation Requirements
To put our work into action, we need data mining tools, data processing tools, and data storage tools. We compile data using Google forms as well as handwritten forms. We used Microsoft Excel to build data sets. We used ‘’Jupyter notebook’’ and ‘’Anaconda Navigator’’ for data preprocessing and algorithm implementation.
Anaconda Navigator is a type of desktop graphical user interface. It enables users to install applications and anaconda bundles, as well as environments and channels, without using a command-line interface. Anaconda provides comprehensive and open- source data science packages
3.6 Implementation Requirements
1) Python as language
2) IDE: PyCharm and Anaconda 3) Data analysis library: Pandas
4) Data visualization library: Matplotlib
5) Machine learning library: Scikit learn
6) Fundamental package for computing: Numpy 7) Microsoft Excel
8) Microsoft Word
CHAPTER 4
Experimental Result And Discussion 4.1 Introduction
We covered the dataset and dataset retrieval processes in the previous segment. A few other algorithms use the processed data, and the outcomes of the algorithm will be addressed in this segment. kNN, logistic regression, support vector machine (SVM), , decision tree, random forest, and XGboosting all of these algorithms are used and The data were evaluated to determine which algorithm has the highest level of accuracy.
There To measure accuracy, there are three stages. The accuracies are first diagnosed before PCA on the processed data, then estimated after PCA, and eventually calculated using the algorithm on the unprocessed data. We gather 1200 data points from both addicted and non-addicted people, of which 80% is used for teaching and 20% for testing. The dataset is called ‘cardiovascular disease prediction.
4.2 Experimental Results & Analysis
We compared six machine-learning algorithms by measuring accuracy, confusion matrix, precision, recall, F1 ranking, sensitivity, and specificity for each algorithm.
Experimental Evaluation
On processed datasets with a feature count of 10, we ran six machine-learning algorithms. The PCA is then used. The acronym PCA stands for principal component analysis. It is a type of feature extraction approach that uses orthogonal linear projections to capture the underlying variance of results. PCA is used in the circumstance of dimensionality reduction. The dimensionality of Daffodil International University the model refers to the independent variable that is used in the model. Using a PCA, the number of variables can be minimized and only the most relevant variables are used for the next task. It usually blends strongly correlated variables to create a small artificial number of variables . The accuracy of six algorithms is depicted in Figure 4.1. prior to using PCA, it’s seems Logistic regression has achieved 73.33%
accuracy, SVM has achieved 72.92% accuracy, XGBoost has 72.91% accuracy,
Random Forest has achieved 70.42%, K Neighbors Classification has achieved 70.41%
accuracy and Decision Tree Classifier has achieved 63.75% accuracy.
Table 4.1:Performance Study of Machine Learning Algorithm Before Using Features Selection
Classifier Accuracy Precis
ion
Recall F1-score
Logistic Regression
73.33% 80.32
%
72.34% 76.12%
Support Vector Machine
72.92% 85.04
%
70.13% 76.89%
XGBoost 72.91% 79.53
%
72.14% 75.66%
Random Forest
70.42% 77.95
%
69.72% 73.61%
K Neighbors Classifier
70.41% 79.52
%
69.18% 73.99%
Decision Tree Classifier
63.75% 62.21
%
66.95% 64.49%
Comparing with other component, the most acceptable accuracy has given by logistic regression. Although, the percentage of accuracy is not more that precision and F1- score but we always follow the accuracy. In table 4.1. we clearly detect that support vector machine has the most precision value. SVM give the best performance in precision in this algorithm performance not using feature selection. Recall is get the maximum percentage from logistic regression and F1-score best in SVM. The best perforrmance of this component not came from the same algorithm. From the accuracy its came from logistic algorithm. And this the most acceptable value of our research performance of study without feature selection.
Table 4.2: Performance Study of Machine Learning Algorithm Using Features Selection
Classifier Accuracy Precisi on
Recall F1-score
Logistic Regression
75.00% 81.89% 73.76% 77.61%
Support Vector Machine
73.75% 85.83
%
70.78% 77.58%
XGBoost 67.92% 72.44% 68.66% 70.50%
Random Forest
68.34% 74.02% 68.62% 71.21%
K
Neighbors Classifier
72.50% 82.68% 70.47% 76.09%
Decision Tree Classifier
64.17% 69.29% 65.19% 67.18%
4.3 Comparative analysis
In table 4.2 logistic regression has the best accuracy using feature select like in table 4.1 without feature selection. Table 4.1 the maximum accuracy is given by logistic regression without using features selection. For precision, support vector machine algorithm is 85.83% which it the most value of it. Recall and F1-score get the highest percentage on logistic regression algorithm using feature selection
Figure 4. 1 Comparison between two method
In this comparison chart, orange lines define the accuracy of six algorithm with using features selection and blue line define the accuracy of algorithms without features selection. For Logistic Regression algorithm the accuracy without feature scaling is 73.33% and with feature scaling is 75%. In Support Vector Machine (SVM) algorithm the accuracy without feature scaling is 72.92% and with feature scaling is 73.75%. For XGBoost algorithm the accuracy without feature scaling is 72.91% and with feature scaling is 62.92%. For random forest algorithm the accuracy without feature scaling is 70.42% and with feature scaling is 68.34%. For KNN algorithm the accuracy without feature scaling is 70.41% and with feature scaling is 72.5%. And For Decision Tree Classifier algorithm the accuracy without feature scaling is 63.75 % and with feature scaling is 64.17%.
4.4 Discussion
The accuracy, sensitivity, specificity, recall, precision and F1 score are all discussed in this chapter. The function and formulas of evolution models are also covered. The logistic regression algorithm, with an accuracy of 75 percent with feature scaling, seems to be the most accurate. The logistic regression algorithm had accuracy with out of 73.33 percent, a precision of 80.32 percent, a recall of 72.34 percent, and an F1 score of 76.12 percent. Comparing with rest of algorithms, support vector machine (SVM),
XGBoost, random forest, K neighbors classifier and decision tree finally we found that logistic regression has the best accuracy. Second best accuracy is support vector machine (SVM), third one is XGBoost table 4.3. We discover that our cardiovascular prediction modeling model performs well when we use the logistic regression algorithm
CHAPTER 5
Impact on society, Environment and Sustainability 5.1 Impact On Society
Information related High-normal blood pressure with the risk of cardiovascular disease (systolic pressure of 130 to 139 mm hg, diastolic pressure of 85 to 89 mm hg or both).
We survey organization between blood pressure category at base line and the case of cardiovascular disease on follow up among 6589 participants in the Framingham heart study who were primarily free of hypertension and cardiovascular disease.
High normal blood pressure is began with an increased risk of cardiovascular disease.
Our result focus on the need to determine whether lowering high normal blood pressure can lessen the risk of cardiovascular disease.
Cardiovascular disorders claimed the lives of 17.7 million people worldwide in 2015.1 By 2030, this figure is expected to reach 22 million. The rising prevalence of noncommunicable diseases (NCDs) is putting pressure on healthcare systems and businesses around the world, particularly when combined with an aging population.
5.2 Impact On Environment
16% of the early cardiovascular death rate in men and 22% in occupationally very active women is not rid of through discover in the work environment. If inactive work is included in the occupational risk conditions the aetiological fractions reach 51% for men and 55% for women.
Taken differently the significant aetiological for cardiovascular risk conditions at work are consecutively (women in parentheses) 6% (14%) for boring high paced work 7%
(7%) for shift work and 2% (2%) for passive smoking.
Environmental factors that can damage the cardiovascular system and cause acute or chronic disease are discussed. Chemical, physical, biological, and psychosocial causes are all classified. Describes the environmental, physical, and biological elements that cause cardiovascular disease directly, such as nicotine and carbon monoxide (chemical); temperature and electricity (physical); and viral infections such as maternal
coxsackie (viral) (biological). Finally, the author emphasizes the need for more in-depth research on this subject.
5.3 Ethical Aspects
Four most important issues along with the scientific legality of investigation, risk benefit assessment, subject selection and sensibility and informed consent are developed and extensively discussed in the phrase.
Legal core considerations of prevention investigation of CVD on Herbal medicine include particular attention on the scientific legality of research, risk benefit assessment, subject choice, and vulnerability and informed consent. These topics and considerations are keys, Through they must be altered to an individual research setting in which a Scientific study is proposed.
Simultaneously, it is important to consider the value of physicians engaging in research and providing their patients with the ability to do so. While some have argued that this violates a physician's fundamental duty to a patient, we agree that in the study environment, the patient's best interests can and must be protected.
5.4 Sustainability Plan
As the sustainable development Goals are compromised the CVD community approaches a critical juncture. Now is the time to use our proof-based science and support capacity to secure that health is at the heart of the forth coming UN Global Development Agenda. As members of the CVD community, we must lift our collective voices on behalf of the Countless patients we serve, the relict we hope to create and the population at large. We call on government to ensure a strong focus on health NCDs and the other areas critical to global prevention and control of CVD and stroke. It is only through these hard work and efforts that human development will be realized and sustainable.
CHAPTER 6
Summary, Conclusion, Recommendation and Implemenntation for Future Research
6.1 Summary of the study
Data collection, data preprocessing, methodology implementation, and experimental assessment are only a few of the sections of our work. We gathered all of the necessary information.
Mukti Clinic and Brain & Mind Hospital provided data for this study. Both heart disease infected and healthy people were studied. We do data analysis and implementation using Anaconda Navigator after data collection. We run six machine-learning algorithms after preprocessing, including KNN, Logistic regression, Support Vector Machine, XG Boost, Random Forest, K Neighbors Classifier, Decision Tree Classifier, and others. It's worth noting that the logistic regression produces some interesting results.
As a result, the likelihood of being infected with heart disease must be predicted using the logistic regression algorithm.
6.2 Limitations and Conclusions
Our research focuses on data mining algorithms that have been infected by heart disease prediction systems. Our work and model have some flaws and limitations. We used a relatively small data set; a larger and more diverse data set would have been preferable.
People from various occupations, districts, and classes were unable to collect data due to some limitations. For data processing, a variety of advanced methods could be used, and the model could be beautifully presented using various variations of algorithm implementation.
It is possible to predict the likelihood of heart disease using our proposed model. I hope that once this model is completely developed, it will be very simple for ordinary people to use it.
Will be able to comprehend the significance of this model in raising knowledge. It is important to maintain vigilance at all times in order to escape the horrors of heart failure and infection.
Individuals.
If a person does not take appropriate precautions at the outset, they may eventually come into contact with heart disease and become infected with heart disease, making it difficult to prevent infection. We hope that by using this model, people will be able to avoid being afflicted with coronary heart disease and will be more mindful of their condition and in control of themselves.
6.3 Implication for Further Study
Technology and modern science have made our lives simpler and more convenient in recent years. We hope to incorporate our concept into a program, web application, or Android application in the future, as our country continues to embrace information technology and the internet. With a wider database, we will be able to improve our model's accuracy in the future. Furthermore, the model's software can be accessed by building user-friendly GUIs.
to the general public The model can be made more successful in the future by introducing new algorithms, adding different parameters, and adding more functionality. A comprehensive database can be generated in the future by collecting data from various categories of citizens according to the district. The model can also be expanded and advanced with the aid of the Department of Disease Control.
Reference
Ahamed, I. (2019). Cardiovascular Disease Risk Prediction Using Data Mining Techniques.
Dhaka,Bangladesh: Daffodil International University.
Bahrami, B. (2015). Prediction and Diagnosis of Heart Disease by Data Mining Techniques.
Journal of Multidisciplinary Engineering Science and Technology (JMEST), 2(2), 3159- 0040.
Chitra, R. (2013). REVIEW OF HEART DISEASE PREDICTION SYSTEM USING DATA MINING AND HYBRID INTELLIGENT TECHNIQUES. ICTACT JOURNAL ON SOFT COMPUTING, 3(4), 2229-6956.
KIRMANI, M. (2017). Cardiovascular Disease Prediction Using Data Mining Techniques: A Review. ORIENTAL JOURNAL OF COMPUTER SCIENCE & TECHNOLOGY, 10(2), 520- 528.
Masethe, H. D. (2014). Prediction of Heart Disease using Classification Algorithms. World Congress on Engineering and Computer Science. San Francisco, USA.
MOHAN, S. (2019). Effective Heart Disease Prediction Using Hybrid Machine Learning Techniques. IEEE Access, 7(pp), 81542-81554.
Palaniappan , S. (2008). Intelligent heart disease prediction system using data mining techniques. 2008 IEEE/ACS International Conference on Computer Systems and Applications. Doha, Qatar.
Shouman, M. (2012). Using data mining techniques in heart disease diagnosis and treatment. 2012 Japan-Egypt Conference on Electronics, Communications and Computers. Alexandria, Egypt.
Singh, N. (n.d.). Heart Disease Prediction System using Hybrid Technique of Data Mining Algorithm. International Journal of Advance Research, Ideas and Innovations in Technology, 4(2), 2454-132X.
Sultana, M. (2016). Analysis of data mining techniques for heart disease prediction. 3rd International Conference on Electrical Engineering and Information Communication Technology (ICEEICT). Dhaka, Bangladesh.
APPENDICES
Abbreviation k-NN = k-nearest neighbors SVM = Support Vector Machine
XGBoost =eXtreme Gradient Boosting Appendix:
Reflections on the Research, we knew very little about machine learning and artificial intelligence detection and prediction when we started this research paper. Our supervisor was very helpful and sincere. He provided us with valuable suggestions and was very supportive. He always provides us with adequate guidance at any stage of our study work. He still provides us with adequate guidance at any stage of our study work.
We are entirely ignorant of certain aspects, but our supervisor never gives up on us and continues to introduce us to new methods and technology. During the course of our research, we studied a number of new methods, including how to acquire skills, implement algorithms, and work with a variety of approaches. The Anaconda-navigator and Jupyter notebook, as well as the Python programming language, were both new to me.We had some challenges at first, but Anaconda-navigator, Jupyter notebook, and Python gradually became second nature to us.
Finally, by research, we have acquired information.
Plagiarism report
24
6 5 2
1 1 1
Cardiovascular
ORIGINALITY REPORT
%
SIMILARITY INDEX
21 %
INTERNET SOURCES
13 %
PUBLICATIONS
14 %
STUDENT PAPERS
PRIMARY SOURCES
dspace.daffodilvarsity.edu.bd:8080
Internet Source
%
Submitted to Daffodil International University
Student Paper
%
www.computerscijournal.org
Internet Source
%
4 William A. Zoghbi, Tony Duncan, Elliott Antman, Marcia Barbosa et al. "Sustainable Development Goals and the Future
of Cardiovascular Health", Global Heart, 2014
Publication
www.nejm.org
Internet Source
%
core.ac.uk
Internet Source
%
ictactjournals.in
Internet Source
%
8 Submitted to Korea National University of Transportation
Student Paper
1 2 3
5 6 7
1 %
1 %