32
Comparison of Distributed Data Mining for Selection of
the Proper Majors
Pelsri Ramadar N.S., S.Kom1, Hadiq, M.Kom2 STIKOM PGRI Banyuwangi
Jln. Ahmad Yani 80 Banyuwangi, telp/fax (0333) 417902 e-mail: [email protected], [email protected]
Abstract
The majors in STIKOM PGRI Banyuwangi are Artificial Intellegence, Software Engineering and Networking. The students have a different ability on IQ and talent, so the student must choose the majors according to their ability in the field of interest. Grades start from semester 1 until the semester 4 constitute basic ability to be a consideration in determining the right majors. To overcome this problem, this research uses classification technique, which is comparing several algorithms among others C4.5, Naïve Bayes, KNN, Random Forest, and SVM. This algorithm applies to build classification selection of the proper majors. Pairwise T-Test determine as an accuracy indicator to evaluate the performance of classifiers. Results showed that C4.5 seemed to be the best of five classifiers which had highest prediction result. C4.5 was used to generate data which can be used to classifying student majors in STIKOM PGRI Banyuwangi. And the results of the accuracy of other methods close to the results of the method C4.5.
Keywords: Data Mining, Classification Algorithm, Comparison, Proper Majors, STIKOM PGRI Banyuwangi
1. Introduction
STIKOM PGRI Banyuwangi is one of the university based computer in Banyuwangi. STIKOM has 2 department namely D3 Information Management and S1 Information Technology. There are 3 major option at S1 Information Technology which are AI/Citra (Artificial Intelligence), Software Engineering, and Networking. Students begin the semester 5 can choose this majors. Ideally, the selection of majors based on their interests, talents, and abilities of students, so that students are expected can be focus to this competition and succeed in completing their studies in a timely manner. One of the considerations for selecting students in determining the major is the GPA in the first semester to fourth semester in the form of a score or grades and test which is implemented by the academic authorities.
In some disciplines, graduates are required immediately, but others require a graduate to have strong knowledge and skills in their area of specialization. For instance, although graduates of the Department of Computer Science have obtained a bachelor‟s in computer science, some of them are not proficient enough in programming, data analysis, or networking analysis to find a place in the workforce. The above scenario applies to a high proportion of the disciplines at the university.
A number of algorithms are available in the areas of data mining, machine learning and pattern recognition for solving the same kind of problem. But there is a little guidance for suggesting algorithm to use which gives best results for the problem at hand. Nitin and Parag [11] shows an approach for solving this problem using meta-learning and uses three types of data characteristics. Simple, information theoretic, and statistical data characteristics are used. Results are generated using nine different algorithms on thirty-eight benchmark datasets from UCI repository. By using meta-learning, accurate method can be recommended as per the given data, and cognitive overload for applying each method, comparing with other methods and then selecting the suitable method for use can be reduced. Thus it helps in adaptive learning methods. The experimentation shows that predicted accuracies are matching with the actual accuracies for more than 90 % of the benchmark datasets used.
33
gives higher accuracy compare to other decision tree algorithm in single dataset. Random decision tree algorithm is applied on “Parul Institute student‟s” data sets of each having 1000 records. By this classification rules are generated in each node from training data sets. These rules are combined using Specific Classification Method to create Global model at central side. Now these rules are applied on test data sets at central side to predict student performance.Shaleena and Saiju [15] presented a classification method for prediction student performances in order to prevent or take precautions against student failures or dropouts. Decision tree classifiers are used here and methods for solving the class imbalance problem is also discussed. Several white box classification methods like decision trees and rule induction algorithms is been discussed. The problem of imbalanced data is solved by data rebalancing followed by cost sensitive classification. These methods give results more easy to understand as they can explain their predictions in a higher level in the form of IF-THEN rules. Thus it is very easy for a nonexpert data miner like a teacher to interpret the classification result.
Research in student retention is traditionally survey-based, where researchers use questionnaires to collect student data to analys and to develop student predictive model. The major issues with survey-based study are the potentially low response rates, time consuming and costly. Farhana, Thanassis, and Davis [4] describes a new student predictive model that uses commonly available external open data instead of traditional questionnaires/surveys to spot „at-risk‟ students. The results of empirical study for undergraduate students in their first year of study shows that this model can perform as well as or even out-perform traditional survey-based ones. The prediction performance of this study was also compared with that of logistic regression approach. The results show that neural network slightly improved the overall model accuracy however, according to the model sensitivity, it is suggested that logistic regression performs better for identifying „atrisk‟ students in their programme of study.
This research handle the problem of students selecting the appropriate major at the University of STIKOM PGRI Banyuwangi. The data are derived from 269 students who have completed the course are taken from the class of 2009 to 2011. Basis of their student performance during the first semester until fourth semester to classifying appropriate major, can improve and perform well for completing the lecture. The remainder of the paper is organized as follows: Section 2 presents related work, while Section 3 describes the result and analysis, Section 4 describes a summary of the research / conclusion.
2. Research Method 2.1. C4.5 Decision Tree
A decision tree consists of internal nodes that specify tests on individual input variables or attributes that split the data into smaller subsets, and a series of leaf nodes assigning a class to each of the observations in the resulting segments. For our study, we chose the popular decision tree classifier C4.5, which builds decision trees using the concept of information entropy [6]. The entropy of a sample S of classified observations is given by:
Entropy(S) = 𝑛𝑖=1
−
pi * Log2 pi………. ... (1)where p1(p0) are the proportions of the class values 1(0) in the sample S, respectively. C4.5 examines the normalized information gain (entropy difference) that results from choosing an attribute for splitting the data. The attribute with the highest normalized information gain is the one used to make the decision. The algorithm then recurs on the smaller subsets.
2.2. Naïve Bayes
Naive Bayes classifier is a probabilistic classifier based on applying Bayes' theorem with strong (naive) independence assumptions between the features. It is highly scalable, requiring a number of parameters linear in the number of variables (features/predictors) in a learning problem. Maximum-likelihood training can be done by evaluating a closed-form expression, which takes linear time.
P(c, x) = 𝑃(𝑥|𝑐)𝑃(𝑐)
34
2.3. K-NNThe k-nearest neighbor algorithm (k-NN) classifies a data point by taking a majority vote of its k most similar data points. The similarity measure used in this paper is the Euclidean distance between the two points:
d(xi, xj) = || xi, xj || =[( xi, xj )
T
(xi, xj)] ½
... (3)
2.4. Random Forest
Random forests are defined as a group of un-pruned classification or regression trees, trained on bootstrap samples of the training data using random feature selection in the process of tree generation. After a large number of trees have been generated, each tree votes for the most popular class. These trees voting procedures are collectively defined as random forests. For the Random Forests classification technique two parameters require tuning. These are the number of trees and the number of attributes used to grow each tree.
2.5. SVM
SVM algorithm was first developed in 1963 by Vapnik and Lerner. SVM [5] is a binary classifier based on supervised learning which gives better result than other classifiers. SVM classifies between two classes by constructing a hyperplane in high-dimensional feature space which can be used for classification. SVM is a classification algorithm, which is based on different kernel methods. SVM is classified in two groups.
Linear SVM: It is the simplest one, in which the training patterns are linearly separable. A linear function of the form is given below:
f(x) = wT X + b ... (4)
Such that for each training sample xi the function yields f(xi} 0 for yi = +1, and f(xi) < 0
for y,= -1. In other words, training samples of two different classes are separated by the hyperplane f(x) = wT X + b =0, where w is weight vector and normal to hyperplane, b is bias or threshold and xi is the data point.
Non-Linear SVM: In linear SVM straight line or hyperplane is used to distinguish between two classes. But data sets or data points are separated by drawing a straight line between two classes is not possible. In a nonlinear SVM classifier, a nonlinear operator is used to map the input pattern x into a higher dimensional space H. The nonlinear SVM classifier is defined as:
f(x) = WTФ(X) + b ... (5)
The data with linear separability may be analyzed with a hyperplane, and the linearly non-separable data are analyzed with different kernel functions like higher order polynomials and Quadratic.
3. Results and Analysis
In this section, it is explained the results of research and at the same time is given the comprehensive discussion. Results can be presented in figures, graphs, tables and others that make the reader understand easily [2] [5]. The discussion can be made in several sub-chapters.
3.1. Data Set
35
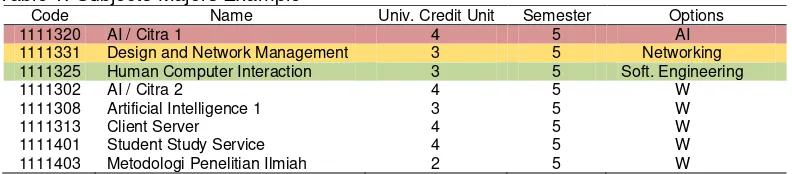
Table 1. Subjects Majors ExampleCode Name Univ. Credit Unit Semester Options
1111320 AI / Citra 1 4 5 AI
1111331 Design and Network Management 3 5 Networking
1111325 Human Computer Interaction 3 5 Soft. Engineering
1111302 below. The data set used in this study is the student data from STIKOM PGRI Banyuwangi from semesters 1 to 4 semesters of the class 2009 until 2011 who have completed the course. filter data used to retrieve the data students who score above 3.0 for each subject are given below in Table 3.
Table 2. Subjects From Semester 1 – 4
Code Resume Name Semester
1111201 MATH1 Mathematics 1 1
1111202 MATH2 Mathematics 2 2
1111203 STAT Statistics and Probability 3
1111204 IIE Introduction to Informatics Engineering 1
1111205 INST Installation and Maintenance 1
1111206 GRA1 Graphic 1 3
1111207 GRA2 Graphic 2 4
1111301 CITRA1 Citra 1 4
1111303 ALPR1 Algorithm Programming 1 1
1111304 ALPR2 Algorithm Programming 2 2
1111305 DS Data Structures 3
1111306 DAA Design Analysis and Algorithm 3
1111307 CRIPT Cryptography 4
1111309 OOP1 Object Oriented Programing 1 3
1111310 OOP2 Object Oriented Programing 2 4
1111311 BD Basic Database 1
1111312 ADB Advanced Database 2
1111314 ACO Architecture and Computer Organization 2
1111315 SEF Software Engineering Fundamental 3
1111316 SM Software Modeling 4
1111317 WD Web Design 2
1111318 WF Web Programing Fundamental 4
1111319 NF Network Fundamental 2
Table 3. Example of Student‟s Majors
Student ID Number MATH1 MATH2 STAT IIE … … GRAF2 Major Options
Majors are elected according to the ability of students in the field and existing interest, the goal for the courses that will be given to students in the 5th semester could be planned better in accordance with capability in the field of interest or competence. The design of the algorithms used to obtain results in accordance with the purpose of research is shown in the diagram above.
36
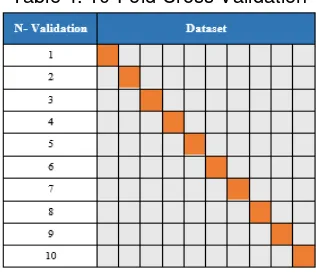
Data validation performed on each method using a "10-fold cross-validation" will be divided into 10 sections and one section going to be tested and the remaining data going to be the training data. The results of the validation will get the accuracy of each method used in the processing of datasets. The final result going to do a comparison of the accuracy of each method used.Figure 1. Block Diagram Classification Method
3.3. Model Validation
Stratified 10-fold cross-validation is used for learning and testing data. This means that the dataset will be divided into 10 equal parts and then perform the learning process 10 times.
The process shown in Table 4. One part of dataset is testing data and used the remaining nine parts for learning. And then, calculated the average values and the deviation values from the ten different testing results. This method has become the standard and state-of-the-art validation method in practical terms. Some tests have also shown that the use of stratification improves results slightly.
Table 4. 10-Fold Cross Validation
Experiments were performed to determine how good the success of any method of classify a student majors in STIKOM PGRI Banyuwangi and comparing the result between each method on this research.
First step, data that used is data from student data of STIKOM PGRI Banyuwangi that taken from the class of 2009 until to the class of 2011. From these data, obtained from a total of 663 students as raw data. The result shown in table 5.
Then performed filter the data back to the data of the student with the provisions of the students who majored in IT with graduate status, the value of minimum GPA of 3.0 and the minimum value of each course is 2.0. Data showed a total of 269 students of the student data. Second step, the data will be classifying using 5 methods that proposed in this research. The accuracy taken from every method showing in table 6.
Dataset Student Major
C4.5 Naïve Bayes KNN Random
Forest SVM
10 Fold Cross
Validation Calculate Accuracy
Result Process
37
Table 5. Student Data of STIKOM PGRI BanyuwangiStudent ID Number ID Option Major Option 1111201 1111202 … … 1111319
1109100331 2 Networking 3 4 - - 3
From the data shown above for accuracy results in each method, the C4.5 method has the accuracy result value 48.72% based on the student majors that have been processed. In the Jaringan prediction has a result class precision by 47.65%, while the class recall has the result of 66.39%. RPL has a result class precision of 45.12%, while the class recall of 31.09%. for results of the accuracy of this method at 41.62%. K-NN method for the Jaringan prediction have the results in class precision of 48.91%, for the class recall have a yield of 54.92%. RPL on a class prediction precision of 45.69%, whereas the recall class has a yield of 44.54%. AI has a result class prediction precision by 50%, whereas the recall class has a yield of 28.57%. results of the accuracy of this method amounted to 47.52%.
Random Forest method in a Jaringan prediction has a class precision of 46.46%, whereas the recall class has a yield of 75.41%. For the prediction of RPL have precision class results by 43.66%, whereas the recall class has a yield of 26.05%. AI has a result class prediction precision and recall class 0%. The results of the accuracy of this method at 45.73%. method of Support Vector Machine to the prediction of the network has a class of precision of
C4.5 true JARINGAN true RPL true AI class precision
pred. JARINGAN 81 79 10 47.65%
pred. RPL 40 37 5 45.12%
pred. AI 1 3 13 76.47%
class recall 66.39% 31.09% 46.43%
Accuracy 48.72%
Naïve Bayes true JARINGAN true RPL true AI class precision
pred. JARINGAN 50 48 7 47.62%
pred. RPL 50 48 7 45.71%
pred. AI 22 23 14 23.73%
class recall 40.98% 40.34% 50.00%
Accuracy 41.62%
K-NN true JARINGAN true RPL true AI class precision
pred. JARINGAN 67 60 10 48.91%
pred. RPL 53 53 10 45.69%
pred. AI 2 6 8 50.00%
class recall 54.92% 44.54% 28.57%
Accuracy 47.52%
Random Forest true JARINGAN true RPL true AI class precision
pred. JARINGAN 92 88 18 46.46%
pred. RPL 30 31 10 43.66%
pred. AI 0 0 0 0.00%
class recall 75.41% 26.05% 0.00%
Accuracy 45.73%
SVM true JARINGAN true RPL true AI class precision pred. JARINGAN 96 101 24 43.44%
pred. RPL 26 18 4 37.50%
pred. AI 0 0 0 0.00%
class recall 78.69% 15.13% 0.00%
38
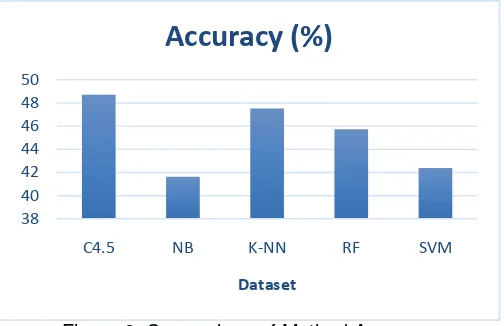
43.44%, whereas the recall class has a yield of 78.69%. For the prediction precision class RPL has the result of 37.50%, while the class recall has the results by 15:13%. AI has a result class prediction precision and recall class 0%. The results of the accuracy of this method at 42.39%.Figure 2. Comparison of Method Accuracy
As shown in Figure 2 from the comparative degree of accuracy on every method, it can be seen that the C4.5 method has the highest accuracy results in the amount of 48.72% compared with other methods. Prediction AI for C4.5 method has the highest precision class value amounted to 76.47%, but for the class recall, the SVM method to the prediction of RPL has a value of 75.41%. C4.5 has the highest value, followed by K-NN, RB, NB and SVM in the second, third, fourth, and fitth rank.
Comparison is made against any method to determine the level of the comparison in classifying a student majors in STIKOM PGRI Banyuwangi. The process of comparison to the proposed method by using T-Test Pairwise. The results of the comparison of each method are shown in Table 7.
Table 7. Pairwise T-Test
By using the value of alpha = 0.5, then the result of the comparison is shown in Table 6 actually there is no significant difference between C4.5, NB, K-NN, RF, and SVM models. This result confirmed result that C4.5 having a significant difference into K-NN, and Naïve Bayes having a significant difference into SVM, and K-NN have a significant difference into RF.
4. Conclusion
Based on comparative data mining classification algorithms are C4.5, Naïve Bayes, KNN, Random Forest, and SVM for classification of student majors using 269 data sets students of STIKOM PGRI Banyuwangi, it can be analyzed that the results of C4.5 algorithm is the most accurate than other method. the accuracy of the results obtained by 48.72%. but the results accuracy is not satisfactory because the entire result of the accuracy of each method is tested against the data set has the accuracy results below 50%
for further research are given advice by adding multiple classification algorithms such as Logistic Regression, Neural Networks, Linear Discriminant Analysis (LDA), and so on for the measurement accuracy of the data results to be even better.
38 40 42 44 46 48 50
C4.5 NB K-NN RF SVM
Dataset
Accuracy (%)
39
Reference[1] Amir, J, Pizzolato E. B. An Efficient K–NN Approach for Automatic Drowsiness Detection Using Single–Channel EEG Recording. 38th Annual International Conference of the IEEE Engineering in Medicine and Biology Society (EMBC). 2016: 820 - 824.
[2] A. Alshareef, S. Ahmida, A.Abu Bakar, A.R. Hamdan, M.Alweshah. Mining Survey Data on University Students to Determine Trends in the Selection of Majors. In proceeding Science and Information Conference. London, UK. 2015.
[3] Christos T, Maria V, Spyridon M. Comparative Analysis of algorithms for student characteristics classification using a Methodological Framework. International Conference on Information, Intelligence, Systems and Applications (IISA). 2015; 6: 1 - 5.
[4] Farhana S, Thanassis T, Hugh C. Linked Data, Data Mining and External Open Data for Better Prediction of at-risk Students. International Conference on Control, Decision and Information Technologies (CoDIT), 2014: 652 - 657.
[5] Gunn, S.R. Support Vector Machines for Classification and Regression, Technical Report, University of Southampton. 1998.
[6] Hamidah Jantan et al., Human Talent Prediction in HRM using C4.5 Classification Algorithm. Universiti Teknologi MARA (UiTM) Terengganu, Universiti Kebangsaan Malaysia (UKM), Selangor, Malaysia, (IJCSE) International Journal on Computer Science and Engineering, 2010; 02(08): 2526-2534
[7] Harsiti, Tb. Ai Munandar, Sigit, H. T. Implementation of Fuzzy-C4.5 Classification as a Decision Support for Students Choice of Major Specialization. International Journal of Engineering Research & Technology (IJERT), 2013; 2(11): 1577 - 1581.
[8] J. Liang, C. Li, L. Zheng. Machine Learning Application in MOOCs: Dropout Prediction. 11th International Conference on Computer Science & Education (ICCSE). 2016: 52 - 57.
[9] Kamaljit K, Kuljit K. Analyzing the Effect of Difficulty Level of a Course on Students Performance Prediction using Data Mining. 1st International Conference on Next Generation Computing Technologies (NGCT). 2015: 756 - 761.
[10] Lu S, Tong W, Chen Z. Implementation of the KNN Algorithm Based On Hadoop. International Conference on Smart and Sustainable City and Big Data (ICSSC). 2015: 123 - 126.
[11] Nitin P, Parag K. (2016). Algorithm Selection for Classification Problems. SAI Computing Conference. 2016: 203 – 211.
[12] Pathom P, Anongnart S, Prasong P. Comparisons of Classifier Algorithms: Bayesian Network, C4.5, Decision Forest and NBTree for Course Registration Planning Model of Undergraduate Students. IEEE International Conference on Systems, Man and Cybernetics. 2008: 3647 - 3651. [13] Preeti KD, Siddhi K, Ashish D, Aditya B, Prof. Kanade VA. Analysis of Customer Churn Prediction
in Telecom Industry using Decision Trees and Logistic Regression. Symposium on Colossal Data Analysis and Networking (CDAN). 2016: 1 - 4.
[14] Sara H, Marisa K. Orr. Background and demographic factors that influence graduation: A comparison of six different types of majors. IEEE Frontiers in Education Conference (FIE). 2015: 1 - 7.