Comparison of HPLC Metabolite Profile and Antioxidant Activity of Aqueous Extract of Ginkgo Biloba from Two
Commercial Products Available in Bangladesh Market
By Sarin Ahmed
15346038
A thesis submitted to the Department of Pharmacy in partial fulfillment of the requirements for the degree of
Bachelor of Pharmacy (Hons.)
Department of Pharmacy Brac University
February 2020
© 2020. Brac University All rights reserved.
Declaration
It is hereby declared that
1. The thesis submitted is my own original work while completing degree at Brac University.
2. The thesis does not contain material previously published or written by a third party, except where this is appropriately cited through full and accurate referencing.
3. The thesis does not contain material which has been accepted, or submitted, for any other degree or diploma at a university or other institution.
4. I have acknowledged all main sources of help.
Student’s Full Name & Signature:
Sarin Ahmed 15346038
Approval
The thesis titled “Comparison of HPLC Metabolite Profile and Antioxidant Activity of Aqueous Extract of Ginkgo Biloba from Two Commercial Products Available in Bangladesh Market” submitted by Sarin Ahmed (15346038) of Spring 2020 has been accepted as satisfactory in partial fulfillment of the requirement for the degree of Bachelor of Pharmacy on February, 2020.
Examining Committee:
Supervisor:
(Member) _______________________________
Dr. Raushanara Akter
Associate Professor, Department of Pharmacy Brac University
Program Coordinator:
(Member) _______________________________
Dr. Hasina Yasmin
Professor, Department of Pharmacy Brac University
Departmental Head:
(Chair) _______________________________
Dr. Eva Rahman Kabir Professor, Department of Pharmacy
Brac University
Abstract
The availability of several brands of Ginkgo biloba in Bangladesh market places the health professionals in a confused situation when selecting the desired quality product for patients.
This study was aimed to evaluate the quality by comparing antioxidant activities and HPLC metabolite profile of two brands formulated from Ginkgo biloba, purchased from retail pharmacies. These drugs are widely used in blood disorders, COPD symptoms, Alzheimer’s disease, Raynaud’s disease, peripheral vascular disease. In DPPH free radical scavenging assay, the highest % of inhibition for sample 1 and 2 was 88.022% and 86.892%. At the highest concentration of 1200 µg/mL, sample 1 extract showed higher value in TPC, TFC and TAC test. In HPLC metabolite profile, quercetin and kaempferol amount for sample 1 was also better than sample 2. Based on the study findings, sample 1 is expected to produce more therapeutic effect than sample 2.
Keywords: Ginkgo biloba; Antioxidant activity; Metabolite profile; DPPH; TPC; TFC
Dedication
Dedicated to my family to whom I owe my achievements and success
Acknowledgement
First of all, I would like to announce the gratefulness of Almighty Allah for giving me the strength and health to accomplish this project paper and complete the processes of bachelors in Pharmacy.
I specially want to thank my supervisor Dr. Raushanara Akter, Associate Professor, Department of Pharmacy, Brac University for the continuous support, kind guidance and skilled advice that greatly helped me to finish my project work.
I would like to express my gratitude to the head of our department Dr. Eva Rahman Kabir, Chairperson and Professor, Department of Pharmacy, Brac University and my respected faculty members.
I seek gratitude to the laboratory authority and staffs for their prompt assistance and cooperative attitude that helped me to conduct my experimental research works without interruptions.
Above all, I am obligated to my family members especially my parents who have supported me tremendously throughout my entire semester which enlightened my spirit to work harder and faster to complete this final paper.
Table of Contents
Declaration... ii
Approval ... iii
Abstract ... iv
Dedication ... v
Acknowledgement ... vi
Table of Contents ... vii
List of Tables ... xii
List of Figures ... xiv
List of Acronyms ... xvi
Chapter 1 Introduction... 1
1.1 Perspectives of the commercially available drugs in Bangladesh market ... 1
1.2 Phytochemical screening of medicinal plants ... 2
1.3 Free radicals and reactive oxygen species contributing in damage of organs and tissues ... 3
1.4 Antioxidants defense system... 4
1.5 In-vitro antioxidant assays ... 5
1.5.1 Principle of DPPH free radical scavenging assay ... 5
1.5.2 Principle of total phenolic content (TPC) determination ... 6
1.5.3 Principle of total flavonoid content (TFC) determination ... 6
1.5.4 Principle of total antioxidant capacity (TAC) determination ... 6
1.6 High performance liquid chromatography (HPLC) ... 7
1.6.1 Principle of HPLC profiling analysis ... 7
1.7 Selection of Ginkgo biloba for the study ... 7
1.7.1 General description of Ginkgo biloba ... 8
1.7.2 Distribution and habitat of Ginkgo biloba ... 9
1.7.3 Therapeutic uses of Ginkgo biloba ... 10
1.7.4 Side effects of Ginkgo biloba and precautions... 11
1.7.5 Available commercial products of Ginkgo biloba in Bangladesh market ... 11
1.8 Rationale of the study ... 12
1.9 Aim of the study... 12
1.10 Objectives of the study... 12
Chapter 2 Literature review ... 14
2.1 Previous studies on Ginkgo biloba ... 14
2.1.1 Previously studied pharmacological and antioxidant studies on Ginkgo biloba 14 2.1.2 Previous studies on HPLC profiling of Ginkgo biloba ... 14
Chapter 3 Methodogy ... 15
3.1 Collection and authentication ... 16
3.2 Phytochemical tests performed ... 16
3.2.1 Test for alkaloids... 17
3.2.2 Test forglycosides ... 17
3.2.3 Test for tannins ... 17
3.2.4 Test for flavonoids ... 18
3.2.5 Test for sterols... 18
3.2.6 Test for coumarin ... 19
3.2.7 Test for resins ... 19
3.2.8 Test for phenols... 19
3.2.9 Test for saponins ... 19
3.2.10 Test for terpenoids ... 19
3.3 In-vitro antioxidant assay performed ... 20
3.3.1 DPPH free radical scavenging assay... 20
3.3.1.1 Reagents and chemicals ... 20
3.3.1.2 Reagent preparation ... 21
3.3.1.3 Sample and standard solution preparation ... 21
3.3.1.4 Experimental procedure ... 22
3.3.2 Determination of total phenolic content (TPC) ... 22
3.3.2.1 Reagents and chemicals ... 23
3.3.2.2 Reagent preparation ... 23
3.3.2.3 Sample and standard solution preparation ... 23
3.3.2.4 Preparation of the blank ... 24
3.3.2.5 Experimental procedure ... 24
3.3.3 Determination of total flavonoid content (TFC) ... 25
3.3.3.1 Reagents and chemicals ... 25
3.3.3.2 Reagent preparation ... 25
3.3.3.3 Sample and standard solution preparation ... 26
3.3.3.4 Preparation of the blank ... 26
3.3.3.5 Experimental procedure ... 26
3.3.4 Determination of total antioxidant capacity (TAC) ... 27
3.3.4.1 Reagents and chemicals ... 27
3.3.4.2 Reagent preparation ... 28
3.3.4.3 Sample and standard solution preparation ... 28
3.3.4.4 Preparation of the blank ... 29
3.3.4.5 Experimental procedure ... 29
3.4 High performance liquid chromatography (HPLC) profile ... 30
3.4.1 Materials, reagents and solvents ... 30
3.4.2 Extraction solvent preparation ... 30
3.4.3 Mobile phase preparation ... 30
3.4.4 Standard solution preparation ... 31
3.4.5 Sample solution preparation ... 31
Chapter 4 Result ... 33
4.1 Preliminary phytochemical screening result ... 33
4.2 Evaluation of antioxidant activity ... 34
4.2.1 DPPH free radical scavenging assay... 34
4.2.2 Total phenolic content (TPC) determination ... 41
4.2.3 Total flavonoid content (TFC) determination ... 47
4.2.4 Total antioxidant capacity (TAC) determination ... 53
4.3 High performance liquid Chromatography (HPLC) determination ... 58
4.3.1 Identification of the standard A and B ... 58
4.3.2 Identification of the sample1 and 2 ... 60
4.3.3 Comparison data of sample 1 and 2 ... 61
Chapter 5 Discussion ... 63
5.1 Phytochemical screening tests ... 63
5.2 In-vitro antioxidant activity ... 64
5.2.1 DPPH free radical scavenging assay... 64
5.2.2 Total phenolic content (TPC) test ... 65
5.2.3 Total flavonoid content (TFC) test ... 67
5.2.4 Total antioxidant capacity (TAC) test ... 68
5.3 HPLC metabolite profile analysis ... 69
Chapter 6 ... 71
Conclusion ... 71
Future direction ... 72
References ... 73
List of Tables
Table 1: Available commercial products of Ginkgo biloba in Bangladesh market ... 11
Table 2: Previously studied HPLC profiling studies of Ginkgo biloba ... 15
Table 3: Description of the two commercially available drugs in Bangladesh market ... 16
Table 4: Reagents and chemicals required to determine DPPH scavenging activity ...Error! Bookmark not defined.21 Table 5: Reagents and chemicals required to determine total phenolic content ...Error! Bookmark not defined. Table 6: Reagents and chemicals required to determine total flavonoid content ...Error! Bookmark not defined. Table 7: Reagents and chemicals required to determine tota antioxidant capacity ...Error! Bookmark not defined. Table 8: Materials, reagents and solvents required to determine HPLC profiling ...Error! Bookmark not defined. Table 9: Result of phytochemicalscreening tests ... Error! Bookmark not defined.3 Table 10: IC50 value of DPPH scavenging assay by standard (L-ascorbic acid) ...Error! Bookmark not defined.5 Table 11: IC50 value ofDPPH scavenging assay by sample 1Error! Bookmark not defined.6 Table 12: IC50 value of DPPH scavenging assay by sample 2 ... 38
Table 13: Comparison of absorbances for different concentrations in DPPH assay ... 40
Table 14: GAE values of Total phenolic content (TPC) test by standard gallic acid ... 41
Table 15: GAE values of Total phenolic content (TPC) test by sample 1 ... 43
Table 16: GAE values of Total phenolic content (TPC) test by sample 2 ... 44
Table 17: Comparison of absorbances for different concentrations in TPC test ... 46
Type text here
Table 18: QE values of Total flavonoid content (TFC) test by standard quercetin ... 47
Table 19: QE values of Total flavonoid content (TFC) test by sample 1 ... 49
Table 20: QE values of Total flavonoid content (TFC) test by sample 2 ... 50
Table 21: Comparison of absorbances for different concentrations in TFC test ... 52
Table 22: AAE values of Total anioxidant capacity (TAC) test by standard ascorbic acid .... 53
Table 23: AAE values of Total anioxidant capacity (TAC) test by sample 1 ... 55
Table 24: AAE values of Total anioxidant capacity (TAC) test by sample 2 ... 56
Table 25: Comparison of absorbances for different concentrations in TAC test ... 58
Table 26: Comparison data of the contents present in sample 1 and 2 in HPLC profiling ... 61
List of Figures
Figure 1: Tissue damage by free radicals ... 3
Figure 2:Organs affected by oxidative damage ... 4
Figure 3: Ginkgo biloba plant ... 8
Figure 4: Leaves of Ginkgo biloba ... 10
Figure 5:DPPH free radical scavenging assay ... 34
Figure 5: Curve of standard (ASA) for DPPH free radical scavenging assay ...36Error! Bookmark not defined. Figure 7: Curve for sample 1 for DPPH free radical scavenging assay ... 38
Figure 8:Curve for sample 2 for DPPH free radical scavenging assay... 39
Figure 9: Graph of DPPH : absorbance vs concentration for sample 1,2 and std...40Error! Bookmark not defined. Figure 10: Total phenolic content (TPC) test ... 41
Figure 11:Curve of standard Gallic acid for Total phenolic content (TPC) test ... 42
Figure 12:Curve for sample 1 forTotal phenolic content (TPC) test ... 44
Figure 13:Curve for sample 2 forTotal phenolic content (TPC) test ... 45
Figure 14:Graph of TPC : absorbance vs concentration for sample 1,2 and std ... 46
Figure 15:Total flavonoid content (TFC) test ... 47
Figure 16:Curve of standard Quercetin for Total flavonoid content (TFC) test ... 48
Figure 17:Curve for sample 1 for Totalflavonoid content (TFC) test ... 50
Figure 18:Curve for sample 2 for Totalflavonoid content (TFC) test51Error! Bookmark not defined. Figure 19:Graph of TFC : absorbance vs concentration for sample 1,2 and std ...52Error! Bookmark not defined. Figure 20: Total antioxidant capacity (TAC) test ... 53
Figure 21:Curve of standard Ascorbic acid for Total antioxidant capacity (TAC) test... 54
Figure 22:Curve for sample 1 for Totalantioxidant capacity (TAC) test ... 56
Figure 23:Curve for sample 2 for Totalantioxidant capacity (TAC) test ... 57
Figure 24:Graph of TAC : absorbance vs concentration for sample 1,2 and std ... 58
Figure 25: Identification of std Quercetin by HPLC metabolite profiling... 59
Figure 26:Identification of std Kaempferol by HPLC metabolite profiling ... 59
Figure27:Identification of Quercetin and Kaempferolpresent in sample 1 by HPLC metabolite profiling... 60
Figure 28:Identification of Quercetin and Kaempferol present in sample 2 by HPLC metabolite profiling ... 61
Figure 29: Bar graph showing visual comparison of the contents present in sample 1 and sample 2. ... 62
List of Acronyms
ROS - Reactive Oxygen Species WHO - World Health Organization DPPH - 1, 1-diphenyl-2-picryl hydroxyl ASA - Ascorbic Acid
FCR - Folin-Ciocalteu reagent GAE - Gallic Acid Extract TPC -Total Phenol Content TFC -Total Flavonoid Content TAC - Total Antioxidant Capacity
HPLC - High Performance Liquid Chromatography
Chapter 1 Introduction
1.1 Perspectives of the Commercially Available Drugs in Bangladesh Market
With a large number of drug industries in Bangladesh, the amounts of generic drug products have increased in number. However, this also raised argument on drug product quality because of the preference on favoring a more established manufacturer brand. This unconscious preference of people for the drugs of renowned manufacturing companies over the less renowned generic drugs may be associated with undesirable high cost. Generic substitution refers to the prescribing of different brand or an unbranded drug containing the same API at similar strength and dosage form (Posner & Griffin, 2011). Drug products of top pharmaceutical companies are known to be better as well as costly. It is a common psychology that drug products manufactured by top pharmaceutical companies are better in comparison with the products manufactured by small scale companies. However, poor people of under-developed and developing countries can hardly afford them in comparison with the products manufactured by the low scale companies (Oishi et al., 2017). Therefore, it has become necessity to determine the parameters of tablets during manufacturing in order to ensure that the product is of quality (Hailu et al., 2013) and to identify counterfeits. As nowadays, drugs can be obtained from more than one sources, there might be a chance of the presence of some superiors along with sub-standard drugs (Oishi et al., 2017). This makes the patients and prescribers conscious about the selection of medicines considering safety, effectiveness as well as economy (Tamader et al., 2016). The drug regulatory authority of the country has the responsibility to ensure the quality of drug, as drugs not meeting the quality criteria may cause serious health complications, drug adverse reactions, may produce drug
resistance in the individual as well as can increase the risk of morbidity and mortality (Binega et al., 2013). To assess the quality, therapeutic efficacy and safety of the drugs available commercially, post market monitoring serves as a confidential tool (Hailu et al., 2013). The existing regulations and product development can be moved rapidly by obtaining information from such monitoring (Chandrasekaran et al., 2011).
In this research, several parameters like HPLC metabolite profile and antioxidant study were evaluated on the aqueous extract of Ginkgo biloba from two commercially available products present in Bangladesh market to make quality comparison between them. Till now no such evaluation on the aqueous extract of Ginkgo biloba from commercially products available in the local market was carried out before. These facts directed interest to assess the quality of commercially available capsules in the Bangladeshi market where one of them is from a mainstream pharmaceutical company and the other one is from a herbal company.
1.2 Phytochemical Screening of Medicinal Plants
Phytochemical screening carries an important part of the procedure to get bioactive constituents, more specifically secondary metabolites from plant materials. Phytochemical screening is usually carried out on whole plant or sometimes on a particular part of plant to get the desired bioactive compounds (Sulaiman & Balachandran, 2012).The extract of medicinal plants contains several phytochemicals providing powerful solution to many diseases and pathological conditions. These compounds incorporate substances like flavonoids, alkaloids, saponins, glycosides, tannins and phenolic compounds (Gul et al., 2017). Various studies show that the compounds that are isolated from the natural sources are superior to those of the synthetic analogues due to their environmental safety and biodegradability. Hence, isolating phytochemicals and conducting study on them has created opportunities to link between conventional and modern drug compounds by identifying
natural compounds and formulating drugs from them. About 50% of all marketed drugs were derived from natural sources and their derivatives (LIU et al., 2006). In present world, many global researches are being conducted to discover different natural compounds with strong biological activity from distinct parts of medicinal plants to achieve a vast number of therapeutic effects (Archit et al., 2014).
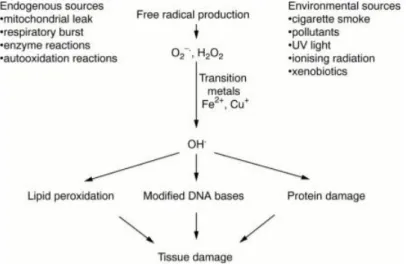
1.3 Free Radicals and Reactive Oxygen Species Contributing in Damage of Organs and Tissues
Free radicals can be defined as any unpaired electron in an atomic orbital where molecular species can exist independently (Liu & Nair, 2010). Reactive oxygen species (ROS) produces due to the molecular oxygen reduction through exposure of high energy or reaction regarding electron transfer (Sailaja Rao et al., 2011). Free endogenous radicals act within the cell and later released into the surrounding area. If free radicals are exposed for a long period of time, it can have thoughtful effect on tissue damage, ultimately diseases generation.
Figure 1: Tissue damage by free radicals
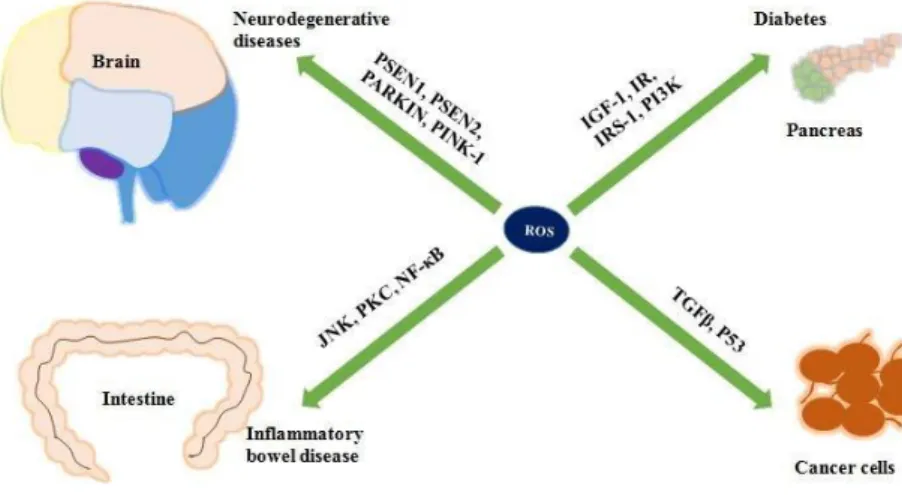
Reactive oxygen species (ROS) which is produced from mitochondria, endoplasmic reticulum, peroxisomes, membrane with the help of several enzymes is responsible for the
production of oxidative stress (Ogura & Shimosawa, 2014). It is highlighted in the above figure that reactive oxygen species (ROS) accumulate oxidative stress in various organs and eventually destroys the cells which can lead to being affected with various diseases. In the brain, ROS damage the nerve cells causing neurodegenerative diseases associated with Alzheimer's disease and Parkinson's disease (Sailaja Rao et al., 2011). ROS also damage the gut barrier and ultimately produce inflammatory bowel disease. In addition, beta cells may get damaged by the inhibition of insulin and insulin growth factors leading diabetes. In terms of cancer, normal cell cycles may become damaged due to the imbalance of transforming growth factors in DNA (He et al., 2017).
Figure 2: Organs affected by oxidative damage
1.4 Antioxidants Defense System
Antioxidants are defined as the substances that can delay or inhibit the oxidation of the substrate significantly when present at low concentrations compared to that of an oxidizable substrate (Ramful et al., 2011). They guard the cells from the harmful effects of reactive oxygen species that causes oxidative stress which ultimately lead to cell damage (Hamid et al., 2010). They shield the body from destructive molecules that are known as free radicals.
Free radicals are produced by oxidation in the body. Oxidation is one type of biochemical
reaction leading to the initiation of extemporaneous chain reaction that causes damage to the cells of human body. Free radicals play a common and probably the most important role in the damage of our body cell which ultimately causes aging problem (Sailaja Rao et al., 2011).
They have the potential to damage healthy cells of body by destroying their structure and functions. Antioxidants act as defense system by two types of processes. One process halts the chain reaction by eliminating the free radicals and oxidation reaction while the other process involves donation of electrons to the free radicals in the system (Flora, 2009). That is how antioxidant neutralizes free radicals excess, cytotoxicity, oxidative stress, the availability of oxidants. This lead to the reduction of cell death, organ damage and prevent diseases like early ageing, degenerative diseases, diabetes, cancer etc (Elkhamlichi et al., 2017). Thus, scientists are putting their interest on different natural sources such as plant extracts to obtain natural potential antioxidants.
1.5 In-vitro Antioxidant Assay
Radical scavenging activity can be determined by DPPH, TPC, TFC and TAC assay. These methods are most reliable, cheap and accurate method compared to other methods that determine the radical scavenging activity (Alam et al., 2013). On the other hand, FRAP assay is established for assessing "antioxidant power" which is an automated test measuring the ferric reduction capacity (Benzie & Strain, 1996).
1.5.1. Principle of DPPH Free Radical Scavenging Assay
DPPH is quick, simple and cheap in comparison with other test models among free radical scavenging methods (Alam et al., 2013). The reaction between DPPH and antioxidants (H-A) is given below:
DPPH + HA : DPPH-H + HA
In the above reaction, DPPH(1, 1-diphenyl-2-picrylhydrazyl) turns into yellow color from red color by the reaction of substrate. Antioxidants react with an antioxidant and form DPPH-H with the loss of red color. This degree of discolorations designates the scavenging activity of antioxidant compounds or extracts (Brewer, 2011).
1.5.2 Principle of Total Phenolic Content (TPC) Determination
Folin-ciocalteu reagent (FCR) is used in TPC determination to measure the reducing ability of the sample. This compound undergoes reduction reactions that involves transfer of electrons and forms blue colored complex (Wolfe et al., 2003). In the complex, molybdenum is reduced due to electron transfer between the reducing agent and Mo (VI).
Mo (VI) + e- : Mo (V)
1.5.3 Principle of Total Flavonoid Content (TFC) Determination
An acidic complex is produced between 3 substrates of C-4 keto group with either C-3 or C- 5 hydroxyl group of the flavanols and flavones present in the extract sample with aluminium chloride. Moreover, acid labile complexes is formed by AlCl3 with the ortho-dihydroxyl groups in the A or B ring of the flavonoids (Kumaran & Joel Karunakaran, 2007).
1.5.4 Principle of Total Antioxidant Capacity (TAC) Determination
The basis of this test relies on the reduction reaction between Mo(VI) to Mo(V) by the sample extract. A green colored phosphate-molybdenum(V) complex at an acidic pH is formed by the interaction (Prieto et al., 1999).
1.6 High Performance Liquid Chromatography (HPLC)
High performance liquid chromatography (HPLC) formerly referred as high pressure liquid chromatography is a preparative or an analytical technique. The technique is used for
separation, purification and qualitative and quantitative identification of a unique chemical compound from a mixture of compounds. The advantages of this technique includes sensitivity and fast process that allow using smaller particle size (Malviya & Sharma, 2014).
1.6.1 Principle of HPLC Profiling Analysis
HPLC mainly utilizes a column that holds packing material (stationary phase). The instrumentation also includes a pump that can move the mobile phase through the column and a detector that can show the retention times of the molecules. Retention time at which a specific analyte elutes or comes out depends on the interactions between the stationary phase, the molecules being analyzed, and the used solvent types. The sample to be analyzed is placed in a small amount to the stream of mobile phase. Then chemical or physical interactions occur with the stationary phase. The nature of the analyte and composition of both stationary and mobile phase is dependent on the amount of interaction. The gradient separates the mixtures of analyte according to the affinity for mobile phase during analysis.
This depends on the variation of mobile phase composition. This is known as gradient elution. A computer connected with the instrumentation helps to analyze the data and show the output in display. When the mobile phase leaves the detector, it can be sent to waste or collected as desired (Malviya & Sharma, 2014).
1.7 Selection of Ginkgo biloba for the Study
After going through overview on Ginkgo biloba, it was found that in-vitro antioxidant potential of the aqueous extract of the plant from marketed samples was never performed before. Thus, it was taken as initiative to determine its antioxidant, phytochemical activity and HPLC profile. The plant Ginkgo biloba was found to contain flavonoids like quercetin, kaempferol and isorhamnetin (Belwal et al., 2018). Quercetin which contains flavonol in abundant has potent antioxidant property because of the right molecular structure for showing
potent free radical scavenging activity (Pal et al., 2009). That is why, aqueous extract of the marketed samples containing the plant constituents is selected for the present study.
1.7.1 General Description of Ginkgo biloba
Figure 3: Ginkgo biloba plant
Scientific name: Ginkgo biloba
Common names: Ginkgo, Maidenhair tree, Baogou, Yin-hsing
Family: Ginkgoaceae
Part used: Leaves and seeds
Mean molecular mass: 756.7 (United & Pharmacopeia, 2018)
Chemical constituents:
1) Terpenetrilactones (TTL) or Terpenoids [5.4-6.6%, approx. 6%]
a. Ginkgolide A (GKA), B (GKB), C (GKC) and J (GKJ) [2.8-3.4%]
b. Bilobalide (Bb) [2.6-3.2%]
2) Flavonoids or Flavone glycoside [22-27%, approx. 25%]
a. Quercetin [dominant, 64.8-81.5%]
b. Kaempferol [13.3-28.9%]
c. Isorhamnetin [2-8.4%]
3) Others
a. 6-hydroxy kynurenic acid b. Ascorbic acid
c. Carotenoids d. Ginkgolic acid
e. Dimeric flavones (Fermino et al., 2015)
Taxonomic hierarchy:
Domain: Eukarya Kingdom: Plantae Phylum: Ginkgophyta Class: Ginkgoopsida Order: Ginkgoales Family: Ginkgoaceae Genus: Ginkgo
Species: Ginkgo biloba
1.7.2 Distribution and Habitat of Ginkgo biloba
There is only one species of Ginkgo remaining on earth which is named Ginkgo biloba around 250million years ago. Ginkgo biloba is native to China, also widely cultivated in Japan, Korea, Europe and the southern United States. The ginkgo is a tree that grows to around 30m and has fan-shaped leaves with a unique vein pattern. The leaves turn yellow each autumn before falling off (Miranda, 2011).
Figure 4: Leaves of Ginkgo biloba
1.7.3 Therapeutic Uses of Ginkgo Biloba
Ginkgo has a long history in traditional Chinese medicines. Some of the therapeutic indications of the plant are mentioned below (Belwal et al., 2018; Fermino et al., 2015)(Mullaicharam, 2016):
Improves cognitive function and mild to moderate cerebrovascular insufficiency
Enhances blood circulation in brain and to the entire body
As anti-depressant, reduce thrombosis and inhibit platelet aggregation
Improve concentration and combat short-term memory loss
Treat blood disorders, COPD symptoms, Alzheimer’s disease, Raynaud’s disease, peripheral vascular disease and arterial occlusive disease
Treat dementia, thinking problems, vision problems, vertigo, tinnitus symptoms
Other potential uses include treating acute cochlear deafness, sexual dysfunction associated with SSRI use and protective action in hypoxia.
1.7.4 Side Effects of Ginkgo biloba and Precautions
No significant side effect has been observed following proper administration of designated therapeutic dosage. Large amounts or concentrations may cause gastrointestinal disturbance such as diarrhea, nausea, headache, vomiting, restlessness, weakness and skin irritation.
Moreover, it is better to avoid in case of hypersensitivity and bleeding disorders. Therefore, it is safe to use with caution in taking anticoagulant or antiplatelet agents (Belwal et al., 2018).
1.7.5 Available Commercial Products of Ginkgo biloba in Bangladesh Market
The table 1showing the available commercial products of Ginkgo biloba in Bangladesh market are given below from where two of them have been selected for this study:
Table 1: Available commercial products of Ginkgo biloba in Bangladesh market
Manufacturer name Brand name Dosage form
Dose (mg)
Dosage &
administration Incepta Pharmaceuticals Premelos
Capsule
60/120 mg For adults:
120-240 mg/day
1 or 2 capsule 2 to 3 times daily Square Pharmaceuticals Ltd
Giloba 60/120 mg
Radiant Nutraceuticals Limited
Ginoba 60 mg
Drug International Ltd Biloba 60 mg
Hamdrad Laboratories (WAQF) Bd
Kobi 60/40 mg
Purnava Ltd (Renata ltd) JeeBee 60 mg
1.8 Rationale of the Study
The rationale of this project is to compare the quality and antioxidant activities of two marketed products formulated from Ginkgo biloba extract which are indicated to treat blood disorders, thrombosis, COPD symptoms, Alzheimer’s disease, Raynaud’s disease, short-term memory loss, dementia tinnitus etc. Among the available brands in Bangladesh market, two
were selected for evaluating the HPLC metabolite profile and antioxidant activity from the aqueous extract of Ginkgo biloba where one of them is from a mainstream pharmaceutical manufacturer company and another is from a herbal company.
1.9 Aim of the Study
The aim of the study is to investigate in-vitro antioxidant assays and HPLC metabolite profile of Ginkgo biloba from aqueous extract of two commercially available drug formulations and make comparison of quality between the both samples.
1.10 Objectives of the Study
The objectives of the project are as follows:
To carry out phytochemical screening test with the purpose of qualitative determination of the existence of phyto compounds.
To evaluate and compare the antioxidant properties of the aqueous extract of two commercially available products formulated from the plant Ginkgo biloba by determining DPPH free radical scavenging activity, total phenolic content, total flavonoid content and total antioxidant capacity.
To perform qualitative and quantitative analysis to identify the present constituents by HPLC metabolite profiling.
Chapter 2
Literature Review
2.1 Previous Studies on Ginkgo biloba
Literature review of Ginkgo biloba has been carried out to find out the previous studies.
2.1.1 Previously Studied Pharmacological and Antioxidant Studies on Ginkgo biloba
Previous studies showed toxicological and positive pharmacological effects of Ginkgo biloba.
One review study by (Yotova et al., 2018) discusses about the potential health hazards of the plant as carcinogen. Study by (Box, 2013) reported on toxicology and carcinogenesis studies of the plant. Another review focuses on the evidence-based practice of Ginkgo biloba on brain health (Mullaicharam, 2016). Moreover, an established monograph talked about the detailed description of this plant (Pae, 1998). Furthermore, biological analysis study had been conducted by (Dumitru & Câmpean, 2016). The properties are extended in the journal by (Belwal et al., 2018) and multifaceted therapeutic benefits are explained by (Reviews &
Science, 2008).
The phenolic content and antioxidant capacity of Ginkgo teas had been conducted by (Science, 2016). Another study by (Raafat et al., 2017) discussed about lead ions chelation process optimization after chelation with Ginkgo Biloba combined with usage of magnetic treated water as drinking water.
2.1.2 Previous Studies on HPLC Profiling of Ginkgo biloba
The previously studied HPLC metabolite profiling studies of Ginkgo biloba are given in table 2.
Table 2: Previous studies on HPLC profiling of Ginkgo biloba
Specificity of the studies References HPLC-UV analysis of flavonoids from Ginkgo biloba extracts (Aqeel et al., 2012)
Simultaneous identification of characteristic components in HPLC- PDA-ELSD fingerprint profile of Ginkgo biloba leaves
extract
(Wan et al., 2019)
Isolation of flavonoids from Ginkgo biloba leaf using the waters prep 150 LC system
(Aubin, 2013)
Analysis of terpenelactones in Ginkgo biloba by High performance liquid chromatography and evaporative light
scattering detection
(Anzera et al., 2001)
Quantitative analysis of the flavonoid glycosides and terpenetrilactones in the extract of Ginkgo biloba and evaluation of their inhibitory activity towards fibril formation of β-Amyloid
Peptide
(Xie et al., 2014)
Phytomedicine: An effective identification and quantification method for Ginkgo bilobaflavonol glycosides with targeted
evaluation of adulterated products
(Ma et al., 2016)
Comparative Study on the Pharmacokinetics of Ginkgo biloba Extract between Normal and Diabetic Rats by HPLC-DAD
(Tang et al., 2009)
Screening and Identifying Antioxidative Components in Ginkgo biloba Pollen by DPPH- HPLC-PAD Coupled with HPLC-ESI-
MS 2
(Qiu et al., 2017)
Chapter 3 Methodology
3.1 Collection and Authentication
After numerous plant studies and having reviewed many literatures, it was strongly observed that many individual and combined studies have been conducted on the plant. Many studies have been conducted to investigate the antioxidant activity of methanolic extract of Ginkgo biloba. Fortunately, antioxidant activity of aqueous extract has not yet been investigated. It was decided to be selected for in-vitro antioxidant activity study of Ginkgo biloba with the help of comprehensive literature study of this plant from two selected commercially marketed drug samples in Bangladesh. The two commercially available drug samples were bought from a local authorized pharmacy shop in Mohakhali, Dhaka. General description of these two marketed samples is listed in below table 3.
Table 3: Description of the two commercially available drugs in Bangladesh market
Sample no Dosage form Dose (mg)
Dosage and administration
Batch no
Sample 1 Capsule 60 For adults:
120-240 mg/day 1 or 2 capsules (2 to 3
times daily)
8MO2112
Sample 2 Capsule 60 003
3.2 Phytochemical Tests Performed
Preliminary phytochemicals screening was performed following by the methodology (Hossain et al., 2013) and (Gul et al., 2017).
3.2.1 Test for Alkaloids:
a) Mayer’s test: 1 mL from both extracts was taken in separate test tubes with the addition of Mayer’s reagent (Potassium Mercuric Iodide Solution) drop by drop. The deposition of a white color precipitation designates the existence of alkaloids.
b) Wagner’s test: 1 mL from both extracts was taken in separate test tubes and 1 mL of Wagner’s reagent were introduced. Development of a brown or reddish-brown color precipitation confirms existence of alkaloids.
c) Hager’s test: 1 mL from both extracts were taken in separate test tubes and few drops of Hager’s (Saturated picric acid solution) reagent was added which gave bright yellow shaded precipitate and designates the existence of alkaloids.
3.2.2 Test for Glycosides:
a) Molish’s test: To both extracts, about 2-3 droplets of molish reagent were added further and the mixtures were mixed properly. Now to these mixtures few drops of conc. H2SO4 were introduced cautiously. Reddish-purple shaded ring development at the intersection of two layers displays existence of glycosides.
b) Conc. H2SO4 test: 1 mL of conc. H2SO4 was added with 1 mL from both extracts and permitted to standstill for 2 minute which gives a reddish color precipitate specifies the existence of glycosides.
c) Keller Killiani test: 1 mL of both extracts were dissolved in 1 mL of glacial acetic acid and further cooled for few minutes. After cooling 2-3 droplets of ferric chloride accompanying with 2 mL of concentrated H2SO4 was added. A reddish-brown shaded disc development intersecting the two covers confirms existence of glycosides.
3.2.3 Test for Tannins:
a) Ferric chloride test: Both extracts were used to treat separately with couple of drops of FeCl3 solution. Construction of black color precipitation designates existence of tannins.
b) Lead acetate test: 1-2 mL of both extracts was treated with basic lead acetate.
Construction of bulky red color precipitation designates the existence of tannins.
c) Alkaline Reagent test: A mixture of Sodium hydroxide used for treating 1-2 mL of both extracts. Construction of yellow to red color designates existence of tannins.
3.2.4 Test for Flavonoids:
a) Zinc-HCl reduction test: In both extracts, a nip of zinc powder accompanying with few droplets of conc. HCl was added. Construction of deep red color designates existence of flavonoids.
b) Lead-acetate test: 1-2 mL of both extracts was treated with basic lead acetate.
Construction of reddish-brown color precipitation designates existence of flavonoids.
c) FeCl3 test: 1-2 mL of both extracts was treated with neutral ferric chloride solution.
Construction of blackish red color precipitation designates existence of flavonoids.
3.2.5 Test for Sterols:
a) Liebermann-Burchard test: In 1-2 mL of both extracts, a few droplets of solution of acetic anhydride were introduced. Further addition of few droplets of conc. H2SO4
along the walls of the test tube was done cautiously. Construction of reddish-brown color ring at the intersection of two layers designates existence of steroids.
b) Salkowski test: In 1-2 mL of both extracts, 5 mL of chloroform accompanying with 1 mL of conc. H2SO4 was introduced cautiously sideways of the tube with mixing.
Construction of reddish color in the bottom layer indicates the presence of steroids.
3.2.6 Test for Coumarin:
a) Fluorescence test: 1-2 mL of both extracts was taken in separate tubes to be enclosed with a piece of paper soaked in NaOH and further heated. After heating, these tubes yielding a yellow fluorescence under UV light designates existence of coumarins.
b) NaOH test: About 1.5 mL of 10% NaOH was added to 1 mL of both extract solutions. The formation of yellow color indicates the presence of coumarin.
3.2.7 Test for Resins:
In both extracts, 3-4 mL of solution of CuSO4 was introduced with vigorous shaking for 1-2 minutes. The mixture was then kept until separation. Construction of green color precipitation designates existence of resins.
3.2.8 Test for Phenols:
a) Ellagic acid test: Couple of droplets of 5% (w/v) glacial acetic acid accompanied with 5% (w/v) mixture of NaNO2 was added in1 mL of both extracts. Construction of muddy brown color designates existence of phenols.
b) Phenol test: 2 mL of both extracts were individually treated with 1 mL solution of FeCl3. Construction of an intense color designates existence of phenols.
3.2.9 Test for Saponins:
5 mL of both samples were taken in separate test tubes and shaken vigorously for obtaining stable froth. 5-6 droplets of olive oil were introduced to these frothy solutions. Construction of an emulsion designates existence of saponins.
3.2.10 Test for Terpenoids:
2 mL of chloroform was added with 5 mL of both aqueous extract and evaporated on the water bath and then boiled with 3 mL of conc. H2SO4. A grey/brownish color formed which showed the entity of terpenoids.
3.3 In-vitro Antioxidant Assay Performed
There are various in-vitro methods for estimation of antioxidant activities of plant extracts (Alam et al., 2013). Among all of the various methods, these four methods were selected to estimate the antioxidant activity of the aqueous extract of the selected samples.
DPPH free radical scavenging assay
total phenolic content (TPC)
total flavonoid content (TFC) and
total antioxidant capacity (TAC)
3.3.1 DPPH (1, 1-diphenyl-2-picryl hydrazyl) Free Radical Scavenging Assay
The DPPH free radical scavenging assay of aqueous extract of Ginkgo biloba from two marketed samples was determined using the method described by (Lalhminghlui & Jagetia, 2018).
3.3.1.1 Reagents and chemicals:
The reagents and chemicals for the determination of DPPH scavenging activity are listed below in table 4 with their chemical source.
Table 4: Reagents and chemicals required to determine DPPH scavenging activity
Name of reagent/chemical Source
DPPH Sigma Aldrich U.S.A
Methanol Active Fine Chemicals Ltd, Bangladesh
L Ascorbic acid Merck, Germany
3.3.1.2 Reagent Preparation:
0.004% (w/v) DPPH solution was prepared by dissolving 2mg of DPPH in 50mL methanol to give purple colored solution and then stored in the refrigerator at -4°C till before use.
3.3.1.3 Sample and Standard Solution Preparation:
Stock solutions: 120mg of extract of sample 1 and sample 2 was individually measured and dissolved in 10mL of distilled water to produce a concentration of 12 mg/mL. This became the sample stock solution 1 and stock solution 2.
Sample solutions: The Concentrations of sample 1 and 2 were prepared by serial dilution of the sample stock solutions to derive 6 serially diluted concentrations: 1200, 800, 400, 200, 100 and 50.
Standard solutions: The standard used was L-ascorbic acid and it was prepared in the same manner as the extract resulting in 6 serially diluted concentrations, ranging from 1200-50 µg/mL.
Blank solution: Blank was also prepared for the investigation by mixing 2 mL of methanol and 1 mL of distilled water.
3.3.1.4 Experimental Procedure:
(a) 1mL of each of the fractions of two samples and standard (L-ascorbic acid) were taken in 3 separate test tubes.
(b) To each of the test tubes, 2mL of 0.004% (w/v) DPPH solution was added.
(c) Then, the test tubes were incubated for 30 minutes at room temperature.
(d) After that, the absorbance of the resulting solutions and control (DPPH and methanol) were measured at 517nm against blank using a spectrophotometer (U-1800 SHIMADZU UV- Vis Spectrophotometer).
(e) The percentage of free radical scavenging activity (% FRS) was then calculated from the equation as follows:
% Free radical Scavenging (%FRS) activity = (A0− A1) A0 × 100 Where,
A0 = absorbance of the control
A1 = absorbance of the sample/standard
(f) Finally, the % Scavenging activity was plotted against concentration from which IC50 value was calculated (IC50 value is defined as the concentration at which 50% of total DPPH free radical is reduced by the antioxidants which can be determined by plotting % inhibition against the corresponding concentrations).
3.3.2 Determination of Total Phenolic Content (TPC)
The TPC of the plant extract of mixture of sample 1 and 2 was determined by the modified Folin-Ciocalteu method (Chandra et al., 2014).
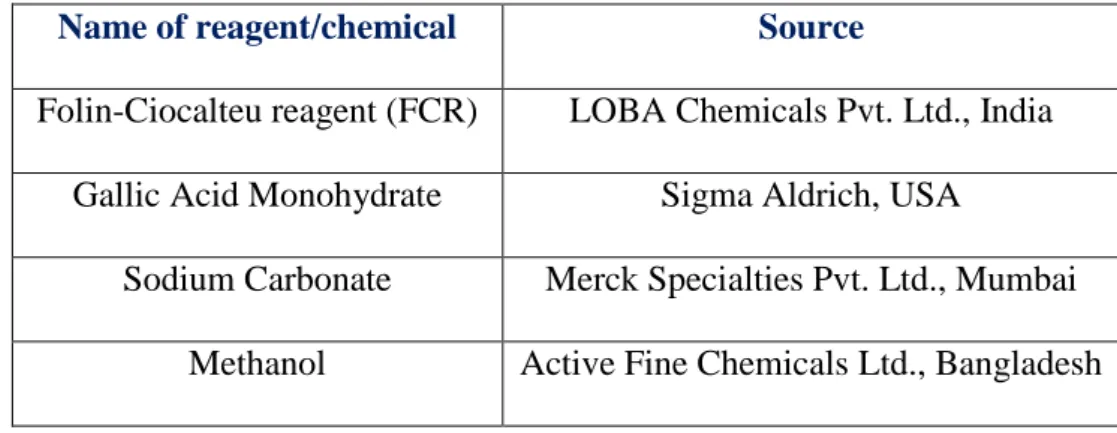
3.3.2.1 Reagents and Chemicals:
The reagents and chemicals for the determination of total phenolic content is listed below in Table 5.
Table 5: Reagents and chemicals required to determine total phenolic content
Name of reagent/chemical Source
Folin-Ciocalteu reagent (FCR) LOBA Chemicals Pvt. Ltd., India Gallic Acid Monohydrate Sigma Aldrich, USA
Sodium Carbonate Merck Specialties Pvt. Ltd., Mumbai Methanol Active Fine Chemicals Ltd., Bangladesh 3.3.2.2 Reagent Preparation:
FCR solution: 20mL of 10% Folin-Ciocalteu reagent (FCR) solution was prepared by taking 2mL of FCR in a volumetric flask and diluting it with distilled water.
Na2CO3 solution: 100mL of 7.5% (w/v) Sodium carbonate was prepared by measuring out 7.5g of Na2CO3 in a 100mL volumetric flask and then diluting it with distilled water to 100mL mark.
3.3.2.3 Sample and Standard Solution Preparation:
Stock solutions: 120mg of two sample extracts were measured and dissolved in 10mL of methanol to produce a concentration of 12mg/mL. This became the sample stock solution.
Sample solutions: The sample concentrations were prepared by serial dilution of the sample stock solution to derive four serially diluted concentrations: 1200, 800, 400 and 200µg/mL.
Standard solutions: Gallic acid was used as the standard and the stock solution was prepared in the same manner as the extract resulting in four serially diluted concentrations, ranging from 1200, 800, 400 and 200µg/mL.
3.3.2.4 Preparation of the Blank:
The blank solution contained the same volume of FCR solution and sodium carbonate was used in the experiment i.e. 5mL and 4mL, respectively, and 1mL of distilled water was used
to make the volume up to 10mL.
3.3.2.5 Experimental Procedure:
(a) 1mL of each of the fractions of two samples and standard (Gallic acid) concentrations were taken in 3 separate test tubes.
(b) To which 2.5mL of FCR solution was added.
(c) 2.5mL of sodium carbonate solution was added.
(d) Then each of the mixtures was vortexed for 15s and then allowed to stand for 30min at 40°C in a water bath.
(e) Finally, the absorbance of standard and sample solutions was measured against blank at 765nm using spectrophotometer (U-1800 SHIMADZU UV-Vis Spectrophotometer).
(f) The total phenolic content, C, for each of the fractions was expressed as Gallic Acid Equivalents (GAE) using the following equation:
C= (c x V)/m Where,
C = Total content of phenolic compounds, milligram of Gallic acid per gram of dried plant extract, expressed as Gallic Acid Equivalent (GAE)
c = Concentration of Gallic acid obtained from calibration curve (mg/mL) V = Volume of sample solution (mL)
m = Weight of the sample (g)
The experiment was repeated to confirm reproducibility.
3.3.3 Determination of Total Flavonoid Content (TFC)
The total flavonoid content of the extract of Ginkgo biloba from two marketed products was determined according to the following method (Rebaya et al., 2015).
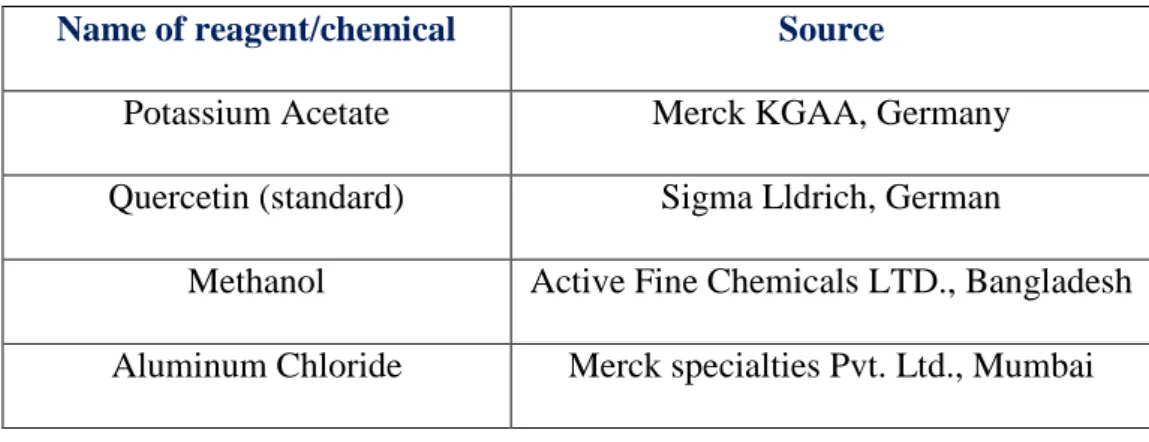
3.3.3.1 Reagents and Chemicals:
The reagents and chemicals for the determination of total flavonoid content are listed below in Table 6.
Table 6: Reagents and chemicals required to determine total flavonoid content
Name of reagent/chemical Source
Potassium Acetate Merck KGAA, Germany
Quercetin (standard) Sigma Lldrich, German
Methanol Active Fine Chemicals LTD., Bangladesh Aluminum Chloride Merck specialties Pvt. Ltd., Mumbai
3.3.3.2 Reagent Preparation:
AlCl3 solution: 100mL of 10% aluminum chloride solution was prepared by measuring 10g of aluminum chloride in a 100mL volumetric flask and diluting it with distilled water to 100mL mark.
C2H3KO2 solution: 100mL of 1M potassium acetate solution was prepared by measuring 9.815g of potassium acetate in a 100mL volumetric flask and diluting it with distilled water up to 100mL mark.
3.3.3.3 Sample and Standard Solution Preparation:
Stock solutions: 120mg of both sample extract was measured and dissolved in 10mL of
distilled water to produce a concentration of 12mg/mL. This became the sample stock solution.
Sample solutions: The two sample concentrations were prepared by serial dilution of the sample stock solution to derive 4 serially diluted concentrations: 1200, 800, 400 and 200µg/mL.
Standard solutions: Quercetin was used as the standard and the stock solution was prepared in the same manner as the extract resulting in four serially diluted concentrations, ranging from 1200, 800, 400 and 200µg/mL.
3.4.3.4. Preparation of the Blank:
The blank solution contained 200µL of 10% aluminium chloride solution, 200µL of 1M potassium acetate solution and 9.6mL of distilled water such that the final volume of the solution was 10mL.
3.3.3.5 Experimental Procedure:
(a) 1mL of each of the fractions of two samples and standard (Quercetin) concentrations were taken in test tubes.
(b) To which 3mL of distilled water was added.
(c) And 200µL of 10% aluminium chloride solution and 200µL of 1M potassium acetate solution was added to each of the test tubes using 1000µL micropipette.
(d) Finally, 8.6mL of distilled water was added to the test to make the final volume of the solution 10mL.
(e) The test tubes were then incubated at room temperature for 30min.
(f) Afterwards, the absorbance of each of the sample and standard solutions were measured at
415nm against blank using spectrophotometer (U-1800 SHIMADZU) UV-Vis Spectrophotometer).
(g) The total flavonoid content, C, for each of the fractions were expressed as Quercetin equivalents (QE) using the following equation:
C = (c × V)/m Where,
C = Total content of flavonoid compounds, milligrams of quercetin per gram of dried plant extract, expressed as quercetin equivalents (QE)
c = Concentration of Gallic acid obtained from calibration curve (mg/mL) V = Volume of sample solution (mL)
m = Weight of the sample (g)
The experiment was repeated to confirm reproducibility.
3.3.4 Determination of Total Antioxidant Capacity (TAC)
The total Antioxidant capacity of the extract of Ginkgo biloba from two marketed productswas determined by using the following method (Prieto et al., 1999).
3.3.4.1 Reagents and Chemicals:
The reagents and chemicals for the determination of total antioxidant capacity are listed below in table 7.
Table 7: Reagents and chemicals required to determine total antioxidant capacity
Name of reagent/chemical Source
Ammonium Molybdate Active Fine Chemicals Ltd., Bangladesh
L-ascorbic acid Merck, Germany
Trisodium Phosphate (Na3PO4.12H2O) Merck, Germany
Concentrated Sulfuric Acid Merck, Germany
Methanol Active Fine Chemicals Ltd., Bangladesh 3.3.4.2 Reagent Preparation:
H2SO4 solution: 100mL of 0.6M Sulfuric acid was prepared by measuring 3.28mL of 98%
concentrated sulfuric acid in a 100mL volumetric flask and diluting it with distilled water to 100mL mark.
(NH4)2MoO4 solution: 100mL of 0.004M ammonium molybdate solution was prepared by measuring 4.494g of ammonium molybdate in a 100mL volumetric flask and diluting it with distilled water up to 100mL mark.
Na3PO4.12H2O solution: 100mL of 0.028M trisodium phosphate solution was prepared by measuring 1.0645g of trisodium phosphate in a 100mL volumetric flask and diluting it with distilled water to 100mL mark.
3.3.4.3 Sample and Standard Solution Preparation:
Stock solutions: 120mg of both extracts were measured and dissolved in 10mL of distilled water to produce a concentration of 12mg/mL. This became the sample stock solution.
Sample solutions: The sample concentrations were prepared by serial dilution of the sample stock solution to derive 4 serially diluted concentrations: 1200, 800, 400 and 200µg/mL.
Standard solutions: Ascorbic acid was used as the standard and the stock solution was prepared in the same manner as the extract resulting in four serially diluted concentrations,
ranging from 1200, 800, 400 and 200µg/mL.
3.3.4.4 Preparation of the Blank:
3mL of reagent solution (0.6M sulfuric acid, 0.028M sodium phosphate and 0.004M ammonium molybdate) and 300µL of distilled water was used for preparing the blank solution.
3.3.4.5 Experimental Procedure:
(a) 300µL of each of the fractions of both samples and standard (L-ascorbic acid) concentrations were taken in 3 separate test tubes.
(b) 3mL of prepared reagent solution was added into the test tubes.
(c) The test tubes (sample, standard and blank) were then incubated at 95°C in a water bath for 90min.
(d) Finally, the absorbance of the sample and standard solutions was measured against blank at 695nm using spectrophotometer (U-1800 SHIMADZU UV-Vis Spectrophotometer).
(e) The total antioxidant capacity, A, for each of the fractions was expressed as Ascorbic Acid Equivalents (AAE) using the equation as follows:
C = (c × V)/m Where,
C = Total antioxidant capacity, milligram of ascorbic acid per gram of dried plant extract, expressed as ascorbic acid equivalent (AAE)
c = Concentration of ascorbic acid obtained from calibration curve (mg/ mL) V = Volume of sample solution (mL)
m = Weight of the sample (g)
The experiment was repeated to confirm reproducibility.
3.4 High Performance Liquid Chromatography (HPLC) Profiling
High Performance Liquid Chromatography (HPLC) was performed to quantitatively identify the constituents quercetin and kaempferol following by the methodology (United &
Pharmacopeia, 2018).
3.4.1 Materials, reagents and solvents:
The materials, reagents and solvents for the determination of high performance liquid chromatography are listed below in table 8.
Table 8: Materials, reagents and solvents required to determine HPLC profiling
Materials Reagents Solvents
Reflux condenser (250 mL) Phosphoric acid Methanol Water bath Quercetin Hydrochloric acid (HCl) Volumetric flask (100 mL) Kaempferol Distilled water 3.4.2 Extraction Solvent Preparation:
Extraction solvent was prepared by mixing methanol, hydrochloric acid (HCl) and distilled water in a 100 mL volumetric flask in a ratio of 25:4:10.
3.4.3 Mobile Phase Preparation:
Mobile phase was prepared by mixing methanol, water and phosphoric acid in a 100 mL volumetric flask in a ratio of 100:100:1.
3.4.4 Standard Solution Preparation:
Standard solution A: 0.02 mg of USP Quercetin RS was measured and dissolved in
1 mL methanol.
Standard solution B: 0.02 mg of USP Kaempferol RS was measured and dissolved in 1 mL methanol.
3.4.5 Sample Solution Preparation:
(a) 1.0g of the both finely powdered marketed samples of Ginkgo biloba were transferred to a 250 mL reflux condenser and flask fitted.
(b) 78 mL of the extraction solvent (methanol, HCl and water in 25:4:10) was added in the reflux condenser.
(c) The reflux was put on a hot water bath for 35 min until the solution will turn into deep red and allowed to cool at room temperature which was decanted to a 100mL volumetric flask.
(d) Again, 20mL of methanol was added to the 250mL flask and sonicated for 30 minutes.
(e) It was then filtered and the filtrate was collected in the 100 ml volumetric flask.
(f) The residue was washed on the filter with methanol and the washing was collected in the same 100 mL volumetric flask which was later diluted with methanol to volume and mix.
(g) Then, 20µL solution was taken as injection volume to detect chromatography at UV 370 nm at 1.5mL/min flow rate on LC mode through 4.6mm×25cm (packing L1) column. It is noted here that the relative retention times for standard solution A, Quercetin and standard solution B, Kaempferol are about 1.0 and 1.8 respectively.
(h) Finally, the total percentage of each flavone glycoside in the portion of Ginkgo taken from the two samples was then calculated from the equation as follows:
Result = (r
u/r
s) ×(Cs/W) ×F×10
Where,
ru = Peak area of the relevant analyte from the Sample solution
rs = Peak area of the relevant analyte from the Standard solution A/ Standard solution B Cs = Concentration of the relevant analyte in Standard solution A/ Standard solution B W = Weight of sample taken to prepare the Sample solution.
F = Mean molecular mass factor to convert each analyte into flavone glycoside with a mean molecular mass of 756.7: 2.504 for Quercetin and 2.588 for Kaempferol.
Chapter 4 Result
4.1 Preliminary Phytochemical Screening Result
The result of preliminary phytochemical screening tests of aqueous extracts of Ginkgo biloba from two marketed products is listed below in table 9 where (+) sign means presence and (-) sign means absence of compounds in screening tests.
Table 9: Result of phytochemical screening tests
SL No Phytochemical Tests Name Sample 1 Sample 2
01. Test for Alkaloids Mayer’s test _ _
Wagner’s test _ _
Hager’s test _ _
02. Test for Glycosides Molisch’s test _ _
Keller Killiani test _ _
Conc. H2SO4 test _ _
03. Test for Tannins Ferric chloride test + +
Lead-acetate test + +
Alkaline reagent test + +
04. Test for Flavonoids Zinc-HCl reduction test + +
Lead-acetate test + +
FeCl3 test + +
Alkaline reagent test + +
05. Test for Sterols Liebermann-Burchard test _ _
Salkowski test _ _
06. Test for Coumarin Fluorescence test + +
NaOH test + +
07. Test for Resins CuSO4 test _ _
08. Test for Phenols Ellagic acid test + +
Phenol test + +
09. Test for Saponins Froth test _ _
10. Test for Terpenoids Terpenoid test + +
4.2 Evaluation of Antioxidant Activity
4.2.1 DPPH ((1, 1-diphenyl-2-picryl hydroxyl) Free Radical Scavenging Assay
Figure 5: DPPH free radical scavenging assay
Standard Ascorbic acid (ASA):
The concentration to produce 50% reduction of the DPPH (IC50) value by Standard (ASA) depending on the concentration and absorbance values are given below in the table 10.
Table 10: IC50 value of DPPH free radical scavenging assay by standard (L-ascorbic acid)
Absorbance of the control
Concentration (µg/mL)
Absorbance of the standard
Average of the absorbance
% of inhibition (%SCV) = (A0-A1) A0×100
IC50
(µg/mL) x= (y-c)/m
0.885
50
0.620
0.639 27.797
300.504 0.657
0.641
100
0.533
0.534 39.661
0.494 0.575
200
0.415
0.420 52.542
0.434 0.412
400
0.347
0.347 60.790
0.343 0.351
800
0.205
0.206 76.723
0.211 0.202
1200
0.135
0.127 85.650
0.121 0.126
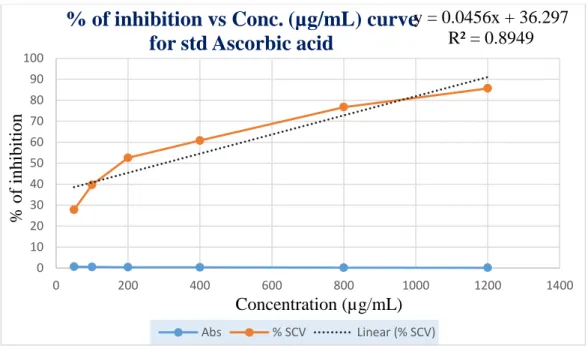
The percentage of inhibitions that was found from the above table 10 was plotted against concentrations in a calibration graph. Graphical presentation of % of inhibition of DPPH by
Standard (L-Ascorbic acid) is shown below in figure 6.
Figure 6: Standard curve of std (ASA) for DPPH free radical scavenging assay
Sample 1:
The concentration to produce 50% reduction of the DPPH (IC50) value by Sample 1 depending on the concentration and absorbance values are given below in the table 11.
Table 11: IC50 value of DPPH free radical scavenging assay by sample 1
Absorbance of the control
Concentration (µg/mL)
Absorbance of sample 1
Average of the absorbance
% of inhibition (%SCV) = (Ao-A1)Ao*100
IC50
(µg/mL) x= (y-c)/m
50
0.790
0.760 14.124
0.769 0.721
100
0.707
0.708 20
0.712
y = 0.0456x + 36.297 R² = 0.8949
0 10 20 30 40 50 60 70 80 90 100
0 200 400 600 800 1000 1200 1400
% of inhibition
Concentration (µg/mL)
% of inhibition vs Conc. (µg/mL) curve for std Ascorbic acid
Abs % SCV Linear (% SCV)
0.885
0.705
561.655 200
0.587
0.569 35.706
0.542 0.578
400
0.467
0.469 47.005
0.464 0.475
800
0.366
0.365 58.757
0.349 0.381
1200
0.079
0.106 88.022
0.112 0.127
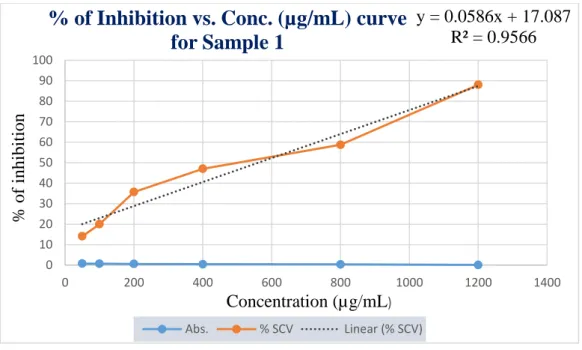
The percentage of inhibitions that was found from the above table 11 was plotted against concentrations in a calibration graph. Graphical presentation of % of inhibition of DPPH by Sample 1 is shown below in figure 7.
Figure 7: Standard curve of sample 1 for DPPH free radical scavenging assay
Sample 2:
The concentration to produce 50% reduction of the DPPH (IC50) value by Sample 2 depending on the concentration and absorbance values are given below in the table 12.
Table 12: IC50 value of DPPH free radical scavenging assay by sample 2
Absorbance of the control
Concentration (µg/mL)
Absorbance of sample 2
Average of the absorbance
% of inhibition (%SCV) = (Ao-A1)Ao*100
IC50 (µg/mL) x= (y-c)/m
50
0.847
0.850 3.954
0.851 0.852
100
0.720
0.749 15.367
0.769 0.758 0.403
y = 0.0586x + 17.087 R² = 0.9566
0 10 20 30 40 50 60 70 80 90 100
0 200 400 600 800 1000 1200 1400
% of inhibition
Concentration (µg/mL)
% of Inhibition vs. Conc. (µg/mL) curve for Sample 1
Abs. % SCV Linear (% SCV)
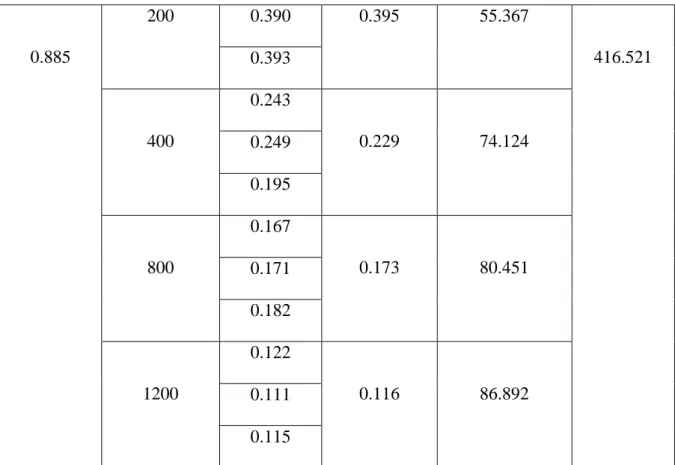
0.885
200 0.390 0.395 55.367
416.521 0.393
400
0.243
0.229 74.124
0.249 0.195
800
0.167
0.173 80.451
0.171 0.182
1200
0.122
0.116 86.892
0.111 0.115
The percentage of inhibitions that was found from the above table 12 was plotted against concentrations in a calibration graph. Graphical presentation of % of inhibition of DPPH by Sample 2 is shown below in figure 8.
Figure 8: Standard curve of sample 1 for DPPH free radical scavenging assay y = 0.0641x + 23.301
R² = 0.6873
0 20 40 60 80 100 120
0 200 400 600 800 1000 1200 1400
% of inhibition
Concentration(µg/mL)
% of inhibition vs. Conc. (µg/mL) curve for Sample 2
Abs. % SCV Linear (% SCV)
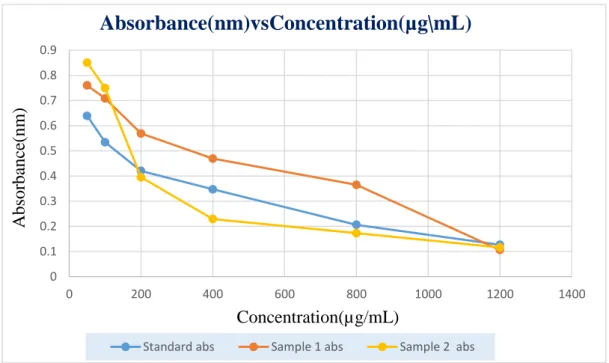
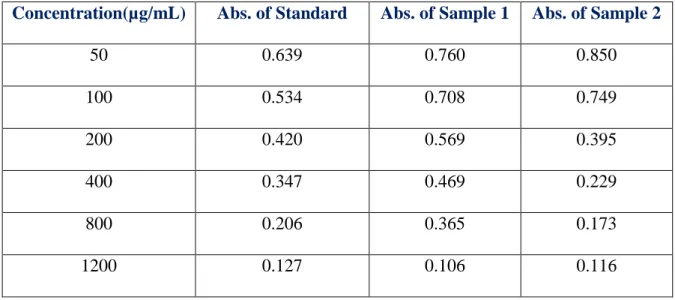
Lastly, a comparison data of Absorbance(nm) vs Concentration(µg/mL) value for Standard Ascorbic acid, Sample 1 and Sample 2 in DPPH assay is given below in table 13.
Table 13: Comparison of absorbances for different concentrations in DPPH assay
Concentration(µg/mL) Abs. of Standard Abs. of Sample 1 Abs. of Sample 2
50 0.639 0.760 0.850
100 0.534 0.708 0.749
200 0.420 0.569 0.395
400 0.347 0.469 0.229
800 0.206 0.365 0.173
1200 0.