Routine milk quality control is most important to ensure the public supply of fresh, clean, pure and healthy milk and milk products. In this way market milk can be examined for water adulteration or milk skimming (removal of fat). Changes in the standard physical properties of milk help to suspect the culprits present in the milk.
So there is always a chance of adding chemical preservatives in the milk as a malpractice by the middlemen/baperies to increase the commercial life of the milk. The milk protein is not a single compound, but comprises three main proteins, namely casein (80% of the total protein) and lactalbumin (18%) and lactoglobulin (2%). Water makes up the largest fraction of milk and varies from 80 to 90% depending on species and breed.
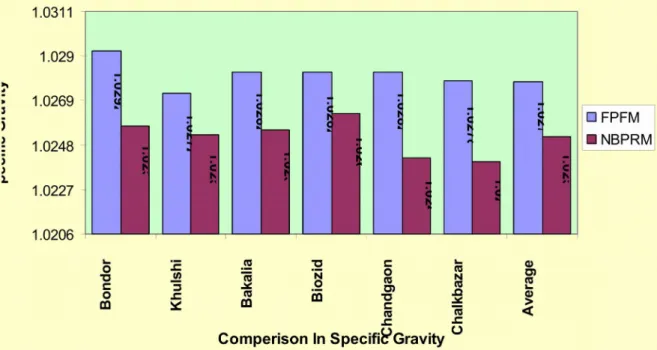
Water acts as a carrier for all the ingredients of milk. 2009) found in their study that the specific gravity of milk from different sources of Chittagong metropolitan area ranged from 1.025 to 1.028 and that the supplier who supplied rural milk had the lowest value. 2007) showed in a comparative study that the specific weight of milk does not differ significantly in different months of the year. 1984) reported that the specific gravity of milk obtained from BAU Dairy Farm and Local market was 1.031 and 1.026 respectively. Rahman (1995) observed that the mean fat% of milk samples collected from Baghabarighat Dairy plant was 4.28±0.028.
Rahman (1995) observed that the average SNF content of milk collected from pasteurization plant and Baghabarighat dairy was 7.96%, respectively. 1984) also reported lower % SNF in local market milk than milk from BAU Dairy Farm, Mymensingh.
Materials and Methods
Collection of Sample
- Number of Samples
- Procedure of sampling
Methods followed for milk testing
The chemical tests for added preservatives in milk were carried out by milk test rapid examination.
Results and Discussion
- Physical and Chemical Quality Assessment
- Specific Gravity
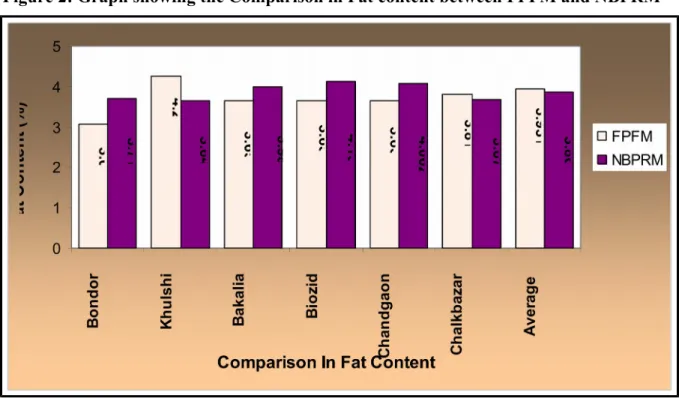
- Fat Content
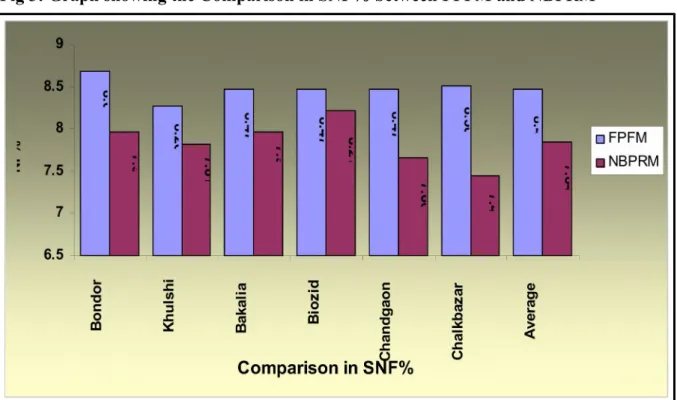
- Solids -Not -Fat Content (SNF)
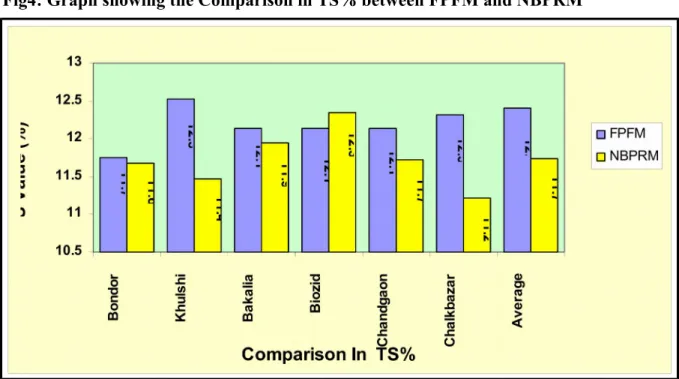
- Total Solids (TS)
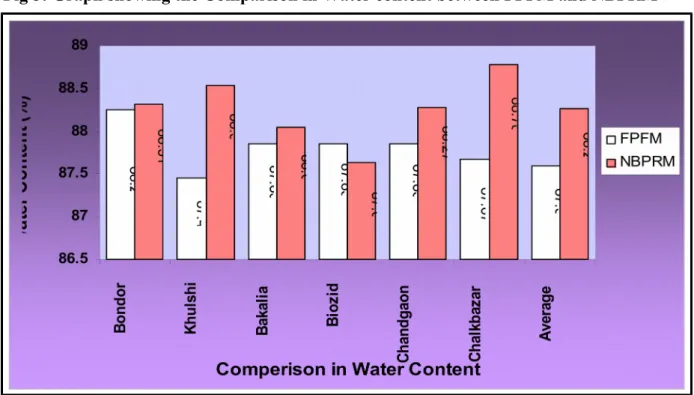
- Water Content
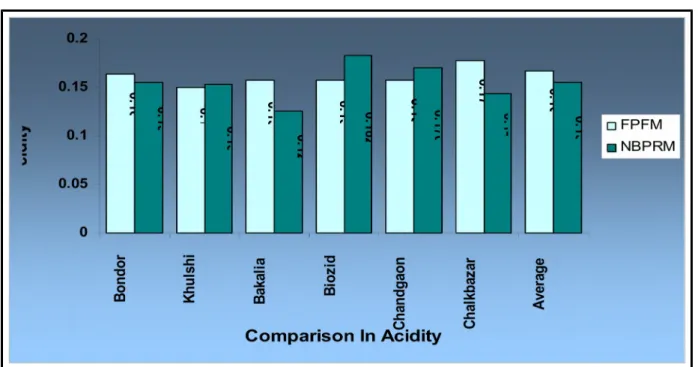
- Acidity
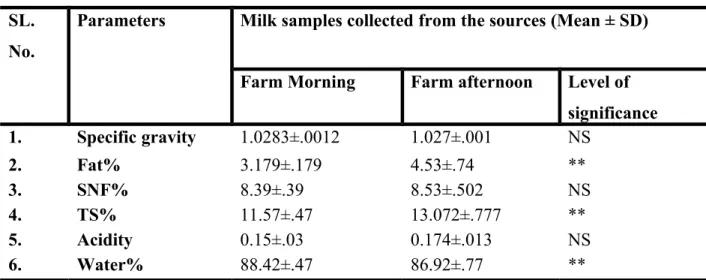
- Qualitative variation of Morning and afternoon Milk
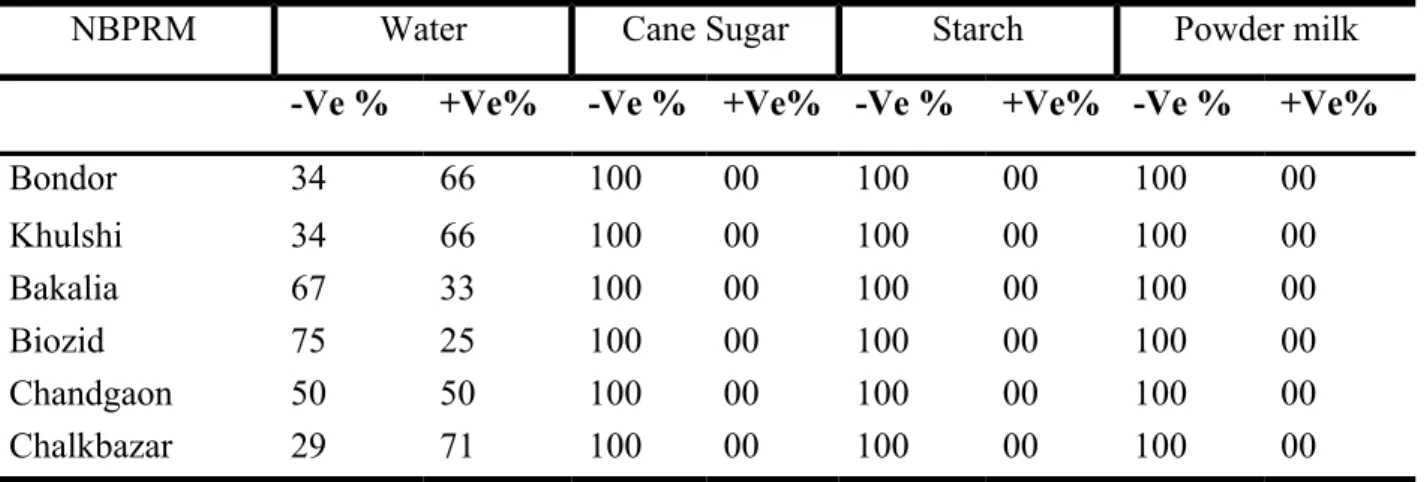
- Adulteration
- Commercial life
This may be due to differences in breed and feeding problems with the cows. The fat percentage of NBPRM was satisfactory, and statistically there is no significant difference between FPFM and NBPRM, but lower SNF content (Table 2) indicates that afternoon milk was generally used for packing raw milk, since afternoon milk contains much higher fat than morning milk (table 2) 3). The SNF percentage of FPFM corresponded to the parameter of UPHA (1965) and the results of Itzerot (1960).
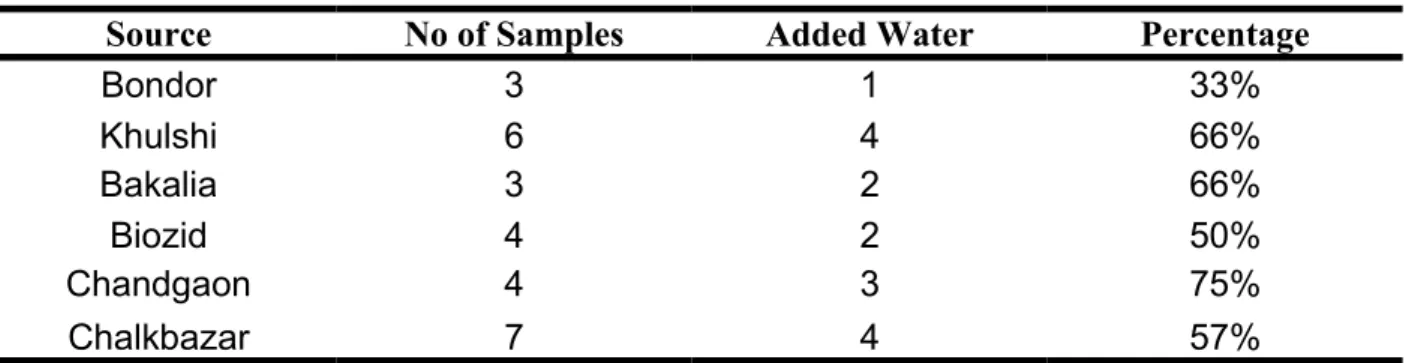
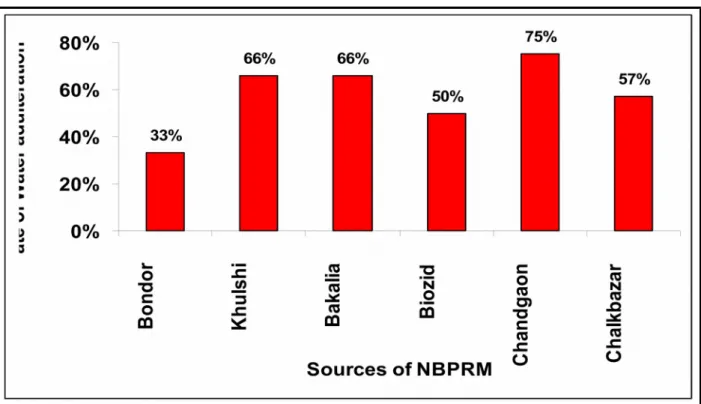
Most of the samples of NBPRM did not meet the SNF% as per PFA regulations (1986). But the result was close to the experimental results of Rahman (1995). The SNF% of NBPRM was significantly lower than FPFM. In the case of NBPRM, the fat percentage is not as such as the results of Rahman (1995), so from the above considerations, the lower SNF% may be a result of adulteration of milk with water.
This result of lower percentage of SNF is consistent with the results of Judking and Keener (1966) and Islam et al (1984), where they reported that less than 7.9-8% of SNF containing milk was adulterated with water. The TS percentage of most of the FPFM samples was satisfactory, which is similar to the results of Yadav and Sarwat (1982) and Islam et al (1984), who found lower total solids in milk from local markets (8.5 -12%). The higher water content of non-branded market milk indicates that they have been adulterated with water.
The result of high water content in market milk is consistent with the results of Islam et al. 1984), who found higher water content in milk 89.9% collected from local markets of Mymensingh city. High acid content in most FPFM and NBPRM indicates unhygienic milking conditions and unsatisfactory milk shelf life. Statistically significant difference was found between the quality of FPFM in samples collected in the morning and in the afternoon.
There is no statistical variation found in terms of density and SNF% of the morning and afternoon milk, which describes the reason for higher fat percentage in afternoon milk. Since FPFM was collected directly from the farm, the adulteration test was not performed in these samples. Since FPFM was collected directly from the farm, the test for preservative detection was not performed in these samples.
The presence of formalin in the samples proves the authenticity of the findings of Debnath et al. Of the 27 NBPRM samples tested within 4 hours of collection, 10 samples tested positive for the APT (Alcohol Precipitation Test).
Summary and Conclusion
- Addition of the sulfuric acid into the butyrometer
- Mixing of sample
- Measurement of the Sample
- Addition of amyl alcohol
- Insertion of stopper
- Mixing of the contents
- Centrifuging
- Temperature adjustment
- Reading of percentage of fat
- Checking of the reading
- Cane sugar Detection
- Starch Detection
- Milk powder Detection
- Formalin Detection
- Hydrogen peroxide detection
- Bicarbonate detection
Elaborate on the assessment of the chemical quality of milk from primary cooperatives (Milk Vita). The Indian Journal of Dairy Sci. 1995) quality of milk from different cold stores. A study on physical and chemical quality of milk collected from different markets and villages of trisal Upazilla.
Determination of fat in milk: The fat percentage of the milk sample was determined using the Gerber Fat Test Method. The mixture is then centrifuged in a special type of Gerber tube. The volume of fat secreted is then read on the graduated portion of the butyrometer tube at a fixed temperature. We measured 10 ml of sulfuric acid in a butyrometer with an automatic meter.
Care is taken not to wet the neck of the butyrometer with acid. 11 ml of milk was pipetted at a temperature of approximately 200 C into the butyrometer, using the standard pipette. During the delivery of milk, the pipette was held by current in the neck of the butyrometer.
The tip was then stroked to keep the jet at the bottom of the neck of the butyrometer from getting wet. 1 ml of amyl alcohol was measured into the butyrometer with a standard alcohol pipette. The neck of the butyrometer was moistened with alcohol. The butyrometer was placed in a protected stand until the contents were thoroughly mixed and no more white particles were visible.
In the water level was kept above the top of the fat column in the butyrometer. Before a reading was taken, the position of the fat columns was adjusted to bring the lower end of the fat column on a main division mark, the scale readings were noted corresponding to the lowest point of the distal meniscus and to the surface of separation of fat and acid; that. When the reading was taken, the butyrometer was held with the graduated protein vertical, keeping the spot reading at eye level.
The butyrometer was replaced in the water bath for another 3 minutes and then the fat percentage reading was checked as soon as possible after leaving the bath. Then 1 ml of HCL and 0.1 g of resorcinol were added to the test tube.