IN SOME SELECTED AREAS OF SATKHIRA DISTRICT
MD. SHAMIM HOSSAIN
DEPARTMENT OF AGRICULTURAL STATISTICS
SHER-E-BANGLA AGRICULTURAL UNIVERSITY
DHAKA-1207
JUNE, 2020
AN ECONOMICS ANALYSIS OF POND FISH CULTURE IN SOME SELECTED AREAS OF SATKHIRA DISTRICT
BY
MD. SHAMIM HOSSAIN REGISTRATION NO. 12-05219
A Thesis
Submitted to the Department of Agricultural Statistics Sher-e-Bangla Agricultural University, Dhaka
in partial fulfillment of the requirements for the degree of
MASTER OF SCIENCE (MS) IN
AGRICULTURAL STATISTICS Semester:January-June, 2020
Approved by:
Hasan Mahammad Sammy
Assistant Professor Department of AgriculturalStatistics
Supervisor
Md. Zakir Hossain Professor
Department of Agricultural Statistics
Co-Supervisor
Professor Zulfikar Ahmed Reza Chairman
Department of Agricultural Statistics
Sher-e-Bangla Agricultural university, Dhaka-1207
DEPARTMENT OF AGRICULTURAL STATISTICS
Sher-e-Bangla Agricultural University Sher-e-Bangla Nagar, Dhaka-1207
CERTIFICATE
This is to certify that the thesis entitled “AN ECONOMICS ANALYSIS OF POND FISH CULTURE IN SOME SELECTED AREAS OF SATKHIRA DISTRICT”
submitted to the Faculty of Agribusiness Management, Sher-e-Bangla Agricultural University, Dhaka-1207, in partial fulfillment of the requirements for the degree of MASTER OF SCIENCE (M.S.) in AGRICULTURAL STATISTICS embodies the result of a piece of bona fide research work carried out by MD. SHAMIM HOSSAIN, Registration No. 12-05219 under my supervision and guidance. No part of this thesis has been submitted for any other degree or diploma.
I further certify that such help or source of information as has been availed of during the course of this investigation has duly been acknowledged.
Dated
Dhaka, Bangladesh
Hasan Mahammad Sammy Assistant Professor
Department of Agricultural Statistics Sher-e-Bangla Agricultural University
Dhaka-1207
Supervisor
DEDICATED TO
My Beloved
Parents
I
ACKNOWLEDGEMENTS
First of all, I would like to express my deep sense of gratitude to the Almighty Allah, the most gracious and benevolent who has made me able to perform this research work and to submit the thesis successfully for the degree of Master of Science (M.S.) in Agricultural Statistics, My deepest respect and love from the core of my heart is for “Prophet Muhammad” (SM) who is forever a torch of knowledge and guidance for humanity.
It is my pleasure to express gratitude and best regards to my respected Supervisor, Hasan Mahammad Sammy, Department of Agricultural Statistics, Sher-e-Bangla Agricultural University, Dhaka, for his continuous direction, scholastic supervision, constructive criticism, encouragement and valuable suggestions in carrying out the research work and preparation of this thesis. I was able to gather a lot of pleasant experience and enjoyed an independent working environment under his supervision.
I am conveying my earnest reverence, appraisal and enormous indebtedness to my respected Co- supervisor, Professor Md. Zakir Hossain, Department of Agricultural Statistics, Sher-e- Bangla Agricultural University, Dhaka, Bangladesh, for his sincere guidance, constructive suggestion, encouragement and amiable behavior during the whole period of study.
Special thanks went to my fellow mates and friends ShakilAkter andMd. Abdullah Al Zaber. They supported me a lot during the period of experiment and without their co- operation the whole journey might be very difficult.
I also want to acknowledge the co-operation of our lab attendants, computer operator and all other staffs of department as well as all staffs of Sher-e-Bangla Agricultural University, Dhaka, for their cordial support all time.
Finally, I recall indebtedness to my beloved parents and the family members along with relatives and well-wishers for their boundless affection prayers, encouragement, constant inspiration and moral support for his higher study. May Almighty bless and protect them all.
.
The Author
II
AN ECONOMIC ANALYSIS OF POND FISH CULTURE IN SOME SELECTED AREAS OF SATKHIRA DISTRICT
ABSTRACT
This study was designed to assess the costs, returns and profitability of pond fish farming. A total of 50 pond fish farmers were selected randomly from Chandanpur and Sonabaria union at KalaroaUpazila under Satkhira district. Both tabular and statistical analysis were done to perform the objectives of the study. It was estimated that per hectare gross cost of pond fish production was Tk.2136878.5 in which human labour, fingerlings, feed, fertilizer, insecticide, irrigation, mechanical cost, land use cost and cost on interest on operating capital items represented 1.15, 3.00, 88.00, 0.38, 0.25, 0.26, 0.51, 5.41 and 1.00 percent respectively.While gross return and net return were Tk. 3017973.4 and TK. 881094.9 per hectare respectively. The results of this study helped to know that pond fish production was profitable in the study areas.
Cobb-Douglas production function was also applied to identify the specific effects of the factors on pond fish production. Out of seven variables, threevariables human labour,irrigation, fingerlings costare positive and significant impact on pond fish production. The study also helped to realize some problems faced by the fish farmers in producing pond fish. The results suggested that if the problems could be solved, all the selected farmers could earn a much higher profit than the existing level. Finally, as apolicy measures, it may be suggested that pond farmers should be provided with, fingerlings, credit, training and reasonable product price for sustainable development of the enterprise. Some recommendations were made to improve culture and management of pond fish farming.
III
TABLE OF CONTENTS
CHAPTER TITLE PAGE NO.
ACKNOWLEDGEMENT I
ABSTRACT II
TABLE OF CONTENTS III-V
LIST OF TABLES VI
LIST OF FIGURES VII
LIST OF PLATES VIII
LIST OF APPENDICES VIII
LIST OF ABBREVIATIONS AND ACRONYMS IX
CHAPTER 1 INTRODUCTION 1-7
1.1 Fish as a Human Food 2
1.2 Fish and Bangladesh 2
1.3 Fisheries Sector: Prospects and Potentials 3
1.4 Development Activities 5
1.5 Export of Fish & Fish Products 5
1.6 Fisheries as a Tool of Population Development 6
1.7 Justification 6
1.8 Objectives 7
1.9 Outline of the Study 7
CHAPTER 2 REVIEW OF LITERATURE 8-13
2.1 Introduction 8
2.2 Research Gap 13
IV
CHAPTER TITLE PAGE NO.
CHAPTER 3 MATERIALS AND METHODS 14-23
3.1 Introduction 14
3.2 Selection of the Study Area 14
3.3 Preparation of the Interview Schedule 15
3.4 Sampling Techniques 16
3.5 Period of Data Collection 17
3.6 Categories of Farm Household Selection 17
3.7 Collection of Data 18
3.8 Processing, Tabulation and Analysis of Data 20
3.9 Analytical Techniques 20
CHAPTER 4 RESULTS AND DISCUSSION 24-45
4.1 Socio-Economic Characteristics 24
4.1.1 Introduction 24
4.1.2 Estimation of Costs and Returns 25
4.1.3 Gross Cost of Pond Fish Production 25
4.1.4 Gross Return 25
4.1.5 Gross Margin 26
4.1.6 Return Over Per Taka Investment 26
4.1.7 Benefit Cost Ratio (BCR) 27
4.2 Estimation of Costs for Using Inputs in Pond Fish
Farming 29
4.2.1Gross Cost of Pond Fish Production 34
V
CHAPTER TITLE PAGE NO.
4.3 Factors Affecting Costs, Returns and Profitability 37
4.3.1 Introduction 37
4.3.2 Factors Affecting Gross Returns 37
4.3.3 Discussion of the Result from the Model 37
4.3.4 Interpretation of Results 37
4.4 Problems and Constraints in Pond Fish Production 40
4.4.1 Introduction 40
4.4.2 Problems Faced by the Producers 40
4.4.3 Solutions to the Problems as Suggested by the
Fish Farmers 44
CHAPTER 5 SUMMARY AND CONCLUSION 46-48 5.1 Summary and Conclusion of the Study 46
5.2 Recommendations 47
5.3 Limitations 48
REFERENCES 49-53
APPENDICES 54-59
VI
LIST OF TABLES
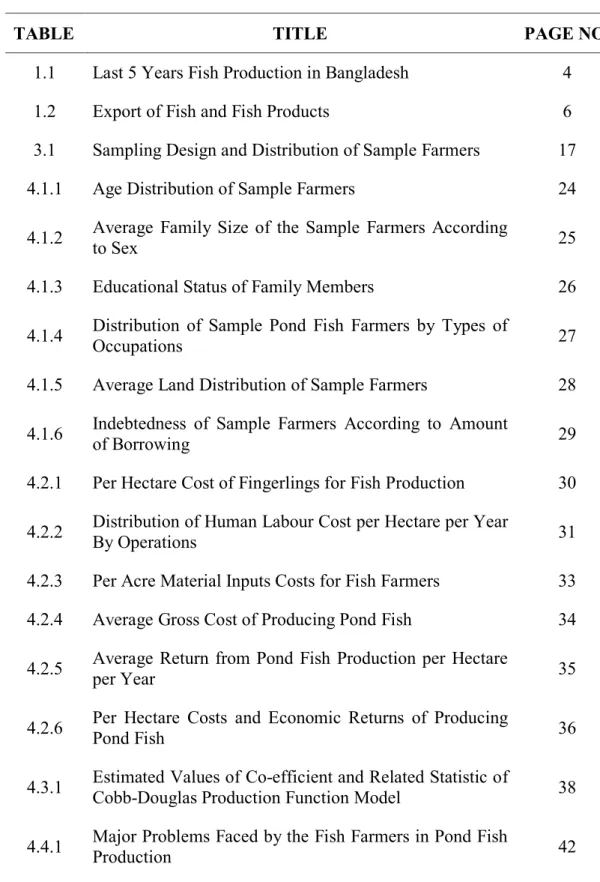
TABLE TITLE PAGE NO.
1.1 Last 5 Years Fish Production in Bangladesh 4
1.2 Export of Fish and Fish Products 6
3.1 Sampling Design and Distribution of Sample Farmers 17
4.1.1 Age Distribution of Sample Farmers 24
4.1.2 Average Family Size of the Sample Farmers According
to Sex 25
4.1.3 Educational Status of Family Members 26
4.1.4 Distribution of Sample Pond Fish Farmers by Types of
Occupations 27
4.1.5 Average Land Distribution of Sample Farmers 28 4.1.6 Indebtedness of Sample Farmers According to Amount
of Borrowing 29
4.2.1 Per Hectare Cost of Fingerlings for Fish Production 30 4.2.2 Distribution of Human Labour Cost per Hectare per Year
By Operations 31
4.2.3 Per Acre Material Inputs Costs for Fish Farmers 33 4.2.4 Average Gross Cost of Producing Pond Fish 34 4.2.5 Average Return from Pond Fish Production per Hectare
per Year 35
4.2.6 Per Hectare Costs and Economic Returns of Producing
Pond Fish 36
4.3.1 Estimated Values of Co-efficient and Related Statistic of
Cobb-Douglas Production Function Model 38
4.4.1 Major Problems Faced by the Fish Farmers in Pond Fish
Production 42
4.4.2 Solution to the Problems as Suggested by the Fish
Farmers 45
VII
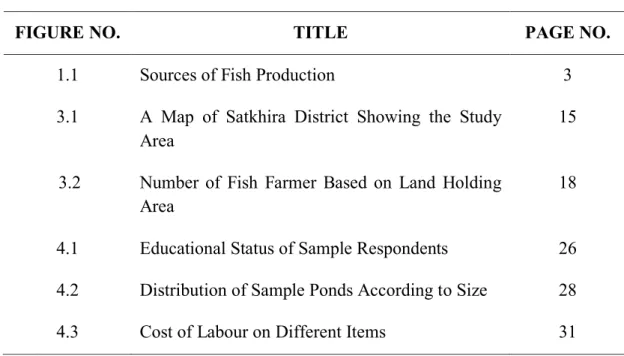
LIST OF FIGURES
FIGURE NO. TITLE PAGE NO.
1.1 Sources of Fish Production 3
3.1 A Map of Satkhira District Showing the Study Area
15
3.2 Number of Fish Farmer Based on Land Holding Area
18
4.1 Educational Status of Sample Respondents 26 4.2 Distribution of Sample Ponds According to Size 28
4.3 Cost of Labour on Different Items 31
VIII
LIST OF PLATES
PLATE NO. TITLE PAGE NO.
1 Commercial Fish Culture Pond 16
2 Feeding of Fish in Commercial Fish Culture Pond 19
LIST OF APPENDICES
APPENDIX NO. TITLE PAGE NO.
I Questionnaire of the Study 54
IX
LIST OFABBREVIATIONS AND SYMBOLS
> Greater than
< Less than
% Percentage
ANOVA Analysis of variance
BAU Bangladesh Agricultural University
BBS Bangladesh Bureau of Statistics
BFTI Bangladesh Foreign Trade Institute
cm Centimeter
PCV Percent Coefficient of Variation
DF Degree of freedom
DoF Department of Fisheries
et. al. And others
e.g. exempli gratia (L), for example
etc. Etcetera
FAO Food and Agricultural Organization
FRSS First Response Survey System
GDP Gross Domestic Product
gm gram
i.e. id est (L), that is
JSC Junioor School Certificate
HSC Higher Secondary School Certificate
Kg. Kilogram
LIFDC Low Income Food Deficit Country
LSD Least Significant Difference
MT Metric Ton
SAU Sher-e-Bangla Agricultural University
SDG Sustainable Development Goal
SSC Secondary School Certificate
WHO World Health Organization
USA United States of America
1 CHAPTER 1 INTRODUCTION
The favorable geographic position of Bangladesh comes with a large number of aquatic species and provides plenty of resources to support fisheries potential. Fish is a popular complement to rice in the national diet, giving rise to the adage Maache-Bhate Bangali (“a Bengali is made of fish and rice”). There was a time when natural water bodies of the country were full of fishes and other fisheries items. But situation has changed now and the country’s open water losing their resources. Although production from cultivable water bodies was increased to a great extent, still it is under the level of country requirement. The fisheries can broadly be classified into three categories:
inland capture fisheries, inland aquaculture and marine fisheries, of which the inland aquaculture sector is contributing more than 55% of the total production. The fisheries sector plays a very important role in the national economy, contributing 3.69% to the Gross Domestic Product (GDP) of the country and 22.60% to the agricultural GDP (FRSS, 2016). Over the last 10 years (2004-2005 to 2013-2014 FY), the fisheries growth was fairly steady and at an average of 5.38% per year (FRSS, 2015). This sector experienced more or less consistent growth rate, ranging from 7.32% growth in 2009- 2010 to 4.04% growth in 2013-2014 (Bangladesh Economic Review, 2014). More than 2% of Bangladeshi export value comes from the inland fisheries sector. Given proper government support, the fisheries sector has ample potential in creating various types of ancillary industries in rural areas that often have a high rate of economic return.
These employment opportunities for poor rural citizens would also stem their migration to urban areas. Fish supplements about 60% of Bangladeshi people’s daily animal protein intake. More than 17 million people including about 1.4 million women depend on fisheries sector for their livelihoods through fishing, farming, fish handling, and processing. A different surveys revealed that more than 80% of laborers engaged in the fish processing industries were women.
Bangladesh has one of the biggest and most active deltas, fed by three mighty rivers:
the Padma, the Meghna and the Jamuna. This contributes to a high potential for fresh and brackish water capture and culture fisheries, in addition to the vast marine resources. Inland fisheries production has escalated over the years, but the productivity per hectare water area is not yet attained at its optimum. In recent years, the bulk of the
2
production has been obtained from marine (16.78%) and freshwater (83.22%) wild capture fisheries.
1.1 Fish as a Human Food
Fish is a food of excellent nutritional value, providing high quality protein and a wide variety of vitamins and minerals, including vitamins A and D, phosphorus, magnesium, selenium, and iodine in marine fish. Its protein - like that of meat - is easily digestible and favorably complements dietary protein provided by cereals and legumes that are typically consumed in many developing countries.
Experts agree that, even in small quantities, fish can have a significant positive impact in improving the quality of dietary protein by complementing the essential amino acids that are often present in low quantities in vegetable-based diets. But recent research shows that fish is much more than just an alternative source of animal protein. Fish oils in fatty fish are the richest source of a type of fat that is vital to normal brain development in unborn babies and infants. Without adequate amounts of these fatty acids, normal brain development does not take place. Closely spaced pregnancies, often seen in developing countries, can lead to the depletion of the mother's supply of essential fatty acids, leaving younger siblings deprived of this vital nutrient at a crucial stage in their growth. In general, people in developing countries are much more dependent on fish as part of their daily diets than those living in the developed world.
1.2 Fish and Bangladesh
In the globe, fish provides the best protein food rich in essential macro and micro- nutrient, vitamins and minerals, Fish farming and fishing create working opportunity and income to millions of poor, and trade in fishery products play important role in poverty alleviation and economic growth of nations. The fisheries sector, in Bangladesh, plays a particularly crucial role among poor as a main or additional source of employment, livelihood and income. The sector is the second largest part-time and fulltime employer in rural areas. It provides a crucial source of income and food to Bangladesh, and is second only to agriculture in the overall economy of the country.
Bangladesh produced 3.26 million tons of fish during 2011-12 from inland and marine water bodies and aquaculture contributed more than 50% of the total production.
Fisheries accounts for 4.4% of Bangladesh GDP, 22.8% of agriculture sector and 2.5%
3
of total export earnings. It also contributes 60% of the animal protein intake in Bangladesh, and even higher in populations living in the coast.
1.3 Fisheries Sector: Prospects and Potentials a. National Contribution
Fisheries sector contributed 3.57% to national GDP and 25.30% to the agricultural GDP and 1.5% to foreign exchange earnings by exporting fish and fish products in 2017-18.
Fish provides 60% of national animal protein consumption. Fisheries sector also plays an important role in rural employment generation and poverty alleviation.
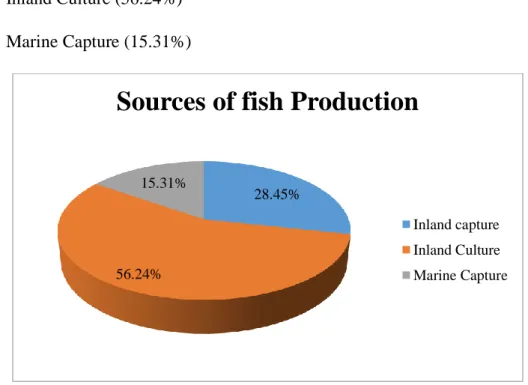
b. Source of Fish Production
There are three categories of major fisheries resources, these are- i. Inland Capture (28.45%)
ii. Inland Culture (56.24%) iii. Marine Capture (15.31%)
Source: DoF, 2019-2020
Figure 1.1: Sources of Fish Production
28.45%
56.24%
15.31%
Sources of fish Production
Inland capture Inland Culture Marine Capture
4 c. Inland Fisheries
Inland fisheries comprises of rivers, ponds, estuaries, beels flood plains, haor,baor brackish water etc. There are 260 fish and 24 prawn species in inland fresh water in the country. In early sixties inland fisheries contributed about 90% of total fish production of the country. Now only about 28.45% of total fish production comes from inland open water.
d. Marine Fisheries
The Bay of Bengal is situated in the South of Bangladesh. There is a total of 166,000 sq. km. water area including Exclusive Economic Zone (EEZ). Fishing is only confined within 200-meter depth. In the year 2017-18 total fish production from Marine source was 6.55 lac MT.
Recently Bangladesh has got the right to access 1.00 lac sq. kilometer water area in Bay of Bengal through International Tribunal for the Law of the Sea (ITLOS) by the visionary and pragmatic leadership of Honorable Prime Minister Sheikh Hasina. DoF has planned to assess the fisheries resources in the Bay of Bengal for maximum sustainable yield. A research vessel is under process of procurement to conduct appropriate stock assessment. Vessel Tracking Monitoring System will also be developed.
Table 1.1 Last 5 Years Fish Production in Bangladesh Year Source-wise production (MT) Total
Inland open Closed Marine
2017-2018 1216539 2405415 654687 4276614 2016-2017 1163606 2333352 637476 4134434 2015-2016 1048242 2203554 626528 3878324 2014-2015 1023991 2060408 599846 3684245
2013-2014 995805 1956925 595385 3548115
Source: DoF, 2019-2020
5
From the table 1.1 it is found that in 2017-18 the total fish production is 42.77 lac Metric Ton (MT). Average annual growth rate of fish production in last 3 years is 5.10%. The Production from closed water bodies is increasing very sharply due to dissemination of adaptive technologies and need-based extension services rendered by DoF.
1.4 Development Activities a. Annual Development Program
In addition to the normal activities of the DoF several development projects are being implemented aiming at boosting up fish production and conservation of fisheries resources. In 2017-2018 a total of 18, investment projects 15 programs and 3 technical assistance Project has been in implementation. Technical assistance projects are being implemented. Through the development activities habitat restoration, conservation of natural resources, community based resource management, human resource development, and alternate income generating activities etc. is implementing in this sector.
b. Aquaculture Practices i. Freshwater Aquaculture:
ii. Brackish Water Aquaculture iii. Fish and shrimp Hatchery c. Open Water Management
i. Hilsa Fishery Management
ii. Protection of Natural Breeding Ground Halda iii. Fishers ID card
iv. Integrated Natural Resource Management v. Fish Habitat Restoration
1.5 Export of Fish & Fish Products
There are100 fish processing plants in the country. Out of 100 plants European Commission has approved 76 plants. HACCP has already been introduced in fish processing establishments. Major importing countries are European countries, USA and Japan. About 98% of total fish products are exported to those countries. Remaining are exported to the countries in Southeast Asia and Middle East.
6 Table 1.2 Export of Fish and Fish Products
Year Source-wise production Other fish products Total Quantity
(MT)
Value (Crore Taka)
Quantity (MT)
Value(Crore Taka)
Value (Crore Taka)
20017-2018 36167.77 3527.07 32767.93 782.87 4309.94 2016-2017 39705.85 3682.26 28599.83 605.38 4287.64
2015-2016 40726 3598.67 34612 684.15 4282.82
2014-2015 44278 3937.60 39246 723 4660.60
2013-2014 47635 4118.80 29693 658.12 4776.92
Source: DoF, 2019-202
1.6 Fisheries as a Tool of Population Development
As an agro-based country, the contribution of fisheries to the national economy has always been essential and as the primary source of animal protein, employment opportunities, food security, foreign earnings and socio-economic development (FRSS, 2017). It contributes 3.61% to Bangladesh national GDP and around 24.41% to the agricultural GDP (DoF, 2017). Last ten years of average growth performance of this sector is almost 5.43%. Bangladesh has ranked 3rd in the world in inland fish production, 5th in aquaculture production and 11th in marine fish production in 2018 (FAO, 2018). Bangladesh is now self-sufficient in fish production and has started to get global recognition as one of the biggest fish producers among the countries (FRSS, 2017).
1.7 Justification
The fisheries sector is one of the most productive and dynamic industries which have a tremendous potentiality for future development in the agrarian economy of Bangladesh.
Fish is the primary protein source in Bangladeshi diet contributing about 60% of total animal protein while per capita fish consumption in the country reaches 62.58 gm, which is higher than their daily protein demand (60 gm) as per the report of the (BBS,
7
2017). As an agro-based country, the contribution of fisheries to the national economy has always been essential and as the primary source of animal protein, employment opportunities, food security, foreign earnings and socio-economic development (FRSS, 2017). The entire fisheries sector supports the livelihoods of people more than 18 million in the country directly and indirectly (FRSS, 2017). About 1.4 million women depend on the fisheries sector for their livelihoods through fishing, farming, fish handling & process- sing (BFTI, 2016). This sector also has a high potential for the perspective of the economic development of the country. There is a close connection between agriculture growth and economic development (Mohsin et al., 2015).
1.8 Objectives
Present study was undertaken to accomplish the following specific objectives:
To identify the socio-economic characteristics of pond fish farmers.
To identify and estimate the major factors affecting costs, returns and profitability of pond fish farming.
To identify the major problems and constraints facing the farmers in conducting pond fish farming.
1.9 Outline of the Study
This study consist of 5 distinct chapters. Chapters 1 deals with the introduction of the study. Chapter 2 deals with review of literature. Chapter 3 is concerned with the research methods of the study as well as the analytical techniques used in the study.
Result and discussion is presented in chapter 4 and finally a summary of the study, conclusion and policy recommendations and limitations are included in chapter 5.
8 CHAPTER 2
REVIEW OF LITERATURE 2.1 Introduction
The purpose of this chapter is to review the previous research works which are related to the present study. There are a lot of socio-economic studies of fisheries sector, because growth of fisheries sector in Bangladesh is increasing day by day. Different evaluation committees and research organizations in this country encourage all to do research work in this sector. Despite the fact that a large number of studies have been done on pond fish culture. It was found that a few limited numbers of workers conducted in Bangladesh which was particularly related to this research. However, in this chapter only the most common and relevant studies which have been conducted in the recent past are reviewed.
Ataur et al. (2020) conducted a survey entitled “Economic analysis of tilapia-carp polyculture in a selected area of Bangladesh”. The study was conducted to identify the socioeconomic characteristics, analyze the tilapia-carp polyculture system, profitability of tilapia-carp polyculture, and credit profile of the stratified randomly selected 50 sample farmers from Sherpur district in Bangladesh. The findings revealed that 36% of the respondents belonged to the age group of 25-29 years, 68% belong to medium family size (5 to 6 people). Average fingerlings released in the tilapia-carp polyculture were 24240 per hectare per year. Most of the fingerlings collected from private hatcheries. The annual per hectare production of tilapia and carp were 8028 kg and 11085 kg., respectively. Per hectare per year gross cost, gross margin, gross return and net return were Tk. 1093008 ($12897), Tk. 759447 ($8961), Tk. 1735455 ($20477) and Tk. 642447 ($7580), respectively. The BCR of tilapia-carp polyculture for cash cost was 1.78 and full cost was 1.59. About 20% of the respondents took loan from different sources and they received 84.51% of their applied amount and 84.73 % of the loan money used in productive purposes. Mortality of fingerlings, the high price of the ingredient, low price of fish, high interest rate and non-availability of good quality fingerlings at proper time were identified to be the major problems in conducting pond fish production.
Yeasmin et al. (2019) stated a survey on “Economic analysis of tilapia farming in some selected area of Dinajpur District”. The study was conducted to assess the cost and
9
return from tilapia farming. Fifty homestead aquaculture ponds practicing monoculture and polyculture of tilapia (25 farmers from each category) were selected for this study.
Data had been collected through face to face interview by using a structured questionnaire during April to September 2015 from the selected farmers of Dinajpur districts. The results from the survey revealed that both the tilapia monoculture and polyculture farming were profitable. However, the average total cost per hectare per production period was found higher (Tk. 332,712.08) in tilapia monoculture than tilapia culture with carps (Tk. 241,722.34). Moreover, the net margin was also found higher in tilapia monoculture with benefit cost ratio 1.51. Whereas, the benefit cost ratio in polyculture farming was 1.34.
Hossian et al. (2018) conducted a survey on the Culture Condition of Pangus (Pangasius hypophthalmus) at different farms in Trishal upazila. The study was conducted to investigate existing culture conditions of pangus (Pangasius hypophthalmus) at farms in Trishal Upazila under Mymensingh district during January to June, 2016. Data were collected with questionnaire by personal interviewing of the respondents. The study result showed that- the farmers of large category are about 60%
where 47% farmers have leased pond. Most of the farmer use deep tube-well water as source, 87% farmers practice monoculture of pangus and monitored the health of fish in a regular basis. Only 13% farmer reported diseases occurred in their pond. Most of the pangus farmers used homemade or local farm made supplementary feeds for pangus culture. The study showed that development of better farming system, improving water management, stocking of quality fingerlings, health monitoring and use of prime and standard quality feed has resulted better pangus production in Trishal area.
Islam (2018) conducted a study with a view to finding out the carp’s polyculture technique, pond management and cost analysis of Kaliganj upazila under Lalmonirhat District. The study was conducted for a period of six months (September 2017 to February 2018). It provides an overview on the guiding principles, aspects and tasks, and presents the applicable production techniques and patterns of carp polyculture. For further reading and more in-depth information on the suggested techniques and technologies. It is expected that this publication will help identify resources and contribute to the successful planning and realization of fish production by those fish pond owners and operators who need to strengthen and improve their knowledge on the subject.
10
Mondal et al. (2018) examined a study entitled “Present status, problems and prospect of fish farming at Gazipur Sadar upazila in Bangladesh” The study was conducted to reveal the present scenario, problems and the prospect of fish farming of Gazipur Sadar upazila Bangladesh. The primary data were collected through field survey, questionnaire interview and focus group discussion from the fish farmers of several villages and urban areas of the upazila. Secondary data were collected from the Department of Fisheries and aquaculture extension section. Gazipur Sadar upazila has 14462.42 ha potential fisheries resources of which floodplains, seasonal water bodies, and ponds comprise 71.01%, 13.04%, and 8.57%, respectively. The total fish production of the upazila in 2016-17 was 14492.7 MT, 27% of the Gazipur district. The highest fish production of 5436 MT and 4.39 MT/ha/year came from the pond sector.
Among different pond culture systems, the semi-intensive system had the highest fish production output (2826 MT). Exotic carps were the highest produced fish in the ponds.
However, in spite of comprising a huge proportion of seasonal floodplains the fish production from this sector was only 0.42 MT/ha/year in 2016-2017. This indicates the poor utilization of inland open water resources for fish production in the study area.
The major areas were identified to improve the existing pond fish farming situation were access to low-interest loan, quality seed, and supply of advanced technologies, need-based training, and marketing facilities. Along with improving the pond fish farming, community-based fisheries management and some aquaculture initiatives on private own seasonal floodplains should be taken on a priority basis to improve open water management and to flourish inland fish production in the study area.
Hasan et al. (2016) examined a study on “Comparison of Production Performance and Economics of Different Carp Polyculture Systems”. The study was conducted to evaluate the comparison of production performance and economics of different carp polyculture systems in Gangni Upazila under Meherpur district from July to November 2015. Primary data collection and secondary information were used to assess the performances in aquaculture activities. From the survey, it was found that 14 (35.0 %) of the farmers applied supplementary/homemade feed prepared with rice bran and mustard oil cake, 17 (43.0 %) farmers used commercial feed and 9(22.0 %) farmers were depended on natural feed. Average fish production of the farmers was 6274 kg per ha per year. The calculated highest fish production 7,904 kg per ha per year and net income was BDT 2,42,060 per ha per year respectively in carp-tilapia polyculture
11
system. The lowest fish production was 5,187 kg ha-1 yr-1 and net income was BDT 1, 66,478 came in carp-koi polyculture system. From the result of present study, it is clear that fish production and financial benefit in carp-tilapia polyculture were higher than others. The present findings reveal that carp-tilapia polyculture system is more suitable and profitable culture system than other polyculture systems existing in Gangni upazila of Meherpur district.
Masum (2013) conducted a study to identify the farmer’s knowledge and practice on pond fish farming. The major purpose of this research study was to determine farmers’
knowledge and practice of pond fish culture and also to explore the relationships between 10 characteristics of the pond farmers and their knowledge and practice of pond fish culture. The study was conducted in 4 villages of Kaijuri union of Faridpur district. The populations of pond farmers in these villages were 253, from where 101 samples were drawn by using random sampling technique. An interview schedule was used for data collection. The majority 44.6 percent of the pond farmers’ possessed medium knowledge, 25.7 percent of the pond owners possessed high knowledge and only 16.8 percent of the pond owners had low knowledge and 12.9 percent of the farmers possessed very high knowledge. About 61.4 percent of the pond farmers had medium practice, while 27.7 percent farmers had low practice and only 10.9 percent farmers had high practice. Age, pond size, commercialization and training exposure of the pond farmers had positive significant relationship with farmers’ knowledge on pond fish farming, while problem faced had negative relationship. In case of farmers’
practice pond size, commercialization and training exposure had positive significant relationship and problem faced had negative relationship. The pond owners faced such major problems as: proper marketing facilities, poor communication system, natural calamities, and shortage of pond water in dry season, insufficient credit and low price of pond fish in pick period.
Rahman et al. (2015) conducted a survey to examine the cost, returns, profitability of pond fish farm, requirements, adequacy, sources and utilization patterns of credit and problems associated with pond fish farming in Madhupur Upazila of Tangail district.
A total of 60 farmers with small traditional types of ponds were randomly selected for this study. Both description and econometric analysis were used. Human labour was the most important and one of the largest inputs used for pond fish production. The average per acre human labour cost, fingerlings cost, feed cost, chemical fertilizers cost,
12
manure cost, and lime cost were Tk. 9345, Tk. 18506, Tk.10476, Tk.3759, Tk. 329, and Tk.1605, respectively. Pond rental value was calculated at Tk. 11537 per acre for one year which shared 26.42 percent of total costs of pond fish production. Gross return was Tk. 70928 per acre. Gross margin and net return of the pond fish farm were Tk.38118 and Tk. 24081 per acre respectively. The BCR was 1.514. Out of 60 farmers, only 11 farmers received loans from different sources and 86.67 percent of applied amount received. About 83 percent of the loan used for operating expenditure of farming and rest 17 percent loan used for non-farm expenditure. There were some problems in fish farming, such as insufficient water, high feed cost etc. Government needs to provide subsidized feed, technical supports and credit facilities for the small scale fish farmers.
Alam (2005) conducted a study to measure the productivity, profitability and efficiency of producing fish in Bangladesh. Two regions, Satkhira and Jashore were selected purposively. From each of the selected regions 60 farmers and 30 retailers were randomly selected for the study. Farmer of Satkhira region produced significantly higher output (21942.41 kg) per hectare than those of Jashore region (12735.5 kg). Net returns (full cost basis) per hectare for producing fish in Satkhira and Jashore regions were tk. 245219.12 and tk. 187014.90 respectively. The benefit cost ratios (full cost basis) showed that production of fish was profitable for both regions with BCR being 1.49 and 1.27 in Satkhira and Jashore region respectively.
Ahmed (2003) conducted a study mainly to assess the different practices and to determine the relative profitability of fish production in Mymensingh district. He observed that average stoking density of carp fingerlings to e 9537-10445 ha per year.
Average fish production cost was estimated Tk. 23210 to Tk. 24790 per hectare while the net return was fond to be Tk. 59119 to Tk. 56484 per hectare per year. He stated that carp polyculture was profitable.
Faruque (2003) carried out of study titled “A comparative economic analysis of carp and pangus culture in some selected area of Satkhira district” and found that average per hectare total cost of carp culture for all farms was Tk. 95908 while gross income and net return per hectare were Tk. 281215 and Tk. 185307 respectively. On the other hand, corresponding figures for pangus culture were Tk. 668722 Tk. 1021300 and Tk.
352578 respectively. It was observed that pangus culture was highly profitable and its net return was about times higher than that of carp culture.
13
Roy (2003) conducted a study mainly to understand the dynamics on pond fishery and to determine the costs and returns of pond fish culture and explore the backward and forward linkages of pond fish culture in two upazillas of Mymensingh district. The study showed that the pond fish and hatchery production was highly profitable business.
Biswas (2001) conducted a study on “An economic analysis of pond fish culture of BRAC in some selected areas of Mymensingh district”. This study revealed that per hectare per year total cost of pond fish production was Tk. 59814 where artificial feed cost was largest cost and it contributed 30.44% of total cost. Net return was observed as Tk. 855110 for all location.
2.2 Research Gap
The above mentioned review and discussion are certainly relevant to the objectives and methodologies of the present study. Most of the studies dealt with the profitability and productivity of pond fish culture. Some studies are related with technical efficiency of carp culture farming. It was very useful to reconstruct the methodological issues to overcome the limitations of previous studies. From the study the economic analysis and profitability of pond fish culture in Satkhira district of Bangladesh with the recent development context will help the policy makers to understand the current situation and take decision for pond culture. In the contrast, the findings of the study would provide recent updated information of Satkhira District which would help the policy makers as well as researcher for further study.
14 CHAPTER 3
METHODOLOGY OF THE STUDY 3.1 Introduction
In scientific research appropriate methodology is very important aspect. Without using proper methodology one does not get ethical results. According to the nature of research, availability of times and fund, the survey method was selected because it is less expensive and required less time above all this method is very simple and easy. But some short comings are also here. In this method, the main short coming is that the investigation has to depend on the memory of the respondents. The method of collecting data has undertaken depending on the nature, aims and objectives of the study. There are various types of methods of collecting inevitable data and information. The current study was based on field survey where primary data were taken from the respondents.
To perform the current study the following steps were followed.
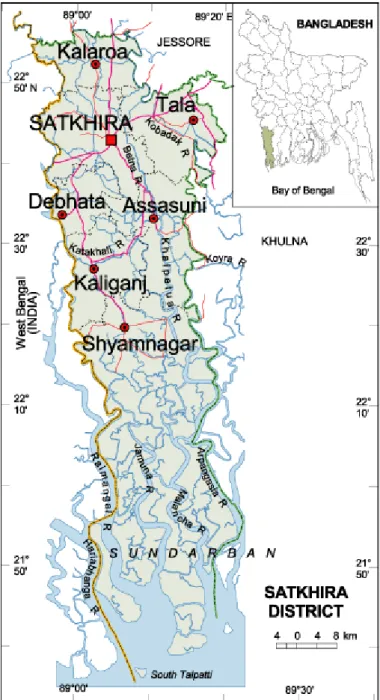
3.2 Selection of the Study Area
Selection of the study is an important step for pond fish culture study. To collect information for pond for pond fish culture study the area is selected to serve the purpose to set the study. Two villages from Satkhira district under Kalaroa upazilla namely Hizaldi and Sultanpur were randomly selected for the study. The selection of the village area were for the following reasons-
i. Small scale pond fish farmers was heavy concentration
ii. Identical characteristics like topography, soil and climate condition are same in these village for producing pond fish culture
iii. Commercial and semi-commercial fish farming’s were available in these area iv. Expectation of high co-operation from the farmers
v. Good communication facilities with the farmer
15
Figure 3.1 A Map of Satkhira District Showing the Study Area
3.3 Preparation of the Interview Schedule
The survey schedule was conducted by keeping in view the targets of the study which was to collect the expected primary data from the pond fish farmers. At first, draft schedule was prepared and pretested with a few farmers and draft schedule was improved, rearranged and modified in the light of the practical examinations. A final interview schedule was developed after pre-testing and necessary adjustment.
16
After all necessary reconciliation a final schedule was progressed in logical sequence of the following aspects of the information:
i. Socio demographic profile of pond fish farmers.
ii. Production practices and inputs use cost and returns.
iii. Factors intensity and returns.
iv. Expenses including labor supplies, stocking fingerlings etc.
v. Artificial feeding and fertilizer.
vi. Problems and constraints of pond fish farming and other related issues.
3.4 Sampling Techniques
The collection of required information for a research study from each and every elements of population become costly and time consuming. So the determination of sample size was one of the crucial issues for the study. A reasonable size was of sample to attain the objectives of the study was recommended. A sample of representative farms is therefore taken in such a way that the information meets the purpose of the study. As the population is not so large and considering the limited time, efforts and fund a sample of 50 were randomly selected.
Plate 1: Commercial Fish Culture Pond
17 3.5 Period of Data Collection
The data and information were collected in respect of operation and activities included pond fish farming. First-hand information were collected from the study areas during February-March, 2020.
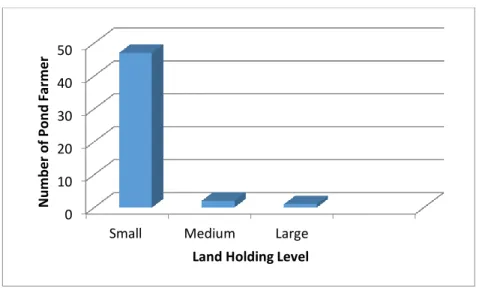
3.6 Categories of Farm Household Selection
Three categories of farmers were selected for this study:
i. Small farmers: Holding less than 1 hectare ( below 2.47 acres)
ii. Medium farmers: Holding area between 1 hectare to 3 hectare ( 2.47 to 7.49 acres)
iii. Large farmers: Holding area above 3 hectare ( above 7.49 acres)
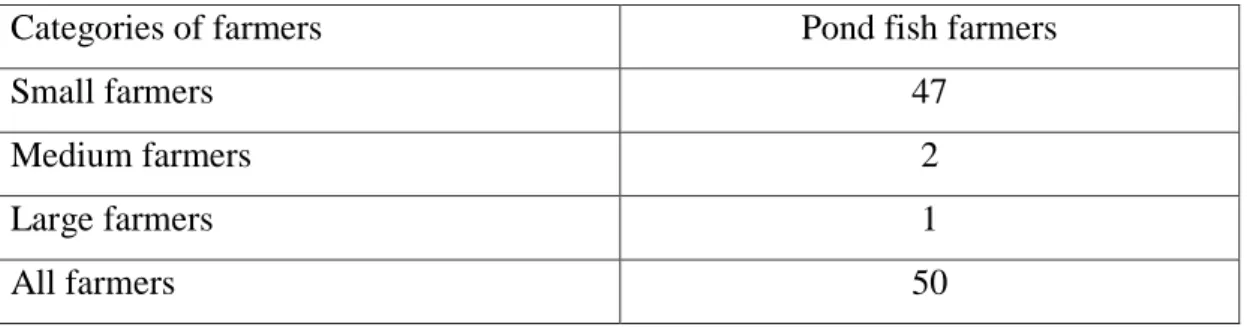
For pond fish farming, 47 small farmers 2 medium farmers and 1 large farmers from Kalaroa upazilla under Satkhira district were selected randomly. The sample design and distribution of sample farmers are shown in table 3.1
Table 3.1 Sampling Design and Distribution of Sample Farmers
Categories of farmers Pond fish farmers
Small farmers 47
Medium farmers 2
Large farmers 1
All farmers 50
Sources: Field survey, 2020
18
Figure 3.2: Number of Fish Farmer Based on Land Holding Area 3.7 Collection of Data
The collection data and related information was taken by the researcher through direct interview from the targeted fish farmers. It is not an easy task to collect precise and authentic data from the field. The researcher’s intelligence is an important factor in this case. As most of the cases the farmers did not keep any written record of their fish farming, so researcher had to depend on the memory of the respondents. The researcher applied all necessary efforts to confirm the collection of reasonably authentic information from the field.
0 10 20 30 40 50
Small Medium Large
Number of Pond Farmer
Land Holding Level
19
Plate 2: Feeding of Fish in Commercial Fish Culture Pond
The selected farmers were interviewed personally when the respondents were not so much busy with their farming business. During the interview, at first each farmers given a brief discussion about the nature and purpose of the study. Then question were asked systematically in a very simple and easy manner with explanation when it was felt necessary and the answer was were recorded on the schedules. After completion of each interview the schedule were checked and verified to be ensure that the reply of the respondent was perfectly recorded. In case of any inconsistency of data the respondent were again interviewed for authentic answers. In order to lessen errors, data were taken in local units.
20 3.8 Processing, Tabulation and Analysis of data
The primary data which was collected from the study area were digest and survey carefully the before actual catalog was done. The processed data was transferred to a M.S. Excel sheet. After performing the pre-tabulation function, real tabulation work was started. A list of catalog were assembled on the basis of the aims and targets of the study. Finally, tabulated data were examined and condensed by using average, percentage and ratio to obtain the results.
3.9 Analytical Techniques
Mainly two types of techniques were used in this study:
i. Tabular analysis and ii. Functional analysis Tabular analysis
Most of the data are presented in a tabular form. This structure of data is simple in computation, widely used and easy to understand. Some statistical calculations like average, percentage and ratios were estimated as these were simple to understand and easy to estimation. This analysis also includes socio-demographic characteristics of sample farmers, production practices and input use, costs and return of pond fish culture.
Per hectare profitability of pond fish production from the view point of individual farmers was estimated in terms of gross return, gross margin, net return and benefit cost ratio (undiscounted).
Gross return
Gross return was calculated by multiplying the total volume of output of an enterprise by the average price in the harvesting seasons (Dillon and Hardaker, 1993). To estimate GR, following equation was used.
GRi= ∑𝑛𝑖=1Qi Pi Where,
GRi= Gross return from ith product (Tk/ha);
21 Qi= Quantity of theith product (kg/ha);
Pi= Average price of the ith product (Tk/kg);
i= 1, 2,3,………….,n.
Gross margin
Gross margin has given a calculation of the difference between total return and variable costs.
That is,
GM = TR-VC Where,
GM = Gross margin TR = Total return VC = Variable cost
Net return
Net return analysis considered fixed costs, cost of land rent, interest on operating capital etc. Net return was estimated by deducting all cost (variable and fixed) from gross return. To determine the net return of pond fish culture the following equation was used in the study:
Π = PyY- ∑𝑛𝑖=1𝑃𝑥𝑖𝑋𝑖-TFC Where,
Π= Net return (Tk/kg);
Py= per unit price of the product (Tk/kg) Y= Quantity of the production per hectare (kg) Pxi= per unit price of ith inputs per hectare (kg)
22 Xi= Quantity of the ith inputs per hectare (kg) TFC= Total fixed cost (Tk)
i=1, 2, 3,…………, n.(number of inputs)
Cost and return analysis were done based on both variable and total cost basis in the study. A simple tabular analysis was calculated to get the objectives of the study. To assess the profitability of the pond fish production the following profit equation was developed:
Π= Gross return-(Variable cost + Fixed cost) Here, π= Profit per hectare
Gross return = Total production ×per unit price Variable cost include:
i. Cost of human labour ii. Cost of fertilizer iii. Cost of fingerlings iv. Cost of feed
v. Cost of irrigation vi. Cost of insecticide
vii. Cost of mechanical power Fixed cost includes:
i. Land use cost, and
ii. Interest on operating capital.
Benefit Cost Ratio (BCR)
The BCR (Benefit Cost Ratio) is a relative measure, which is used to compare benefit per unit of cost. The BCR is calculated as a ratio of gross returns and gross costs. The formula for calculation BCR (undiscounted) is given below:
Benefit cost ratio= 𝐺𝑟𝑜𝑠𝑠 𝑏𝑒𝑛𝑒𝑓𝑖𝑡 𝐺𝑟𝑜𝑠𝑠 𝑐𝑜𝑠𝑡
23 Functional analysis
Functional analysis was implemented to identify the individual effect of input use and other related factors of pond fish culture with the help of Cobb-Douglas production function model. The model was used in the following form:
𝑌 = 𝑎𝑋1b1X2b2X3b3X4b4 X5b5 X6b6 X7 b7 en
Cobb-Douglas production function can be estimated in the alternative form by using OLS (Ordinary Least Square) method, in a log linear form.
Ln Y= ln a + b1 lnx1 + b2 lnx2 + b3 lnx3 + b4 lnx4 + b5 lnx5 + b6 lnx +b7 lnx7 + Ui
Where,
Y= Gross return, Tk/ha
X1= Human labour cost, Tk/ha X2= Fingerlings cost, Tk/ha X3= Feed cost, Tk/ha X4= Fertilizer cost, Tk/ha X5= Insectiside cost, Tk/ha X6= Mechanical cost, Tk/ha X7=Irrigation cost, Tk/ha ln= Natural logarithm Ui= Disturbance term a= intercept
bi= Co-efficient of the relevant variables
24
CHAPTER 4
RESULT AND DISCUSSION 4.1 Socio-Economic Characteristics
4.1.1 Introduction
Production pattern and technology use are affected by socioeconomic characteristics of fish farmers. To provide a more accurate picture of pond fish culture, to know the socioeconomic characteristics of a fish farmers is very much essential. In this chapter, an attempt was taken to identify the socioeconomic characteristics, family size, educational level, occupational status, land utilization pattern and indebtedness of selected sample farmers of the study area.
4.1.2 Age Distribution of Pond Area
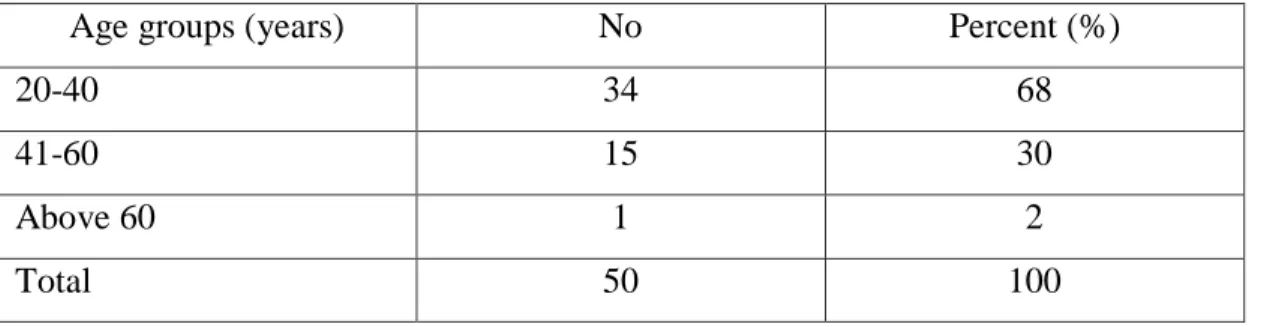
In this study the pond fish farmers were classified into three categories according to their age groups. Such as 20-40 year, 41-60 year and above 60 years. Table 4.1 is presented as the age classification of sample pond fish farmers. About 68 percent fish farmers belonged to the age group of 20-40 out of total pond owners. Out of the total pond owners 30 percent of fish owners were age of 41-60 year. About 2 percent of fish pond farmers fell into the age group of above 60.This information implies that more than half of the sample farmers were in active age of 20-40 years, indicating that they provided more physical efforts for pond fish culturing.
Table 4.1.1 Age Distribution of Sample Farmers
Age groups (years) No Percent (%)
20-40 34 68
41-60 15 30
Above 60 1 2
Total 50 100
Sources: Field survey 2020
25 4.1.3 Family Size of the Sample Farmers
A family size has been defined as the total number of persons of either sex living together and having meals from the same kitchen under the administration of a single head of the family. The farm family includes husband, wife, sons, unmarried
daughters, parents, brothers, etc.
Table 4.1.2 Average Family Size of the Sample Farmers According to Sex
Sex Pond fish producers
No %
Male 2.83 52.61
Female 2.55 47.39
Total 5.38 100
Sources: Field survey 2020
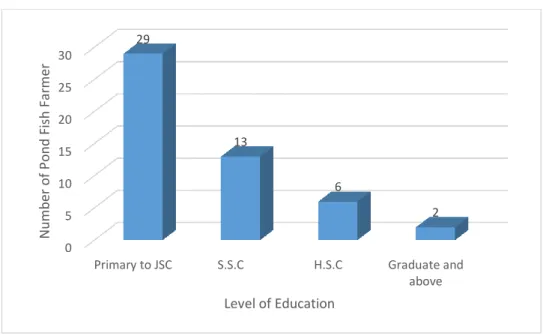
4.1.4 Level of Education Distribution of Respondents According to Literacy The literacy level is generally considered as an index of social advancement of the community. From the literacy point of view, fish farmers were classified into five groups, i.e., illiterate, primary level, secondary level, higher secondary level and graduate level. As this is the age of science, various types of fish culture is based on scientific method so every pond fish farmer will have some educational background to have some knowledge on improved fish culture technique.
26
Figure: 4.1 Educational Status of Sample Respondents 4.1.5 Educational Status of Family Members
The level of education of pond fish farmer’s family members is shown in the table 4.4.
The table revealed that about 7 percent of the family members were illiterate, 47 percent a major part of the family members completed only Junior School Certificate, among them 25 percent completed Secondary School Certificate, Higher Secondary School Certificate completing members were only 16 percent and only 5 percent family members completed graduation level.
Table 4.1.3 Educational Status of Family Members
Level of education No. of family members %
Illiterate 17 7
Primary to JSC 107 47
S.S.C 58 25
H.S.C 36 16
Graduate and above 12 5
Total 230 100
Sources: Field survey 2020
4.1.6 Occupation of the Pond Fish Farmers
Occupation is the important aspect among the socioeconomic characteristics of the respondents. The pond fish possessors were involved in various types of livelihood.
0 5 10 15 20 25 30
Primary to JSC S.S.C H.S.C Graduate and
above 29
13
6
2
Number of Pond Fish Farmer
Level of Education
27
The main occupation of farm family considered in the present study was the occupation from which most of the income was earned. The occupations of fish pond owners are presented in Table 4.5.
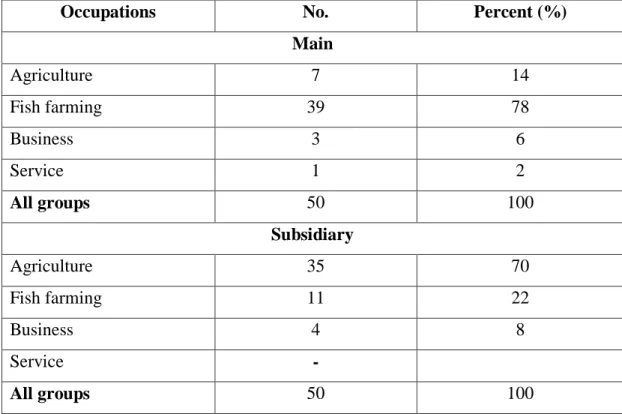
Table 4.1.4 Distribution of Sample Pond Fish Farmers by Types of Occupations
Occupations No. Percent (%)
Main
Agriculture 7 14
Fish farming 39 78
Business 3 6
Service 1 2
All groups 50 100
Subsidiary
Agriculture 35 70
Fish farming 11 22
Business 4 8
Service -
All groups 50 100
Sources: Field survey, 2020
4.1.7 Land Holding and Utilization Pattern
In this present survey, total land holding was defined as the sum total of all types of cultivable land possessed by the individual owners of fish farms and having legal rights on it. Therefore, the respective farm size in the survey area was measured by using the following formula.
Farm Size = Homestead (including garden) area + Pond + Own land + Rented in + Mortgaged in – (Rented out + Mortgage out).
28
Table 4.1.5 Average Land Distribution of Sample Farmers
Utilization of land Pond fish farmers
Area in ha %
Homestead area .40 11
Own cultivable land 1.20 31
Lease in 1.10 29
Lease out 1.00 27
Mortgage in .07 2
Total 1.77 100
Sources: Field survey, 2020
Distribution of Sample Ponds According to Size
Pond size may vary in different locations on the basis of physical and socioeconomic conditions. A suitable pond size is required to minimize the production cost and maximize the production. The Figure 4.2 shows the distribution of areas the majority of pond sizes were in 0.2 to 0.3 hectare.
Figure 4.2 Distribution of Sample Ponds According to Size
0 20 40 60 80 100
0.1-0.2 0.2-0.3 0.3-above
20
85
22
Number of Pond
Size of Pond
29 Indebtedness of producers
From the survey, it is found that most of the fish farmers borrowed money from banks.
Table 4.8 indicates the indebtedness of fish farmers on the basis of borrowed amount.
Money borrowed from different sources was divided into five categories such as Tk.
5000 to Tk. 15000, Tk. 15001 to Tk. 25000, Tk. 25001 to Tk. 35000, Tk. 35001 to Tk.
50000 and above Tk. 50000.
Table 4.1.6 Indebtedness of Sample Farmers According to Amount of Borrowing
Amount borrowed No Percent (%)
15001-25000 2 4
25001-35000 8 16
35001-50000 11 22
50001-above 18 36
Not indebted 11 22
Total 50 100
Sources: Field survey, 2020
4.2 Estimation of Costs for Using Inputs in Pond Fish Farming Introduction
Pond fish farmers in the survey area did not keep any written records of costs and returns of fish culture. However, it is assumed that they possess a sharp memory and can estimate everything in concentration with their farm business. The aim of this chapter is to determine costs, returns and profitability of fish production. All these costs and returns were estimated for duration of one year of the fish farms.
Estimation of costs and returns
Cost and returns were calculated from farmer’s point of view. Costs were calculated for all the family supplied and purchased inputs used in producing pond fish. The market prices of inputs and output were used. The cost of pond fish production included the costs of human labor and material input (feed, fertilizer, manure and fingerlings), land use cost and cost on operating capital. The items have been described below:
30 Cost of fingerlings
Per unit price of fingerlings depends on their sizes s well as the concerned fish species.
The stocking rate of fingerlings varies with the fertility of pond. Pond fish farmers in the study area used purchased fingerlings and the cost was calculated on the basis of farm-gate price. The selected species of fingerlings were Rui, Catla, Mrigal, karfu, Silver carp, Grass carp, Mirror carp, Shrimp, Chetol, Tilapia, Pangus, Kalabous and Sharpunti used for fish culture. The average unit price of fingerlings was 2.14 Tk.
/piece. The purchasing cost of fingerlings per ha for pond fish production was Tk.
63217.
Table 4.2.1 Per Hectare Cost of Fingerlings for Fish Production
Cost item Quantity of
fingerlings
Price/piece Total cost
Fingerlings 29540.7 2.14 63217
Sources: Field survey, 2020 Cost of human labour
Human labour was required in different operations and managements, such as reconstruction, feed application, fertilizer application, compost making and its application, application of cow dung, Stocking of fingerlings, making feeding ring, weeding and fish harvesting and marketing. Both family and hired labour were used in the pond fish culture. Family labour included the farm operator himself/ herself and other members of his family i.e., brothers and children etc. Labour was measured in terms of man-day which usually consisted of 8 hours. For women and children, man equivalent hours were estimated. This was computed by converting all women and children hours into man-equivalent hours assuming 1 adult male =1.5 women =2 children. The average human labour cost per ha was Tk. 23576.
31
Table 4.2.2 Distribution of Human Labour Cost per Hectare per Year by Operations
Cost items Total labor (man-days) Cost (Tk.) % of total cost
Cleaning and pond
preparation
51 10200 43
Feed and fertilizer application 26 5200 22
Security 3 600 3
Chemical Application 6 1200 5
Fish harvesting and marketing 32 6376 27
Total 118 23576 100
Sources: Field survey, 2020
From the Table 4.2.1 it can be said that total cost of human labour for pond fish production was Tk. 23576 per hectare per year in which cleaning and pond preparation, feed and fertilizer application, security, chemical application, fish harvesting and marketing represented 43, 22, 3, 5 and 27 percent of the costs, respectively. That indicates most of the labour costs were included in cleaning and pond preparation, fish harvesting and marketing and feed and fertilizer application.
Figure 4.3: Cost of Labour on Different Items
0 5 10 15 20 25 30 35 40 45
Cleaning and pond preparation
Feed and fertilizer application
Security Chemical Application
Fish harvesting
and marketing 43
22
3 5
27
Number of labour
Distribution of labour per hectare
32 Cost of feed
It was found that almost all the farmers applied supplementary feed such as both rice- bran and oil-cake. It varied according to the intensity of cultivation. Farmers normally do not use pellet feed because it is costly and not available. In the study area, farmers applied rice bran 37595 kg per ha and oil cake 2045 kg per acre. Rice bran costs Tk.
1766967 per ha and oil-cake costs Tk. 112475 per ha. The average feed cost per acre was Tk.1879442
Cost of fertilizer
Fertilizer was generally used in the fishpond to create condition, which facilitates an increase in production of good quality natural fish feed, thereby increasing fish production. Farmers used three kinds of chemical fertilizers namely, Urea, Triple super phosphate (TSP) and Manure in the study area. The cost of fertilizer was charged at the prevailing market rate in the study area during pond fish culture season. Farmers applied Urea 371 kg per ha and TSP 169 kg per ha. Urea and TSP costs were Tk. 5194 and Tk. 3383 per ha, respectively. The average fertilizer cost per ha was Tk.8577.6.
Manure was important for fish production. It was observed that, farmers used cow-dung in fish ponds as manure in the study area. Cow-dung was home supplied and purchased.
The cost of cow-dung was calculated Tk.0.50/kg. It observed that farmers used 657 kg manure per ha per year. So, the average cost of manure per ha was Tk. 329. Lime application was an important factor for pond fish pond production. Lime was used mainly to neutralize acidity in the soil and water of pond. Lime assists in release of nutrient from the soil and promotes the bacterial breakdown of water material including green manure. The average quantity of lime used by fish farmers was 247 kg/ha per year. Average cost incurred for lime was Tk.4199.
Cost of insecticide
In this survey it is found that fish farmers in the study area used only cow dung as a manure for cultivating fish. Average cost incurred for cow dung was Tk. 1215.
Mechanical cost
In the survey it is found that shallow tube well was used for irrigation in the water bodies during the dry season. Shallow tube well was also used for safety of ponds.
Average cost of watering and mechanical cost of fish ponds was amounted Tk. 10092.
33 Cost of irrigation
Irrigation is another variables that was used in dry season. In the survey area it was found that average cost of irrigation was Tk. 6010 per hectare per year.
Other costs
The average other cost of pond fish cultivation was amounted Tk. 3500 per hectare per year.
Table 4.2.3 Per Acre Material Inputs Costs for Fish Farmers
Items of cost Quantity Price/Kg Total cost % of total cost
Rice bran 37595 47 1766967 93
Oil cake 2045 55 112475 6
Urea 371 14 5194 .26
TSP 169 20 3380 .17
Insecticide - - 1215 .06
Irrigation - - 6010 .30
Lime 247 17 4199 .21
Total 1899440 100
Sources: Field survey, 2020 Land use cost
Lease value of pond was consisted as land use cost. It was calculated at the rate of prevailing cash rental value of per ha pond land in the study area. Pond rental value was calculated at Tk. 120012 per ha for one year which shared 5.41 percent of total costs of pond fish production. This was treated as fixed cost in this study.
Cost on operating capital (IOC)
Interest on operating capital was calculated by taking into account the costs incurred on all field operations but excluding those items for those interest was already been calculated. On an average, the cost was estimated at Tk. 17035. It constituted 1 percent of gross costs (Table 4.2.3)