A thesis submitted in partial fulfillment of the requirements for the degree of Master of Science in the Department of Physics, Khulna University of Engineering & Technology. This is to confirm that the thesis work entitled “Study on Effect of Energy Fluxes in relation to the Movement and Intensity of Tropical Cyclones in the Bay of Bengal” has been carried out by KANIZ FATEMA at the Department of Physics, Khulna University of Engineering & . Mahbub Alam, Professor, Department of Physics, Khulna University of Engineering & Technology, Khulna, for his kind guidance and supervision and for his constant encouragement during the research work.
Shibendra Shekher Sikder, Head of Department of Physics, Khulna University of Engineering & Technology, for his strong support in various ways during the entire period of my studies in this department.
List of Table
CSLP : Central Sea Level Pressure DLHF : Downward Longwave Heat Flux DSHF : Downward Shortwave Heat Flux.
ABSTRACT
Introduction
Decosmo and Andreas (2002) showed that the lack of wind speed depends on high humidity and sensible heat transfer. Tao et al., (1990) showed that the prevailing microphysical processes were quite different between convective and stratiform regions and between mature and decaying phases. Rosenfeld et al., (2007) observed in their simulations that the suppression of warm rain through the addition of large amounts of aerosols will cause the tropical cyclone to deviate eastward.
Colon-Pagan (2009) found that the CAPE value is very low in their ARW model simulation near the center of the tropical cyclone.
Literature Review
Tropical Cyclone (TC)
Classification of Tropical Cyclone
- Convective Available Potential Energy (CAPE)
In the center of the eddy concentration, there is an unusual pressure drop of 2 - 3 hPa or more in 24 hours. CAPE exists within a conditionally unstable layer of the troposphere, the free convective level (FCL), where the ascending air parcel is warmer than the outside air. Where Tv is the apparent temperature of the plot, Tve is the apparent temperature of the environment, and g is the gravitational acceleration.
The negative energy exerted on an air parcel is the result of the air parcel being cooler (dense) than the air surrounding it, causing the air parcel to accelerate downwards.
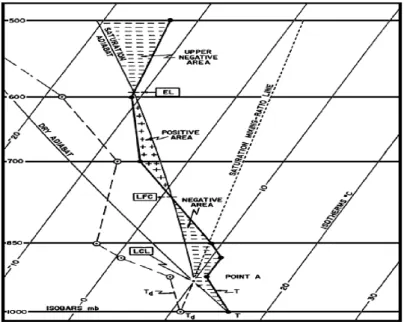
T CIN T
- Upward Heat Flux
- Latent Heat Flux
- Upward Moisture Heat Flux
- Radiation Flux
- Downward shortwave radiation flux
- Downward long wave radiation flux
- Outgoing Long Wave Radiation (OLR)
- Shortwave Radiation
- Weather Research & Forecasting (WRF) Model
- Kessler Scheme
- WRF Single Moment 3 (WSM3) - Class Scheme
- Ferrier Scheme
- WRF Single-Moment 6-class Microphysics Scheme (WSM6)
- Thompson et al., Scheme
- Cumulus Parameterization
- Planetary Boundary Layer (PBL)
Outgoing longwave radiation (OLR) is the emission of Earth radiation from the top of the Earth's atmosphere into space. Where is the emissivity of the surface in the long wavelength region, is the Stephan-Boltzmann constant and Ts is the absolute surface temperature. Note that when s 1 some of the incoming longwave radiation is reflected by the surface.
Memory, i.e. the size of the fourth dimension in these arrays is assigned according to the needs of the selected scheme, and species advection also applies to all those required by the microphysics option.
Model Description and Methodology
Model Description
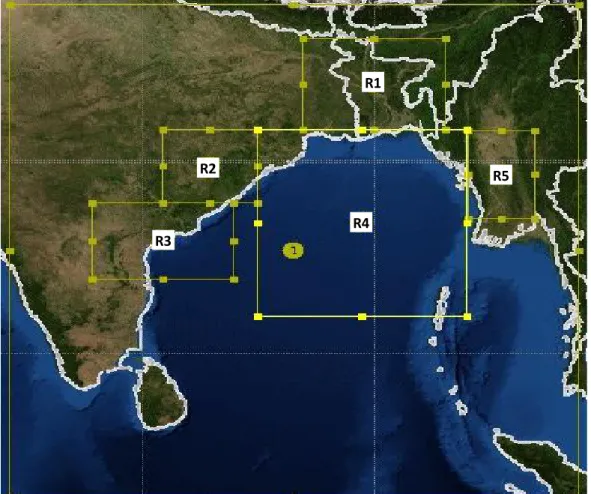
For the analysis of energy and its flows, the model domain is divided into 5 different regions.
Data and Methodology
Initial conditions Three-dimensional real data (FNL: 1° × 1°) Lateral boundary condition Specified options for real data. Upper boundary condition Gravitational wave absorbing Lower boundary condition Physical or free-riding diffusion and attenuation Simple diffusion. 24 experiments have been performed in each case using different microphysical schemes (e.g., Kessler, Lin et al., WSM3-class simple ice scheme, Ferrier, WSM6-class graupel scheme, and Thompson graupel) in combination with Kain–Fritsch ( KF) and Betts-Miller-Janjic (BMJ) CP schemes with different initial conditions.
The model simulated MSLP, maximum wind at 10 m height, track, convective available potential energy (CAPE), convective inhibition (CIN), downward longwave heat flux (DLHF), downward shortwave heat flux (DSHF), ground heat flux (GHF), latent heat flux (LH) , moisture heat flux (QFX), outgoing longwave radiation (OLR) and upward heat flux (HFX) have been studied and analyzed for three different cyclones. We divided the model domain into several regions R1 on the northern side of BoB, R2 on the northwestern side of BoB, R3 on the western side of BoB, R4 in the Oceanic region and R5 on the northeastern side of BoB. We calculated the energy and its fluxes in different regions using the Grid Analysis and Display Systems (GrADS) software.
The Grid Analysis and Display System (GrADS) is an interactive desktop tool used for easy access, manipulation and visualization of earth science data. Data from different data sets can be graphically overlaid, with accurate spatial and temporal recording. Data can be displayed using a variety of graphical techniques: line and bar graphs, scatter plots, smooth contours, shaded contours, streamlines, wind vectors, grid boxes, shaded grid boxes, and model plots of the station.
We have graphed the data in Excel at every 12-hour interval for observing the changing scenario of energy and its fluxes for TC movement. Paint (formerly Paintbrush for Windows) is a simple computer graphics program that is included with all versions of Microsoft Windows.
Results and Discussions
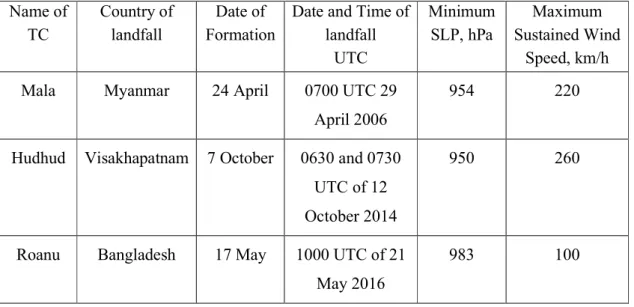
Tropical Cyclone Roanu
- Synoptic Situation Tropical Cyclone Roanu
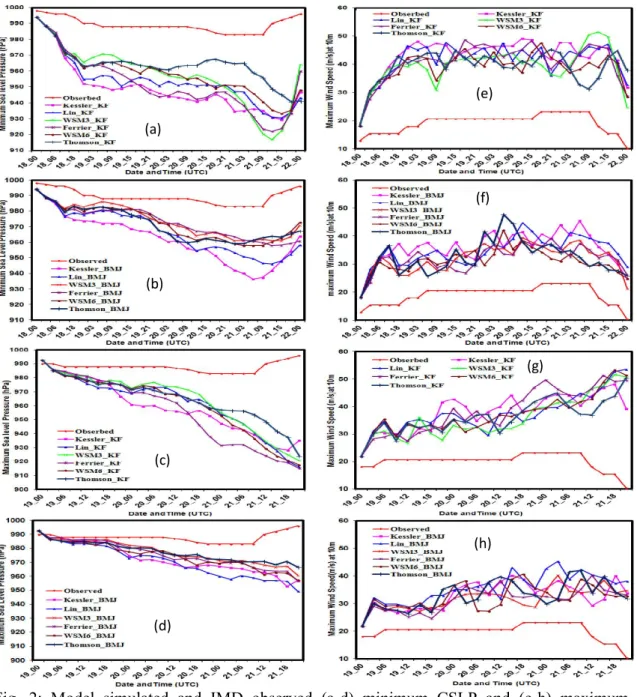
- Intensity of TC Roanu
- Track of TC Roanu
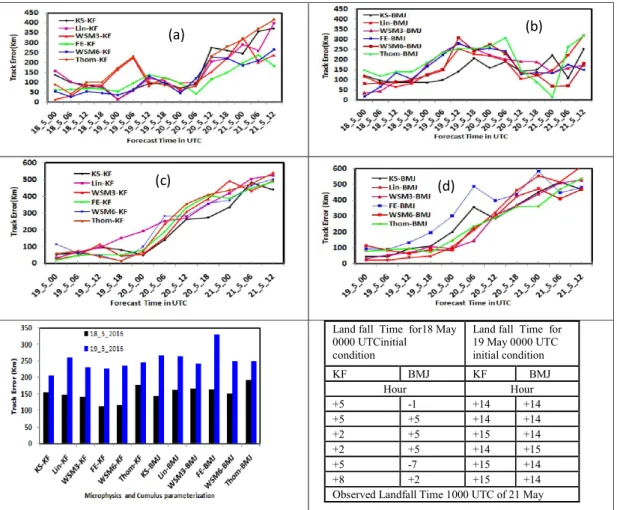
- Track Error of TC Roanu
- Convective Available Potential Energy (CAPE)
- Downward Long Wave Heat Flux (DLHF)
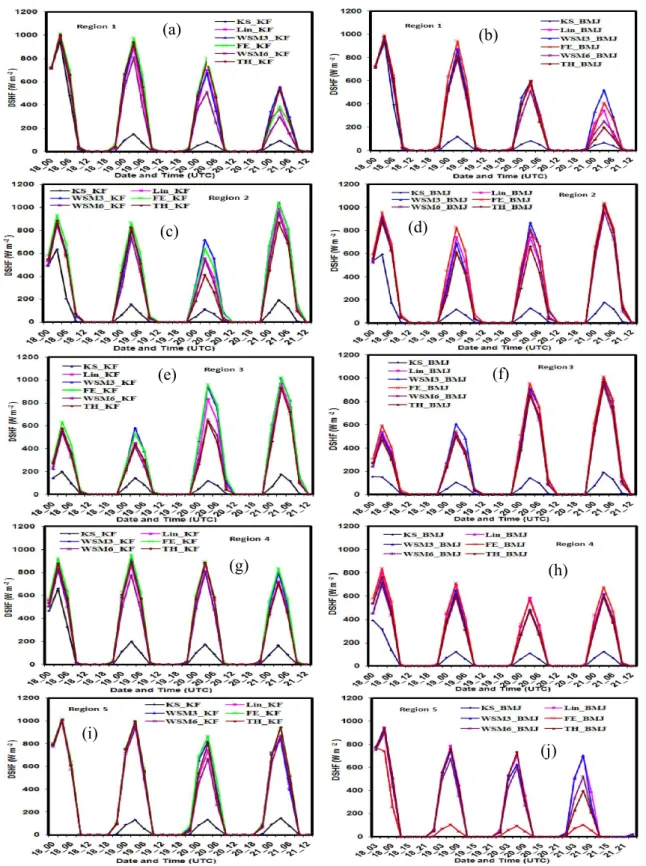
- Downward Short Wave Heat Flux (DSHF)
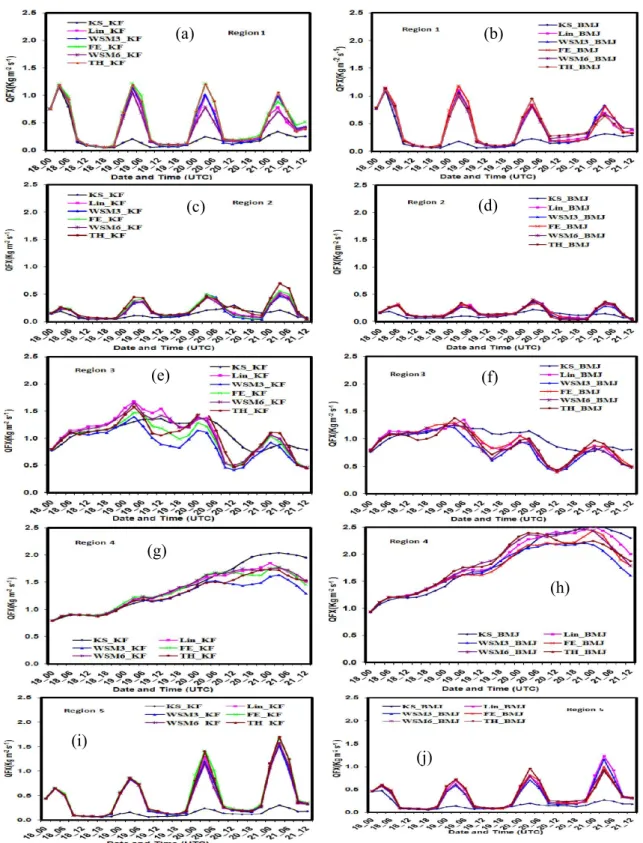
- Upward Moisture Heat Flux (QFX)
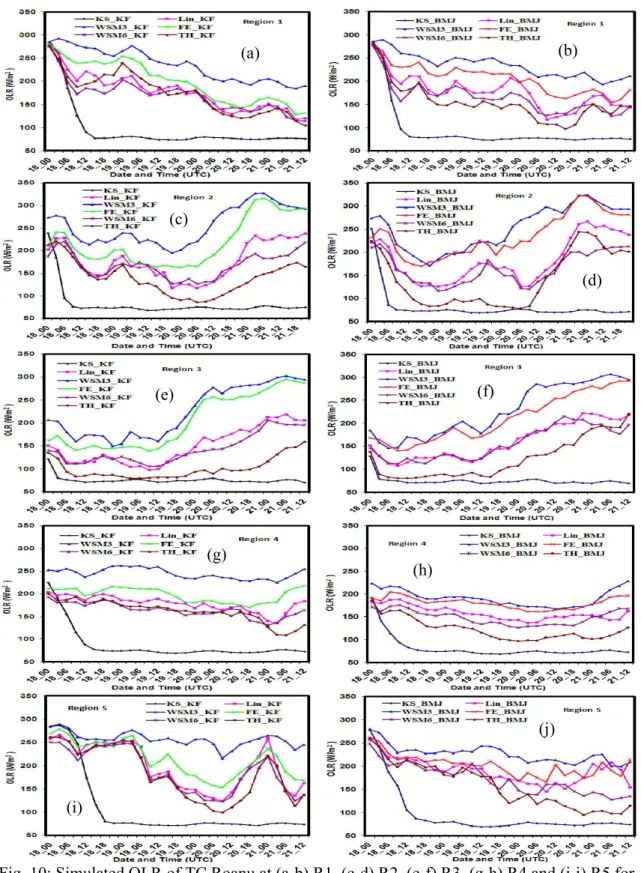
- Outgoing long wave radiation (OLR)
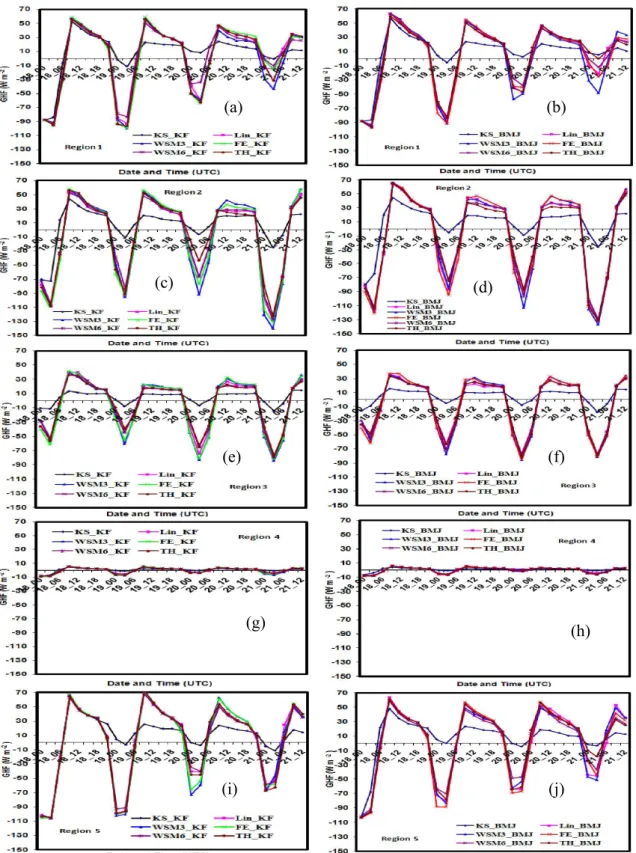
- Ground Heat Flux (GHF)
- Synoptic situation of Tropical Cyclone Mala
- Intensity of TC Mala
- Track of TC Mala
- Track Error of TC Mala
- Convective Available Potential Energy (CAPE)
- Downward Long Wave Heat Flux (DLHF)
- Downward Short Wave Heat Flux (DSHF)
- Upward Moisture Heat Flux (QFX)
- Outgoing long wave radiation (OLR)
- Synoptic situation of Tropical Cyclone Hudhud
- Intensity of TC Hudhud
- Track of TC Hudhud
- Track Error of TC Hudhud
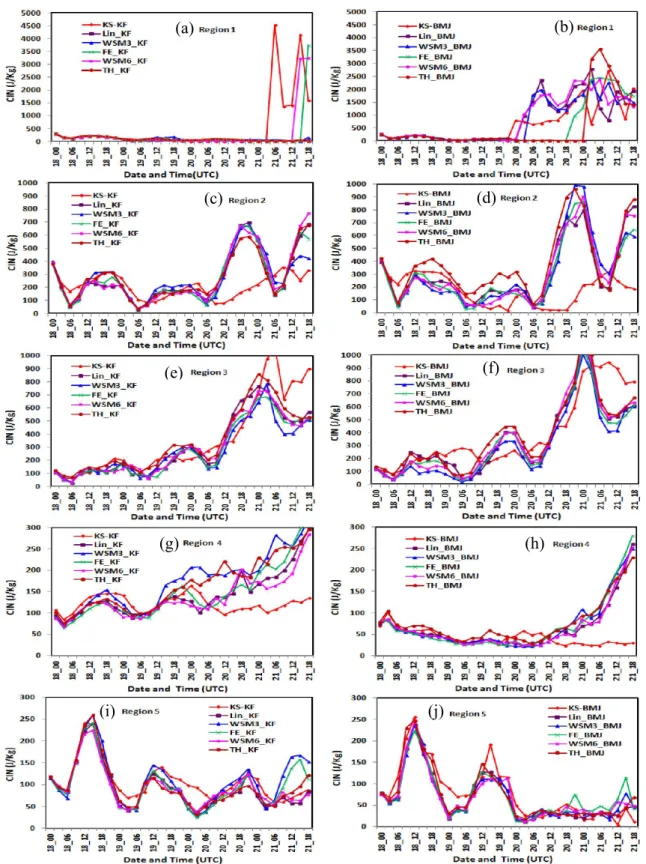
- Convective Inhibition Energy (CIN)
- Downward Long Wave Heat Flux (DLHF)
- Downward Short Wave Heat Flux (DSHF)
- Outgoing long wave radiation (OLR)
- Ground Heat Flux (GHF)
The swing crest turns out to be lower on 21 May for all MPs joining the KF and BMJ schemes. The swing crest is found to fall on 21 May for all MPs joining the KF and BMJ schemes. 8(a-b)) and the minimum peak is found on May 21 in R1 for all MP schemes in combination with KF and BMJ schemes.
10(g-h)) is almost constant with small deviations up to 0000 UTC of May 21 for all MPs in combination with KF and BMJ schemes. The oscillation amplitude of GHF is almost zero for all MPs coupling with KF and BMJ schemes in the oceanic region, i.e. 18 (gh)) for all MPs coupling with KF and BMJ schemes, and is found to decrease continuously take in the oceanic region, that is.
After 0000 UTC of 28 April, the CIN is found to be near zero for all MPs coupled with KF and BMJ schemes in R5. The peak of oscillation is found to decline on April 29 for all MPs connecting to KF and BMJ schemes. 19(c-d)) are almost similar but increasing in nature for all LP schemes in combination with KF and BMJ schemes.
R4, the DLHF is almost constant during the simulated time for all MP schemes in combination with KF and BMJ schemes. 23(e-f)) are almost constant in nature for all MP schemes in combination with KF and BMJ schemes. The amplitude of the oscillation of GHF is almost zero for all MPs coupling to KF and BMJ schemes in the oceanic region, i.e.
R4, the DLHF is almost constant for all MP schemes combined with KF and BMJ schemes over the simulated period. The amplitude of the GHF oscillation is almost zero for all MPs associated with the KF and BMJ schemes in the oceanic region, i.e. 35(i-j)) is almost constant for all MPs in combination with the KF and BMJ schemes during the cyclone period.
Conclusions
The track error with the April 27 initial condition is much smaller compared to the April 26 initial condition. The simulated CSLP for TC Hudhud for all MPs in combination with the BMJ scheme with the initial condition at 0000 UTC 8 October is almost equal and smaller than that of the 9 October initial condition. The 0000 UTC track error from the 9 October initial state is much smaller compared to the 8 October initial state.
The WSM6-KF combination has simulated most divergent tracks and the Thompson-BMJ has simulated less divergent tracks with respect to observed track of IMD with the initial state at 0000 UTC on October 8. The average track error using 0000 UTC from the 8 October initial state is much higher than that of 0000 UTC in the 9 October initial state. TC Roanu, Hudhud and Mala moved in Bangladesh, India and Myanmar and also the cyclone is moving in R1, R2 and R5 regions respectively where the cyclone is moving. The TC moves in a region where the vertically integrated spatial average of CIN is nearly constant and toward zero.
DLHF has found a decrease for TC Roanu at R1 and Mala at R5 at the time of landfall, while in the case of TC Hudhud it is an increase at R2. The cyclone moves in a direction where DSHF decreases to R1 for TC Roanu, to R5 for TC Mala and to R2 for TC Hudhud. The cyclone moves in a direction where QFX increases to R1 for TC Roanu, to R5 for TC Mala and to R2 for TC Hudhud.
The TC is moving in an area where OLR found it to be decreasing for TC Roanu in R1, for TC Mala in R5 and TC Hudhud in R2. The upward heat flux and ground heat flux decrease in the region where TC Roanu in R1, TC Mala in R5 and TC Hudhud in R2 intersect.
Chadwick, 1996: Air-sea exchange of water vapor and sensible heat: results from the Humidity Exchange over the Sea (HEXOS). Dudhia, J., 1989: Numerical study of convection observed during the winter monsoon experiment using two-dimensional mesoscale models, J. Tarpley, 2003: Implementation of the advance of the Noah land surface model into the operational mesoscale Eta model of the National Centers for Environmental Prediction, Journal of Geophysical Research, 108, D22, 8851.
Waters, 2012: Simulated relationships between sea surface temperatures and tropical convection in climate models and their implications for tropical cyclone activity. Mohanty, 2011: Sensitivity of physical parameterizations in forecasting Tropical Cyclone Nargis over the Bay of Bengal using the WRF model, Meteorol. Woodley, 2007: Simulation of hurricane response to warm rain suppression by submicron aerosols Atmos chem Phys.
Hguan, J., and Smit, 2007: Mechanisms for the intrapersonal variability of ozone during the winter monsoon in India, J. Kurihara, 1982: A note on the sea surface temperature sensitivity of a numerical model of tropical storm genesis. Wang, Y., 2001: An explicit simulation of tropical cyclones with a triple nested primitive equation model with movable mesh: TCM3.
Wang, Y., 2002: Explicit simulation of tropical cyclones with a triply nested moving grid primitive equation model - TCM3. Wang, 2010: Sensitivity of tropical cyclone inner core size and intensity to radial distribution of surface entropy flux Journal of the Atmospheric Sciences.
Conference Presentation