Introduction
Pressurized Irrigation
To distribute water evenly to plants in an irrigation system, Pressure Irrigation (PI) is used. One of the early PI technologies is the sprinkler irrigation system that requires overhead application of water (Bourzac [4]).
Micro-irrigation System
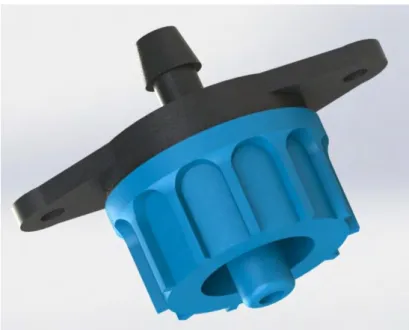
It offers higher crop yields compared to the sprinkler irrigation system with the same plant areas and amount of water. Emitters are small devices connected to the small diameter pipes that discharge water from a network under pressure (Oliver [6]).
Drip Irrigation System
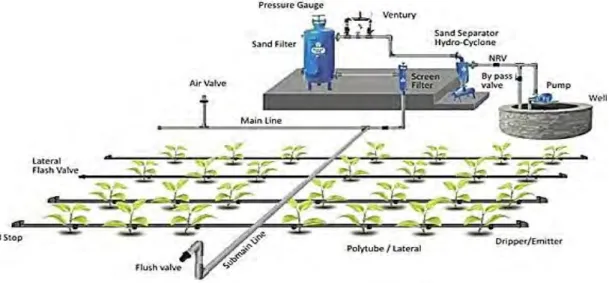
In any typical drip irrigation system, there would be a pumping device to pump the water into a network of plastic pipes called laterals (Fig. 1.1). The potential water application efficiency of drip irrigation systems is often quoted as greater than 90% (Golberg et al. [16] and Keller and Karmeli [17]).
Types of Drip Emitters
- Point Source Emitters
- Line Source Emitters
- Pressure Compensating Emitters
- Non-pressure Compensating Emitters
These emitters give a range of flow rates due to the pressure variation in the laterals, usually the flow rate increases at a certain rate with increasing pressure and decreases according to the pressure head characteristics of the flow of the emitters.
Impact of Drip Irrigation System
Motivation
Objectives of Study
Develop a computer model of the available transmitter to perform numerical simulation and obtain its pressure-discharge relationship. ii). Develop an experimental device for testing radiators and verify the results obtained by numerical simulation of a computer model with experimental data. v) To quantify the hydraulic characteristics of the newly designed pollutant along with other available pollutant in Bangladesh.
Layout of the Thesis
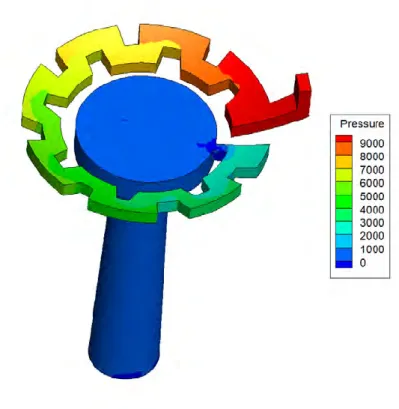
Visual representation of the pressure distribution in the lower part of the emitter El is shown in fig. The inlet of the lower part of the emitter is considered the main inlet in this study.
Literature Survey
Optimization of Drip Irrigation System and Water Saving
In order to be used in the field, the drip irrigation system should be optimized for maximum crop yield and maximum water saving potential. However, the overall effect showed that drip irrigation systems performed better than furrow irrigation systems.
Performance Measurement of Drip Irrigation System
The study concluded that the emitter type and water quality are the main factors affecting the hydraulic performance of drip irrigation systems. 33] conducted a laboratory experiment to evaluate the effects of water temperature and structural parameters of five different types of labyrinth channel emitters (three non-pressure-compensating and two pressure-compensating emitters) commonly used for subsurface drip irrigation systems.
Design of Drip Emitter
Therefore, the turbulent model can be adopted for the computational fluid dynamics method used to simulate the flow in the emitter path. There were a certain number of flow stagnation and vortex regions in the flow tab of the structural units of type K and M paths.
Summary
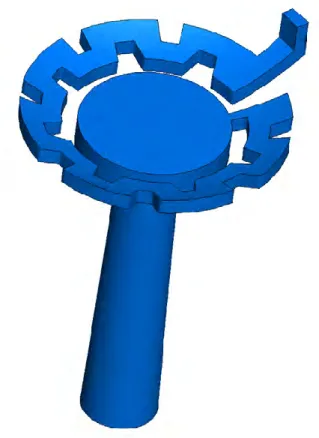
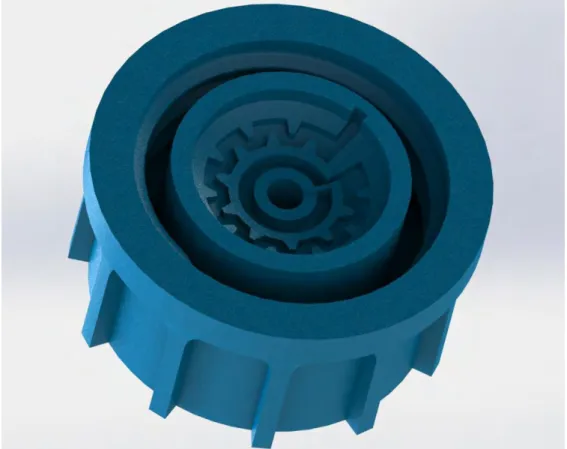
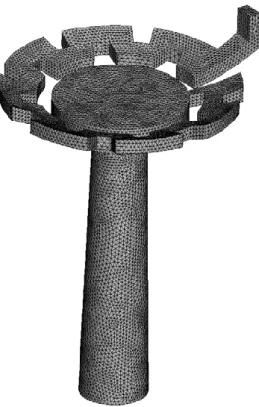
To numerically analyze the flow behavior inside the emitter, a 3D model of the emitter E1 is developed as shown in the figure. The fluid flow behavior inside the lower part of the emitter E3 is numerically analyzed using this computational domain.
Computational model and Simulation
Description of the Computational Domain
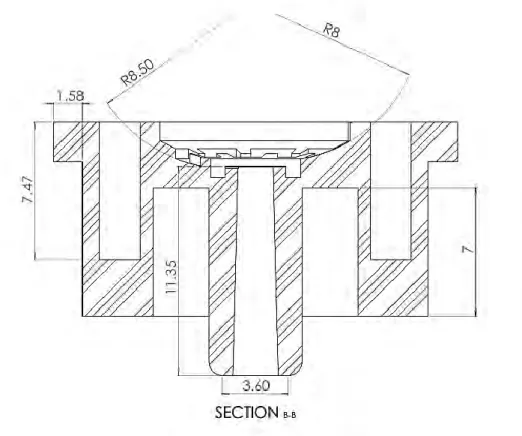
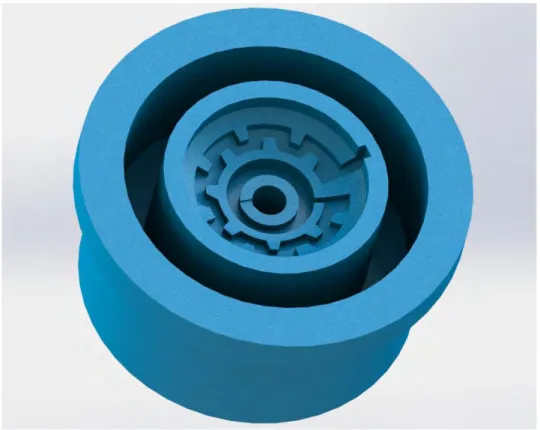
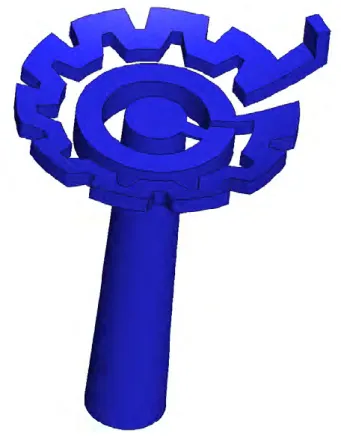
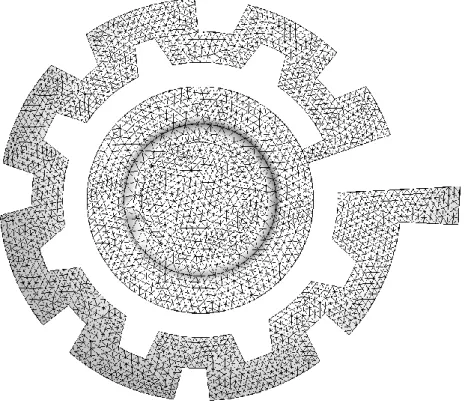
The top view and the side view along the line B-B of the lower part of the emitter E1 along with the dimensions (millimeter) are shown in Fig. The isometric view of the bottom of the emitter containing the labyrinth flow path is also shown in Fig. To numerically analyze the fluid flow behavior inside the lower part of the E1 emitter, the labyrinth fluid path is generated by the 3D model. of the lower part, shown in Fig.
For emitter E3, the path of the labyrinth fluid is also created from the 3D model of the lower part, which is shown in Fig.
Mathematical Model
In these equations, Gk represents the generation of turbulence kinetic energy due to mean velocity gradients and G represents the generation of ω. Yk and Y represent the distribution of k and ω due to turbulence, D represents the cross-diffusion term, calculated as described below. The term Gk represents the kinetic energy production of the turbulence and is defined as min(,10.
To blend these two models together, the standard k model has been transformed into equations based on k and , leading to the introduction of a cross-diffusion term.
Boundary Conditions
Numerical Method
- Discretization
- Discretization using Finite Volume Method
- Solver settings
- The cell-based couple Algorithm
- Mesh Generation
- Validation of the present numerical model
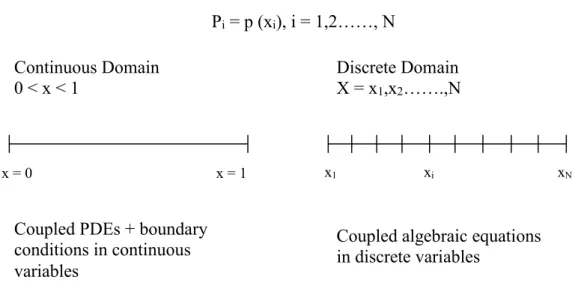
So in the discrete domain shown below, the pressure will only be defined at the N grid points. The finite volume method is a method for representing and evaluating partial differential equations in the form of algebraic equations. In the finite volume method, volume integrals are in a partial differential equation that contains a divergence term.
In the separated algorithm, the individual equations for the solution variables (e.g. u, v, w, p, T, k, ε, etc.) are solved one by one.
Experimental Setup
- High Pressure Experimental Setup
- Low Pressure Experimental Setup
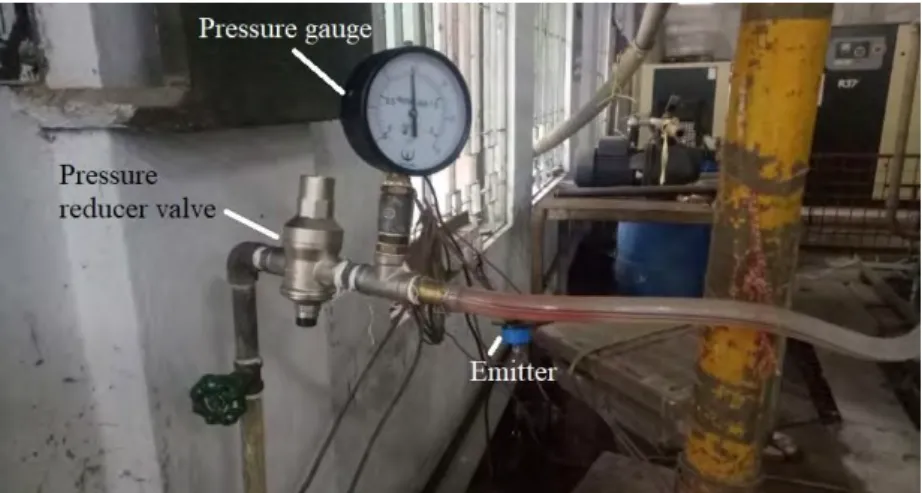
An experimental drip system was designed for the low-pressure experimental set-up, allowing for the placement of multiple side pipes per compartment. The supply and receiving pipes (OD 3.8 cm) were attached to both ends of the drip assembly (Figure 4.7a), and only the sides would pass over the open area of the pipes. It was important to keep the sides in the same position during operation and prevent them from moving.
Both the feeding and receiving sub-pipes were equipped with pressure gauges and an additional return valve to release air from the DI system.
Test Procedures
- Flow Measurement Procedure of the High pressure experimental setup
- Conditioning of the System for the Low pressure experimental setup
- Flow Measurement Procedure for the Low pressure experimental setup
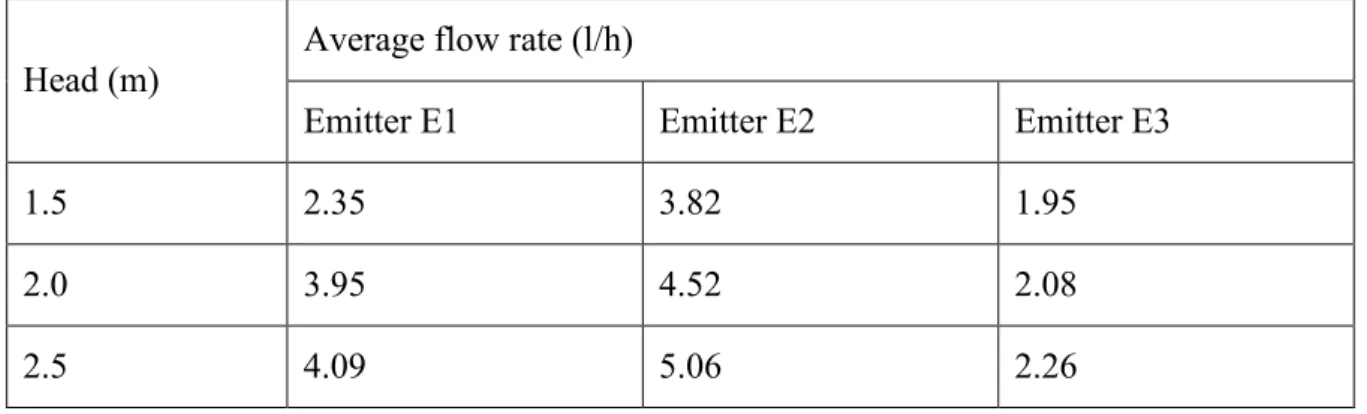
The equivalent volume of the collected water was then translated to obtain the hourly flow rate of an emitter reported as liters per hour. hour (l/h). The flow rate (𝑞̅) for a particular type of emitter in the DI system was then calculated by averaging the 𝑞̅i values (n = 4) for a particular pressure head:.
Performance Evaluation of the emitters
- Relationship between flow discharge and pressure head
- Characterization of Flow Regime
- Manufacturer’s Coefficient of Variation
- Relative Emitter Discharge
- Design Emission Uniformity
- Christiansen’s Coefficient of Uniformity
- Distribution Uniformity
- Emitter Flow Variation
As the pressure head increased, the discharge of the emitters also increased, however, at a different rate. As the pressure head increased, the trend of emitter discharge flow rate values was different for different emitters. For this reason, the characteristic parameters of emitter E3 together with emitter E1 and emitter E2 have been studied for low water pressure head regions).
A correlation between the discharge flow rate of the emitters and the pressure head is established using the results obtained from the numerical studies.
Results and Discussion
Visualization of the flow field in the emitters
To visualize the flow behavior inside the lower part of the emitters containing the labyrinth flow path, numerical studies have been performed for the emitter E1 and E3. However, in the case of emitter E3, the pressure is distributed in the labyrinth path and also in the circular path created by the modification of the emitter E1 design. From the figures, it is clear that the flow pattern inside the labyrinth flow path is the same for all pressures; however, the magnitude of the velocity increases with the increase in pressure.
The magnitude of the velocity also increases with increasing pressure, just as it was for emitter E1.
Head-Discharge Relationship
However, for emitter E3, the discharge flow rate has an increasing trend with a maximum percentage increasing value of 35.13%. Although the exhaust flow rate of emitter E3 is lower than emitter E1 for low pressure heads in this pressure head range. 5.10 (b) it is also clear that emitter E3 has a lower exhaust flow rate than emitter E1 and emitter E2 up to 4.5 m pressure head.
Therefore, the E3 emitter can be used to obtain low discharge flow up to 4.5 m pressure head and more.
Emitter Discharges along the Lateral Length
Since the value of the exponent for emitter E3 is the least, this emitter can behave somewhat like a pressure compensator than the other two. However, as the pressure head increases, the variation in the discharge flow rate of emitter E3 increases. For the pressure head of 1.5 m, emitter E1 has some differences than emitter E2 in discharge flow rate.
However, with increasing pressure head, some changes are observed in the E1 emitter discharge flow.
Effect of Head on Flow Variation
The figure shows that for a pressure head of 1.5 m, the transmitter E3 is almost constant, with fewer variations. With the increase of pressure head, the variation of emitter E2 also increases, which is higher for high pressure head and higher than the other two emitters. Finally, for constant discharge along the lateral emitter E1 should be considered first for higher pressure heads and the newly designed emitter E3 should be considered for lower pressure heads.
Effect of Head on Emission Uniformity
The result showed that the operating head has a significant effect on the EU values for emitters E1 and E2. It is clear that higher lift heights lead to higher uniform water distribution regardless of emitter. On the other hand, the EU (%) of emitter E3 is greater than 90% (98%), which is the highest of the three emitters, and this value qualifies emitter E3 as excellent.
General observations show that Emitter E1 and Emitter E2 have good EU values for 1.5m working pressure head, and Emitter E1 has excellent EU values for 2.0m and 2.5m pressure head, while Emitter E3 has excellent values EU for all pressure heights.
Effect of Head on Distribution Uniformity
Effect of Head on Statistical Uniformity
Since all emitters have high statistical uniformity and can be described as excellent, they can be used in a drip irrigation system. Finally, emitter E3 has better characteristics than emitter E1 and E2 at low operating pressure heights up to 2.0 m. Therefore, it can be used in drip irrigation system and will help in bigger and better crop in Bangladesh.
In conclusion, it can be said that the newly designed emitter E3 is very suitable for drip irrigation system and will show better performance than emitter E1 and emitter E2 which are available locally in Bangladesh.
Conclusions and Recommendations
Concluding Remarks
The visualization of the flow field of the emitters shows that emitter E3 is less sensitive to clogging than emitter E1. From the comparison of experimental and numerical results, it can be concluded that the new emitter E3 has a lower discharge flow rate than the other emitters in lower pressure head regions. Since the newly designed emitter E3 outperforms the other two emitters under low-pressure areas, the characteristic parameters of the emitters are evaluated at low-pressure height areas (1.5 m to 2.5 m of water).
The statistical uniformity for emitter E3 increases linearly with increasing operating pressure height and can be described as excellent.
Recommendations for Future Works
The highest value of the statistical uniformity of the discharge flow rate of the emitter means the uniformity of the discharge flow rate along the side of the drip irrigation system. However, only the flow behavior inside the bottom part that has the labyrinth flow path of the two emitters has been studied numerically. Since the effect of the elastic diaphragm is not taken into account in the numerical study, the results obtained from the numerical study have deviations from the experimental data.
Since the pressure at the inlet of the lower part is different from the pressure at the inlet of the radiator, the inlet of the radiator at the upper part can be considered as the main inlet for the study. In this study, the design of the new transmitter is modified in a special way. The effect of hydraulic height and slope on the uniformity of water distribution of a drip irrigation system.