However, it was deduced that even at 0.01 N solution strength the mass transfer resistance of the solid phase could not be completely neglected and that further improvement in the theoretical prediction could be made by taking the Ion exchange is a mass transfer process where ions are transferred from a solution to an ion exchange material (usually a solid, and usually a polymerized resin) while an equivalent number of ions of the same but different charge are transferred. For mass transfer from a single particle, analytical solution of the forced convective diffusion equation is at.
The constants of the above equation are obtained from the analysis of experimental data and theoretical considerations. In a review article, Beek (1) discussed the form of the correlation that would best describe mass transfer in both fixed and fluidized beds. Unfortunately, it does not help to calculate the value of the flux, since the film thickness is unknown.
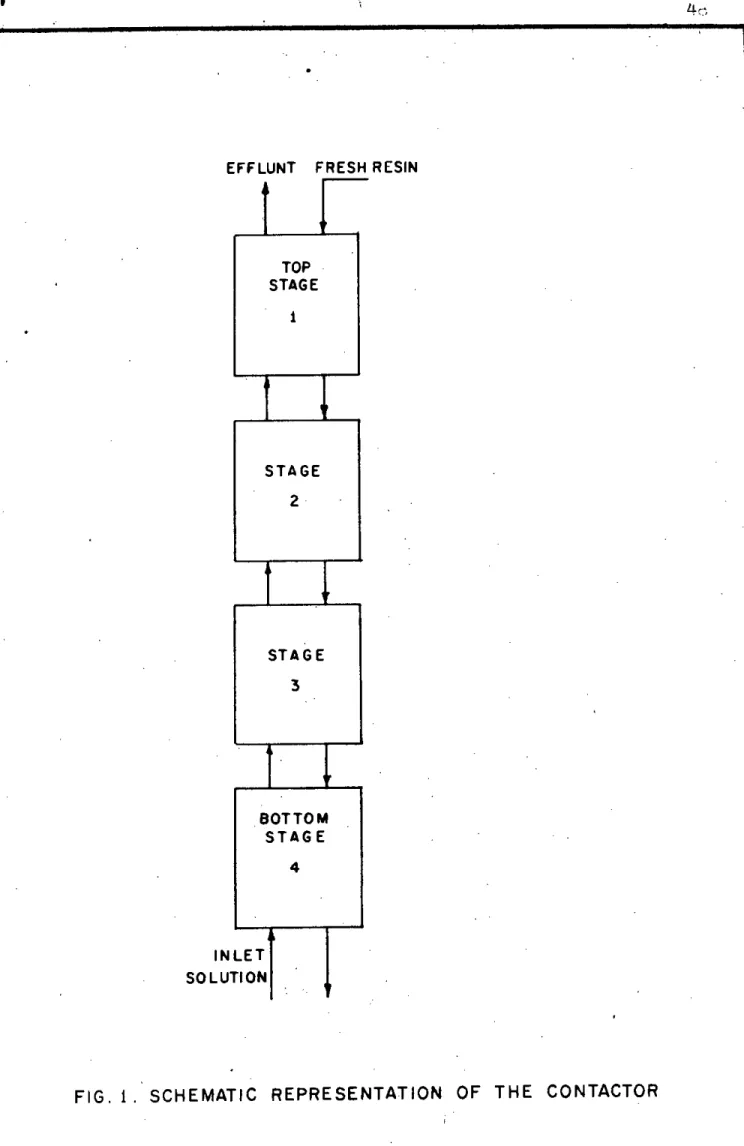
Details of the above analysis can be seen in some of the available \'lOrcon ion exchange kinetics that one can define an effective diffusivity as. Resin particles move do.m flow from stage to stage and could be removed from the base of the column. Controlling resin retention and bypassing the pregnant feed solution were serious problems.
In this way, a predetermined portion of the resin storage can be transferred per step.
THEORETICAL BACKGROUND
The ID9SS transfer coefficient, K:L, can be estimated from the shape correlation (see e.g. However, the differences in the arithmetic mean and the logarithmic mean value of the bulk concentration of GAb in one step are not significant for the present case and the arithmetic mean value can be used. Thus, the initial composition YAi' The next step is to assume a value of YAi and calculate the average value of bulk equivalent fraction ~ YAb = YAh + YAb Using this value of average bulk fraction the effective diffusivity value is calculated either from E.g. suggested by Wildhagen or from equations.
The straight contactor is an extension of the steps that have been described for a single step. The calculation is repeated until a satisfactory match is obtained, and then the calculation is switched to steps above the bottom step, where the final composition of the resin is given by the iri composition of the resin in the bottom step. In this way the calculation is transferred from step to step and the initial composition of the resin in the top step is calculated and this value is checked with the given feed.
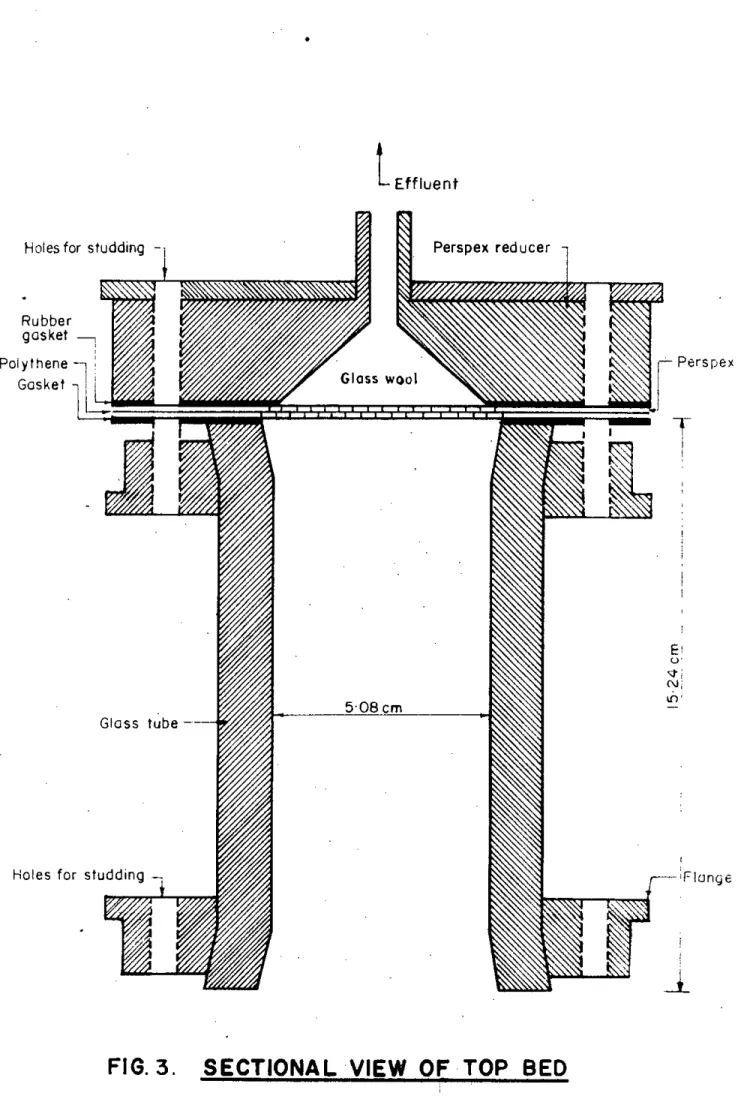
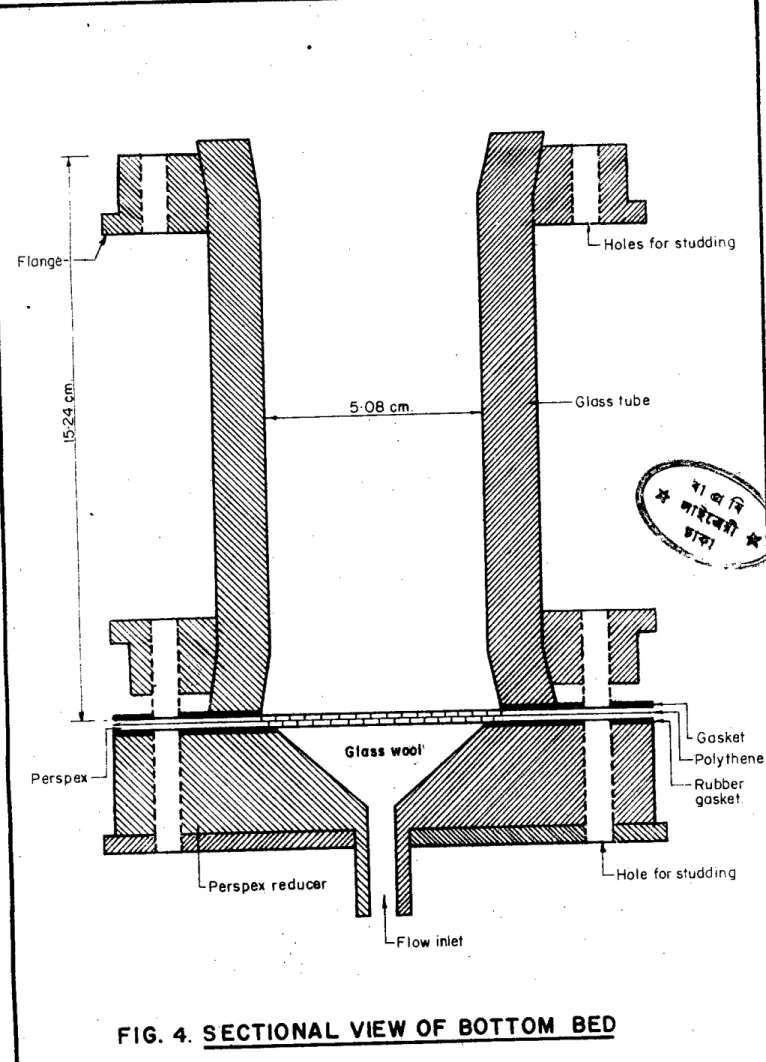
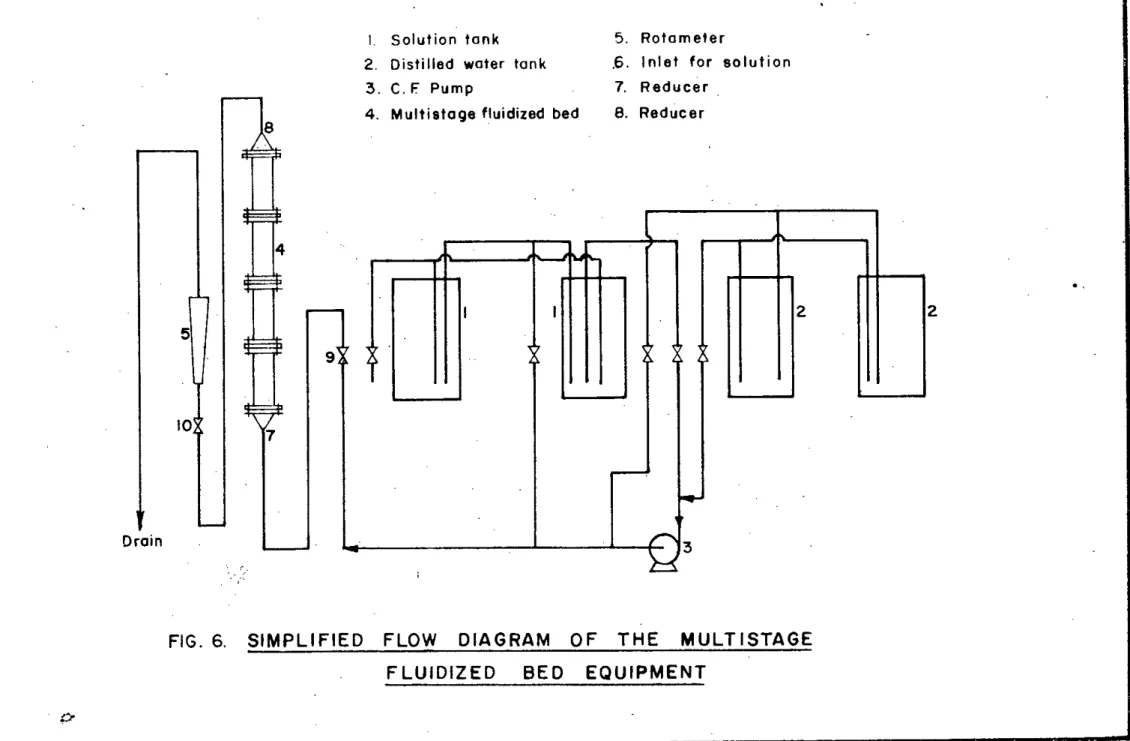
For a good test of a theoretical model, it is necessary to design an experiment that, as far as is feasible, fulfills the assumptions in obtaining the theoretical equations and, in addition, enables accurate measurement of the variables. 1 The reducers were filled ~ A glass oil would prevent resin particles from leaking out of the system. The rotameter was placed upstream of the fluidized bed and the solution passing through the rotameter was not reused.
Initially, W9S hoped to perform a continuous analysis of the effluent stream, but due to the lack of a continuous monitoring device, a batch method was ultimately used for the analysis of the effluent solution and resin samples. This is how it experiments.'erp. Conducted to determine the ion exchange equilibria of the given resin:01'Na+ - a+ system. This is probably because the eapae1ti depends on the concentration. This depends mainly on the nature and properties of the five ionic groups of the resin. 'While there may have been dec,:y of ionic ec;roups, reducing their concentration and thus .. capacity, the properties of a particular type of ion remained unchanged 'Tie the effect that the equilibrium behavior persisted: changed.
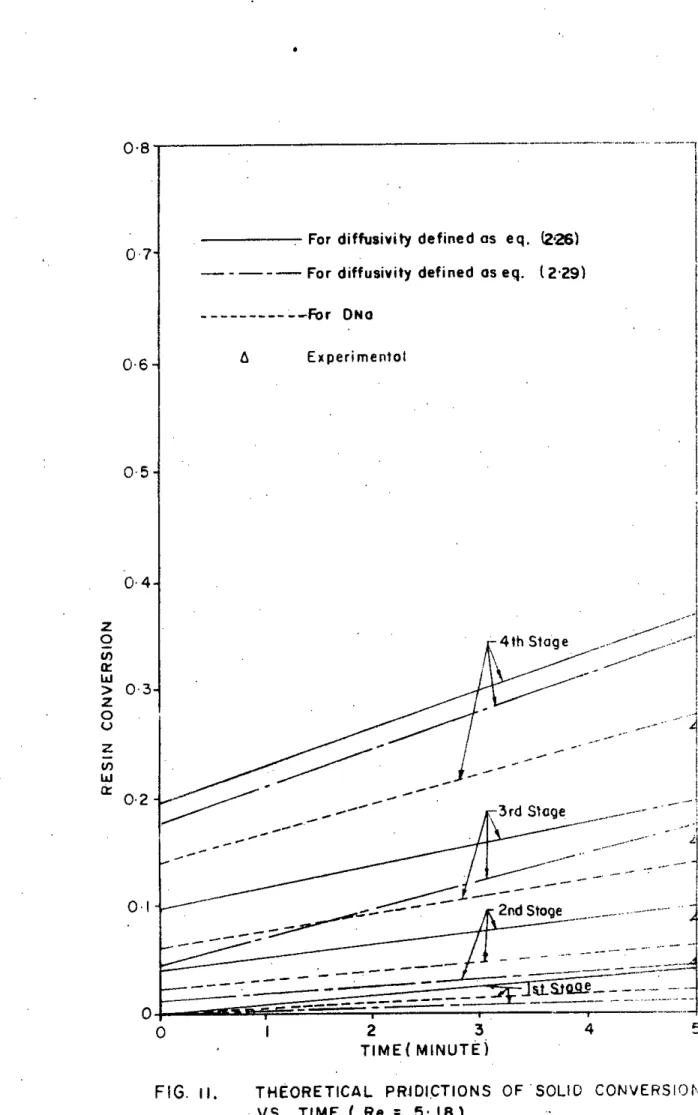
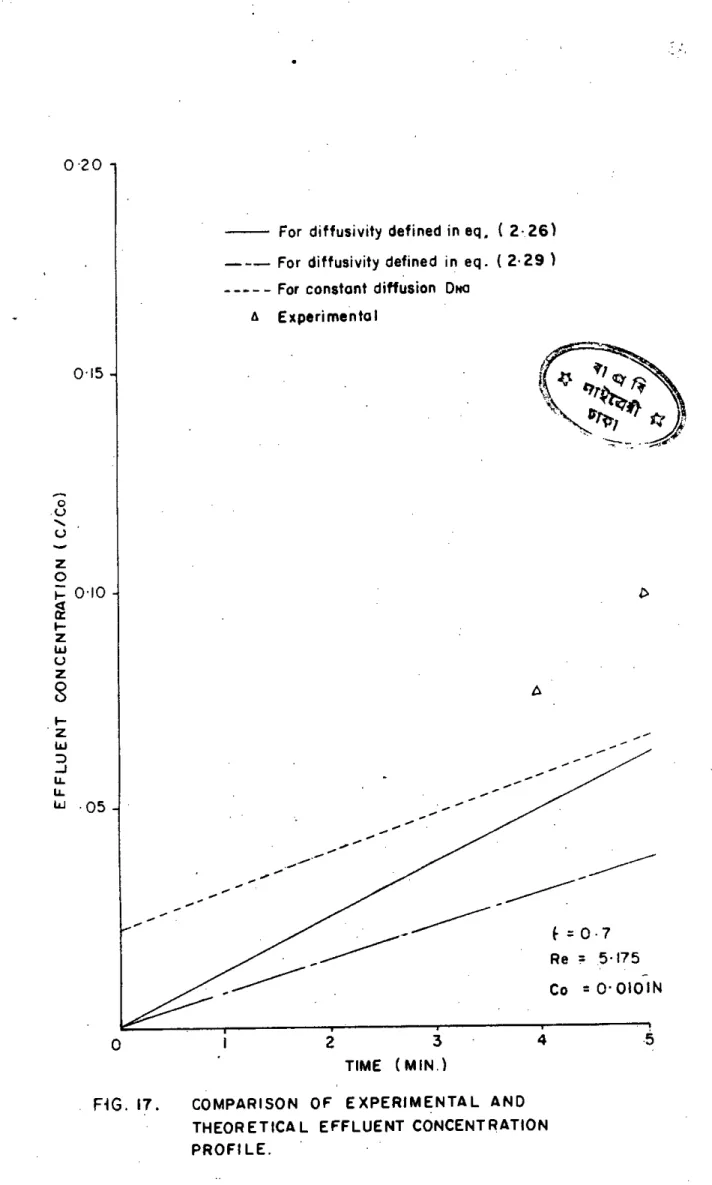
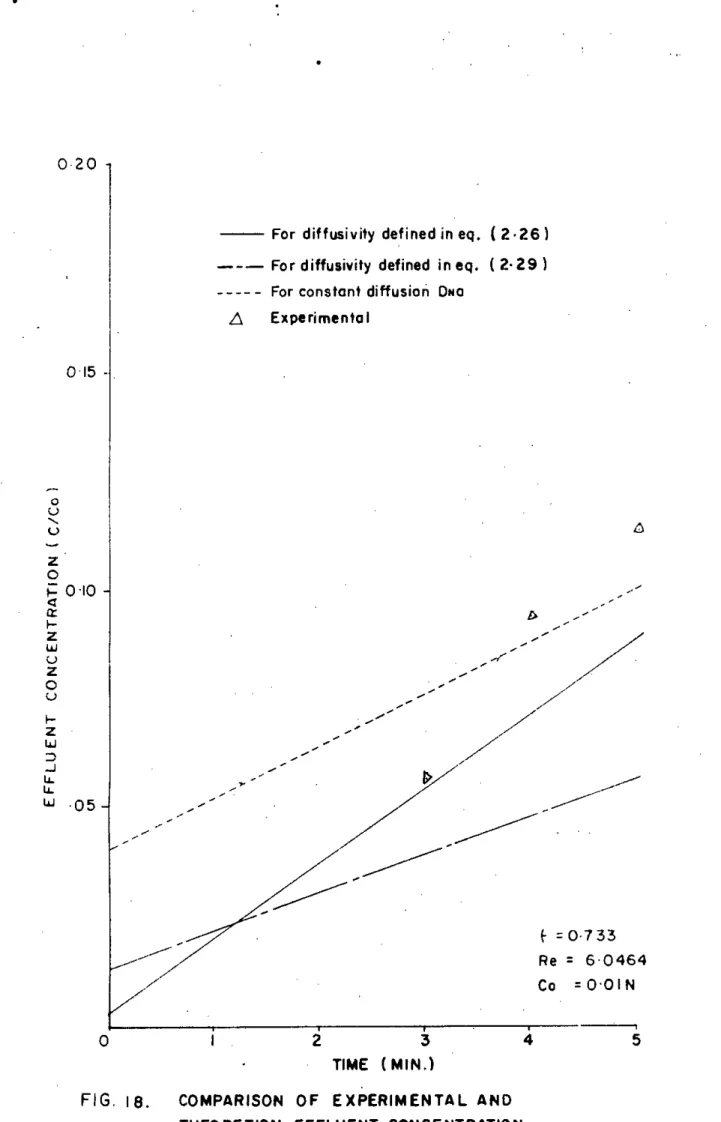
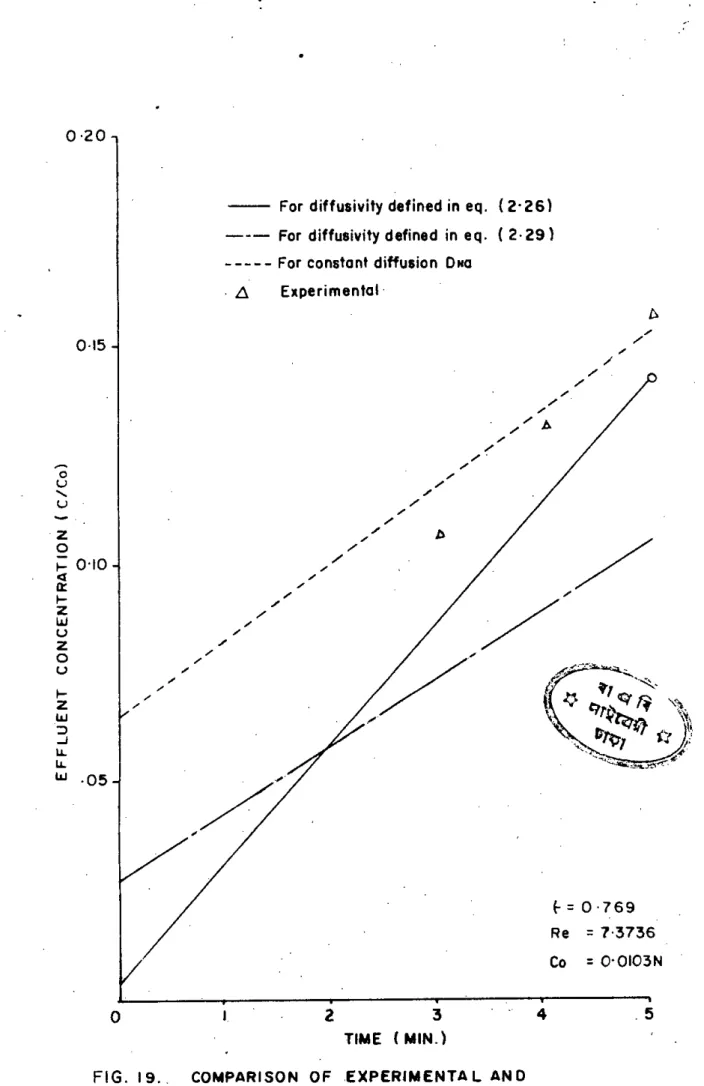
In this case, the effective diffusivities defined by Wildhagen (24) and Snowdon and Turner (22) were used. Also, since the diffusivity of Na+ ions is seven times lower than the diffusivity of H+ ions, it was thought that it would be instructive to perform theoretical calculations taking into account the diffusivity value of the slower ion, since it is commonly thought that the slower ion controls the rate of mass transfer. Comparison of theoretical and'experimental .al-. 2.26) appears to give reasonable agreement between theory and experiment for stages 1 to 3, i.e., as we go from top to bottom, albeit with an increase.
For a precise knowledge of mass transfer, it is necessary to have a good description of the velocity profile for the solid and liquid phases. Intitutively, complete mixing of the solids does not seem very unsatisfactory, from the assumption of plug flow of liquid is surely an oversimplification. It was considered not justified to estimate different parameters for the correlation given by Eq.
Nevertheless, taking all factors into account, the present work still provides reasonable insight into the overall operation of the contactor.
OAB;'