
i
Investigation of selective food-borne pathogens and quality evaluation of Dahi Marketed at Chattogram
Metropolitan Area of Bangladesh
Roll No. 0118/04 Registration No. 491
Session: 2018-2019
A thesis submitted in partial fulfillment of the requirements for the degree of Master of Science in Dairy Science
Department of Dairy and Poultry Science Faculty of Veterinary Medicine
Chattogram Veterinary and Animal Sciences University Chattogram-4225, Bangladesh
DECEMBER, 2019
ii
Dedicated To My
Beloved Family
iii Authorization
I hereby declare that I am the sole author of this thesis. I also authorize the Chattogram Veterinary and Animal Sciences University (CVASU) to lend this thesis to other institutions or individuals for the purpose of scholarly research. I further authorize CVASU to reproduce the thesis by photocopying or by other means in total or in part, at the request of other institutions or individuals for the purpose of scholarly research.
I, the undersigned, and author of this work, declare that the electronic copy of this thesis provided to the CVASU Library, is an accurate copy of the print thesis submitted, within the limits of the technology available.
...
Setara Akter December, 2019
iv
Investigation of selective food-borne pathogens and quality evaluation of Dahi Marketed at Chattogram Metropolitan
Area of Bangladesh
Roll No. 0118/04 Registration No. 491
Session: 2018-2019
This is to certify that we have examined the above Master’s thesis and have found that the thesis is complete and satisfactory in all respects, and that all revisions
required by the thesis examination committee have been made
...
Professor Dr. A. K. M. Humayun Kober
Supervisor ...
Assistant professor DR. Nasima Akter Co-Supervisor
...
Professor Dr. A. K. M. Humayun Kober Head & Chairman of the Examination Committee
Department of Dairy and Poultry Science Faculty of Veterinary Medicine
Chattogram Veterinary and Animal Sciences University Khulshi, Chattogram-4225, Bangladesh
December, 2019
v Acknowledgements
First and foremost , I praises and thanks to the Almighty “ALLAH ‟‟ for His showers of blessings throughout my research work to complete the research successfully for the degree of Master of Science (MS) in Dairy Science under the Department of Dairy and Poultry Science, Chattogram Veterinary and Animal Sciences University (CVASU) .
I would like to express my heartfelt gratitude, profound appreciation and indebtedness to my research supervisor Dr. A. K. M. Humayun Kober, Professor and Head, Department of Dairy and Poultry Science, CVASU for his cordial help to conduct this experiment and also for overall supervision, valuable suggestions, critical but constructive criticisms, helpful comments which made easy for successful completion of this thesis.
I am indebted to my co-supervisor DR. Nasima Akter, Assistant Professor, Department of Dairy and Poultry Science, CVASU for her valuable advice, constant guidance and encouragement during the experiment.
I sincerely thank to the Coordinator of Advance Studies and Research for providing research fund to complete my research work.
I would like to expresses my gratitude to all technical and non-technical staffs of the Poultry Research and Training Centre (PRTC), CVASU for their cordial helps during the research period.
I sincerely thank to all the teaching and technical staffs of the Department of Dairy and Poultry Science for their help.
I am extremely grateful to my parents, friends and family whose blessings and sacrifices and encouragement in every steps of my life can never be repaid.
The Author December, 2019
vi
Table of Contents
Chapter
List of Contents
Page no.
Authorization………...………...
III Signature page ………...………….………... IV Acknowledgements...……...……… V List of abbreviations...…………...……..………….…. VIII List of Tables... IX List of Figures………...…………...
X Abstract………...………...
XI Chapter-I
Introduction ...,…………...………...….… 1-4 Chapter-II
Review of Literature ...…..…...…………... 5-17
2.1
Difference between yogurt and dahi……...…...
5
2.2
Classification of dahi………...
6
2.3 Food and nutritive value of dahi………...
7
2.4 Chemical and Microbiological quality of dahi……...…
9
2.5 Standards and Standardization of yogurt or dahi...
14
2.6 Disease caused by the microbes...
15
Chapter-III Materials and Methods…….………...…....…. 18-26 3.1 Study area...
18
3.2 Study period...
18
3.3 Materials………....…...
18
3.4 Flow chart of study design ………...…. 19
3.5 Methods………....…...
19
vii 3.6
Statistical analysis...………...
26 Chapter-IV Results………...…...………...
27-35
4.1 Chemical analysis………...
27 4.2 Microbial count………... 29 4.3 Biochemical Characteristics of bacterial isolates of different samples.. 33 Chapter-V
Discussion………..………...………… 36-38 Chapter-VI
Conclusion………...…… 39 References………..………...….. 41-48 Appendix... 50-52 Brief Biography………...…..………. 53
viii List of Abbreviations
Abbreviation Elaboration
EMB Eosin Methylene Blue
XLD Xylose lysine deoxycholate agar
Mac Mac conkey agar
Sp. Species
No. Number
E. coli Escherichia coli
°C Degree centigrade
Kg Kilogram
Mg Milligram
gm
Gram
˂ Less than
˃ Greater than
= Equal
cfu
Colony forming unit
Fig
Figure
e.g Example
et al. And his associates
etc. Et cetera
% Percentage
i.e. That is
Sig. Significance
Ref. Reference
FAO Food and Agriculture Organization
WHO World Health Organization
FDA Food and Drug Administration
UHT Ultra High Temperature
APHA American Public Health Association
ix
MS Master of Science
CVASU Chattogram Veterinary and Animal Sciences University
List of Tables
Table 1 : Chemical standard of dahi………...………...
10 Table 2 : Microbiological standard of dahi...
11 Table 3 : Chemical analysis of local and branded dahi collected from
Chattogram Metropolitan Area...
27 Table 4 : Chemical analysis of branded dahi collected from
Chattogram Metropolitan Area...
28 Table 5 : Total bacterial count of collected dahi sample marketed in
Chattogram Metropolitan Area... 29 Table 6 : Biochemical characteristics of sample in different
biochemical test... 34
x List of Figures
Figure 1: Benefit of dahi consumption ... 1
Figure 2: Source of contamination ...
3
Figure 3: Map of Chattogram Metropolitan Area showing study area...
18
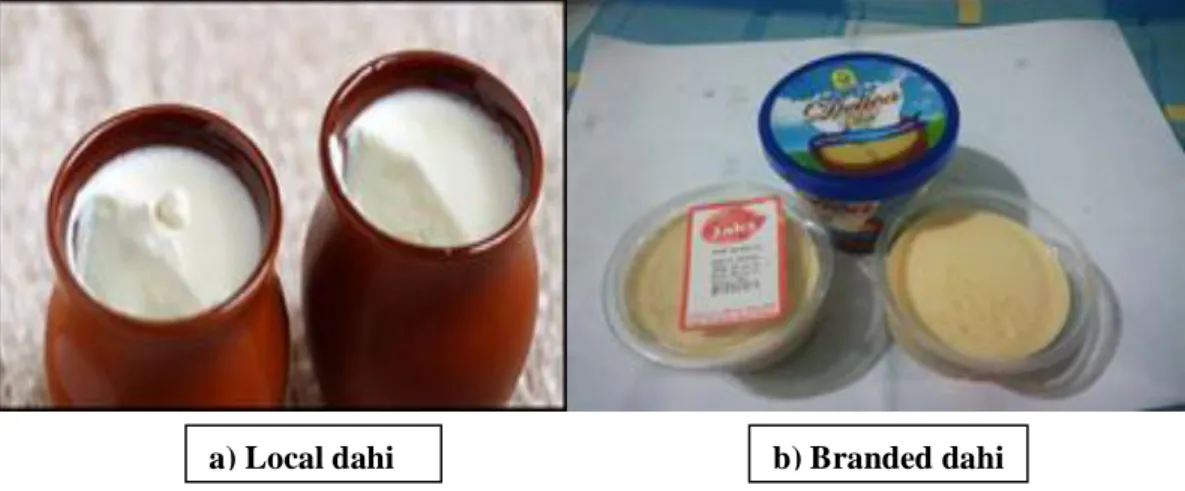
Figure 4: Local and Branded dahi Sample... 20
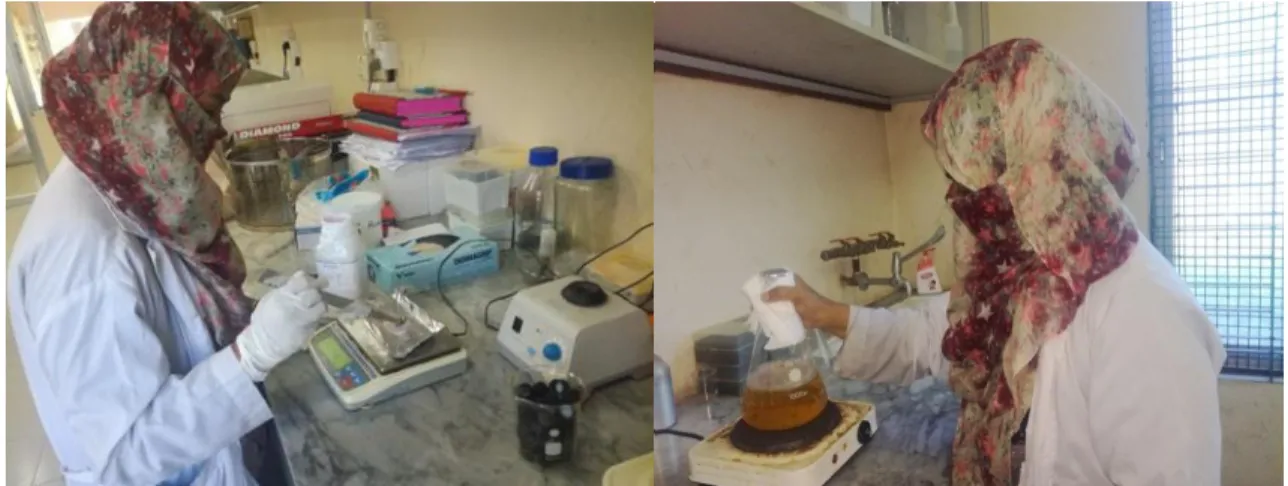
Figure 5: Collection of sample... 20
Figure 6: Agar media preparation...
23
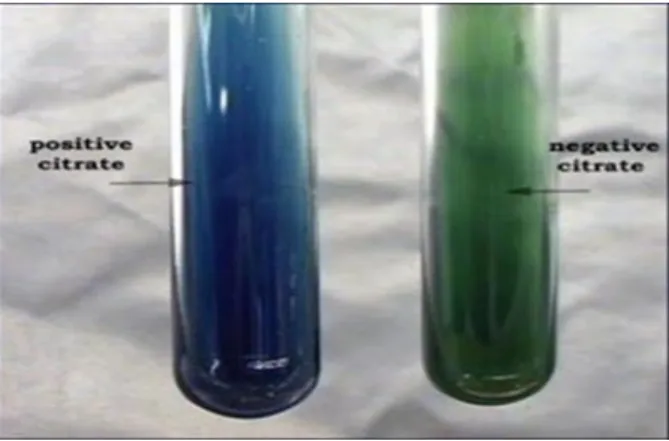
Figure 7: Results of biochemical test...
25
Figure 8: Fat, protein and acidity percentage of dahi...
29
Figure 9: Total Viable bacterial count under colony counter... 32
Figure 10: Absence of growth of organism in selective media... 33
xi Abstract
Fermented milk products are part of the diet in many parts of the world and are consumed on a regular basis. Enhancing the nutritional and therapeutic properties of traditional fermented milk can improve the global public health. Dahi quality and safety is an increasingly important public health matter. Dahi might be contaminated with pathogens due to poor packaging, unhygienic handling and inadequate transport system. Presence of these organisms are critical for the safety of fermented products during consumption.
Measures should be taken to interrupt the transmission of pathogens to dahi at the household level. So, the aim of this study was to isolate the zoonotic microorganisms (Escherichia coli and Salmonella sp) and evaluate the quality of dahi samples marketed at Chattogram metropolitan area. A total of fifty (50) dahi samples (local and branded) were collected from July to October 2019, in different shops of Chattogram metropolitan area and tested for the presence of E. coli and Salmonella sp as well as for the total viable count of bacteria. Collected samples were also examined for their chemical quality (acidity, fat and protein percentage). All the samples were inoculated on respective selective bacteriological media for primary isolation of the pathogens of interest. Then the positive isolates were subjected to different biochemical tests for further confirmation. At the same time some qualitative tests of the dahi samples were also performed followed standard laboratory procedure. Significant differences were found in microbial (total viable count) and chemical (percentage of acidity, fat, protein) quality of dahi samples. The average percentage of fat, protein and acidity collected dahi samples ranges from 3.43±0.18 to 3.58±0.11, 4.58±0.34 to 5.13±0.17 and 0.87±0.02 to 0.75±0.03, respectively. The total viable count of all samples ranges within the standard level. All the samples were negative for E. coli and Salmonella sp, that indicates proper hygienic handling, preparation, marketing and storage of dahi. Since all the collected dahi samples of this study were negative for E. coli and Salmonella sp, so it can be said that the dahi samples that were collected from different retail shops of Chattogram metropolitan area were safe for human consumption.
Key words: Dahi, E. coli, Salmonella sp, Public health
1 Chapter-I
Introduction
Fermented dairy foods play an important role in the human diet. Dahi is a popular indigenous fermented milk product throughout South Asian countries such as Bangladesh, India, Nepal, Pakistan, Sri Lanka, etc. Curd (Dahi) and yoghurt are two different fermented dairy product, differing in the method of preparation. But in our country, both curd and yoghurt are termed as Dahi. The word curd is used in Indian English to refer to traditional probiotic yoghurt, while the term yoghurt refers to the pasteurized variety. Dahi is easy to digest and has been found to reduce the risk of cardiovascular problems and cancerous tumors, besides strengthening general immunity (Sinha and Sinha 2000). Yoghurt, a western counterpart of dahi, besides its nutritive value, is believed to be effective in both the prevention and treatment of various illnesses such as gastrointestinal disorders, heart diseases and tumor development, in man as well as animals (Deeth and Tamime 1981).
Several health benefits of dahi and yoghurt have been reported (Arvind et al. 2009; Pala et al. 2011; Yadav et al. 2008).
People who regularly consume dahi gets a lot of benefit from it (Fig.1). Considering the benefits of eating yoghurt, from regulating
bowel movements and promoting a healthy gut to fighting infections, we should incorporate this super food into our diet every day. It contains all the nutrients present in milk except a little variation in lactose content. People who has lactose intolerance syndrome can easily digest dahi. Dahi has also a special social value as being served and consumed in all festivals and occasions. Mainly two types of dahi are available in local markets here, sweetened / mistidahi (sugar added) and
Figure 1: Benefit of dahi consumption
2 sour dahi and both are prepared by a traditional method using previously made dahi (starter). Dahi, especially sweet dahi, is one of the most popular fermented milk products of Bangladesh.
The nutritive value of milk and products rely on their cleanliness, purity and wholesomeness. Although, fermented milk products are safer foods i.e. disease producing organisms cannot survive there in high acidity, still if contamination occurs then in most cases yeasts and molds and sometimes coliform organisms can grow somewhat, if this is having proper nutrition. According to US public health milk and milk products should not contain more than 20,000 bacteria/gm and 10 coliform bacteria/gm (Bhowmick et al., 2006). That is why; a desirable standard for the manufacture of dahi should be established according to the average consumers of Bangladesh. Traditional method invariably involves production on a small scale, either in the consumer‟s household or in the sweetmeat- maker‟s shop in urban areas. In the household , milk is heated to boiling temperature until volume is reduced up to 15-20% and 8-10% sugar added (sweetened dahi), cooled down to body temperature, inoculated 2-3% starter and poured into earthenware and kept for curd formation overnight by wrapping woolen cloth or straw or jute bag to maintain warmth. In the shops, the method is more or less the same and dahi is usually set in suitable containers (earthenware/ glass bottles/plastic cups) of the required capacity (Dey et al., 2011). Most of the producers are used earthenware for setting dahi to firmness rather than glass bottles/
plastic cups. Earthenware is assisting to absorb and evaporate a little amount of moisture from the dahi resulted more firmness. The quality and color of dahi are varies from shop to shop and area to area depending by using the different proportions of starter culture and color additives. Various means and methods are adopted in its preparation that results in variations among the quality of products. Although, dahi is prepared without any care of quality control and hygienic conditions and contain a lot of contaminants, which may be health hazardous spontaneously. In Bangladesh, dahi are sold almost in open markets and kept on shelf at ambient temperature. On the other hand, A few sellers of city areas are kept their products in refrigerators for prolonging storage and other kept their products at room temperature which is prone to deterioration of both chemical and microbial quality of dahi (Fig. 2).
3 Figure 2: Source of contamination
Dahi quality and safety is an increasingly important public health issue. Nowadays, the topics “food quality” and “food safety” are very close and two important issues in the food sector, due to the globalization of the food supply and the increased complexity of the food chain. The consumers need to purchase safe products that do not involve any kind of risk for health. On one hand, the aim of the “food safety” is to avoid health hazards for the consumer: microbiological hazards, pesticide residues, misuse of food additives and contaminants, such as chemicals, biological toxins and adulteration. On the other hand,
“food quality” includes all attributes that influence the value of a product for the consumer; this includes negative attributes such as spoilage, contamination with filth, discoloration, off-odors and positive attributes such as the origin, color, flavor, texture and processing method of the food.
The contamination of food products with microorganisms presents a problem of global concern, since the growth and metabolism of microorganisms can cause serious food borne intoxications and a rapid spoilage of the food products. Thus, the acceptance and safety of
4 a food product for the consumers depends in great part on the presence and nature of microorganisms. Besides molds and yeasts, bacteria are the principle responsible for various types of food spoilage and food borne intoxications. It has to be mentioned that a food product naturally contains an indigenous microbiota that can include spoilage and/or pathogenic bacteria species. Depending on the preservation method these species can proliferate and adulterate the product. However, most bacterial contamination occurs during processing and manipulation of the food products.
The presence of Escherichia coli and Salmonella sp in Dahi represents an internationally accepted human health concern. Although Salmonella causes many food borne disease outbreaks, there is little evidence to support cross-contamination as a major contributing factor. However, the paramount importance of preventing cross-contamination and recontamination in assuring the safety of foodstuffs is well known. Sources and factors linked to cross-contamination and recontamination of Escherichia coli and Salmonella sp in foods are reviewed in detail. Those foods which are not submitted to lethal treatment at the end of processing or which do not receive further treatment in the home deserves special attention. Escherichia coli and Salmonella sp cross-contamination and recontamination episodes have been connected to the following factors: poor sanitary practices and equipment design, deficient control of ingredients etc.
Knowledge concerning the microbiological quality of commercialized dahi is valuable because the consumption of contaminated food may cause food-transmitted diseases (FTDs), thus, representing a public health problem. The quality and safety of milk products are determined by the presence of indicator bacteria. Hence, milk and milk products easily favors the growth and multiplication of pathogenic bacteria which may serve as vehicle for the transmission of diseases to humans such as salmonellosis, diarrhea, food poisoning, tuberculosis etc. So microbiological assessments have an important role to play in the dairy industry to protect the public health and to reduce economic losses.
In this context, the present study was conducted to isolate the food-borne pathogens such as Escherichia coli and Salmonella sp and evaluate the quality of marketed dahi and the general sanitary practices prevailing during processing and handling of dahi .
5 Chapter - II
Review of Literature
Fermented dairy foods such as dahi or yoghurt contain a unique package of nutrients that are an essential part of a healthy eating plan. It is the food for which there seems to be no adequate substitute and is one of the widely consumed products. Milk products such yogurt, spicy yoghurt milk, butter milk are also rich in proteins, spices and minerals which made them widely expectable for their nutrient values. Milk and other fermented milk products is highly susceptible to contamination by microorganisms and it is also a suitable medium for the rapid growth and multiplication of bacteria at favorable temperatures (Megha S.V. and Annadurai B., 2014). That„s why it is important to know what particular microorganisms can potentially contaminate milk products because in South-Asian countries, improper processing conditions of dairy products are very prevalent making the products unhygienic.
2.1. Difference between yoghurt and dahi
According to the PFA rules (1976), “dahi or curd is the product obtained from pasteurized or boiled milk by souring, natural or otherwise, by a harmless lactic acid or other bacterial culture.” Dahi may contain additional cane sugar. It should have same percentage of fat and solids-not-fat as the milk from which it is prepared.
Although yoghurt and dahi both are cultured or ripened dairy products still there are little differences between those. Yoghurt is prepared by using starter organisms Streptococcus thermophilus and lactobacillus bulgaricus in a proportion of 1:1, whereas dahi is prepared by using mixed culture of Streptococcus lactis, Lactobacilhus bulgaricus, Streptococcus thermophilus, Streptococcus citrophilus, Lactobacillus plantarum etc. Higher temperature (45°-50°C) and shorter (3-4h) incubation period is required for yoghurt making. On the other hand, lower temperature (37°-42°C) and long incubation period (8-15h) is required for dahi preparation. Comparatively yoghurt is softer and dahi curd is reverse of that.
(Varnam and Sutherland., 1994)
6 2.2. Classification of dahi
Types of Yoghurt:
According to FAO/WHO (1973) 1. Natural yoghurt
Clean, slightly acidic, tart flavor 2. Set yoghurt
Fairly thick, flat surface with fruit & flavoring at base 3. Flavored yoghurt
Added sugar or artificial sweetner 4. Greek yoghurt
Deliciously thick & creamy texture 5. Yoghurt made with active cultures
Non-heat treated
Retain live & active cultures 6. Fruit Bottom Yoghurt
Fruit on the bottom is found 7. Yoghurt Drink
Stirred, diluted & mixed with flavors, fruit juices 8. Frozen Yoghurt
Blend of sugars, stabilizers, emulsifiers and flavors in natural stirred yoghurt 9. Stirred Yoghurt
Fermented in bulk with the fruit or flavoring stirred in 10. Labneh
Drained of whey to form a fresh „yoghurt cheese‟
Flavored and rolled into balls Types of Dahi :
According to Indian Standard Institution (1973) 1. Plain Dahi
Normal dahi with characteristic flavor
7 2. Sweet Dahi
Have additionaly added friendly bacteria
Give added advantage to consumers 3. Sour Dahi
Dahi with 0.7% acidity 4. Probiotic Dahi
Dahi with 1% acidity
2.3. Food and nutritive value of dahi
It has been established that fermented milk products including dahi increases food and nutritive value as compared to the original milk.
Composition of whole milk dahi
The composition of dahi depends upon the type of milk used and the manufacturing conditions. The average composition of dahi from whole milk is as follows: water 85 to 88%, fat 5.00 to 8.00%, protein 3.20 to 3.40%, lactose 4.60 to 5.20%, ash 0.70 to 0.75%, lactic acid 0.50 to 1.10%, calcium 0.12 to 0.14%, and phosphorus 0.09 to 0.11% (Food Safety and Standards Regulations., 2011).
Composition of skimmed milk dahi
The composition of dahi depends upon the type of milk used and the manufacturing conditions. The average composition of dahi from skimmed milk is as follows: water 90 to 91%, fat .05 to .10%, protein 3.30 to 3.50%, lactose 4.70 to 5.30%, ash 0.50 to 1%, lactic acid 0.70 to .75%, calcium 0.12 to 0.14%, and phosphorus 0.09 to 0.11% (Food Safety and Standards Regulations., 2011).
Average Mineral and Vitamin Contents of Dahi
Dahi is more palatable due to its composition. The average mineral and vitamin contents of Dahi is as follows: Mineral matter 2.1 g, Calcium 149 mg, Phosphorus 93 mg, Vitamin A 102 i.u, Vitamin B1 49 µg, Riboflavin 157 µg, Nicotinic acid 86 µg, Biotin 23 µg, Pantothenic acid 183 µg, Folic acid 178 µg, Ascorbic acid 1.3 µg (Balasubramanian and Basu., 1985).
8 Akter et al., (2010) dahi is the curd resulting from lactic acid fermentation of milk. Dahi is the simplest way of preserving milk for human consumption in a tropical condition. The lactic acid produced during fermentation checks putrefactive changes while giving it an acid type pleasant aromatic taste, which is particularly refreshing in a hot climate.
Pazakova et al., (1999) studied on the sensorial evaluation of yoghurt produced from cow and goat milk. They reported that cow milk yoghurt is better than goat milk yoghurt.
Nergiz and Seckin., (1998) manufactured Torba yoghurt using a traditional method (a strained yoghurt produced from different groups of milk). Milk was heated to 90° C for 10 min. cooled to 45°C inoculated with 3% starter culture and incubated at 43°C to 4.7. The curd was cooled to 21°C and stored at 4°C for 12 hours.
Karthikeyan et al., (1998) evaluated in performance of 2 strains of yoghurt culture in different combinations in sweet cream buttermilk (SCBM) at various culture TS levels (9- 24%) in terms of increasing acidity, rate of synerois, of curd and sensory quality of curd.
They reported that acidity increased significantly with increase in TS content in the base mix up to 18%, the rate of synerosis of curd significantly and inversely decreased with increase in TS in SCBM was superior to that of control curd.
Salem et al., (1995) reported that the high-fat content frozen yoghurt (7 and 10%) fat had a good melting quality until 60 days of storage. The texture scores tended to be the same, or improved with increasing fat content of milk and decreased slightly after 30 day storage.
Hashimoto and Antunes., (1995) studied on the effects of heat treatment and utilization of 'ropy' lactic starters on rheological properties of milk yoghurt. They found that use of ropy lactic starters and heat treatment at 90°C for 75 min. gives a product with desirable physio- chemical characteristics and rheological properties.
Fernandez et al., (1994) recommended that culturing conditions for yoghurt preparation should be a temperature of 45°C and the addition of a starter culture at a proportion of 3- 4% v/v.
Ahmed., (1992) manufactured zabadi from fresh milk with or without addition of 5 or 10%
dried skim milk. He reported that zabadi manufactured from milk supplemented with dried
9 skim milk had lower and higher titratable acidity than that made from milk without dried skim milk. Addition of 5% dried skim milk greatly improved the quality of the zabadi produced from cow milk, while the quality of zabadi made from milk was improved when 10% dried skim milk was added.
Gabriel., (1990) manufactured of milk yoghurt. Whole or semi-skim milk is prepared by pasteurization, rapid cooling and homogenization. The starter is prepared from 2 strains of Lactobacillus and Streptococcus and a new starter is used for each batch, as it is claimed that this improves flavour. Culturing takes place for 2.5 - 4.25h at 42° - 48°C , followed by rapid cooling, stirring and then flavouring with sugar and/or natural fruit flavourings. The product is then packaged in pots and stored at 0-6°C.
Baltadjeva et al., (1989) produced typical bulgarian yoghurt with good flavour by concentrating goat milk to 16-18% TS (by ultrafiltration), pasteurizing it for 20 min at 90- 92°C and incubating it for up to 180 min at 35°-37° or 41°- 43°C with Streptococcus thermophilus and lactobacillus bulgaricus in ratios of 2:1 to 5:1 and amounts of 1.5-30%.
Nikoiov., (1960) reported from his experiments that high quality yoghurt of typical flavour could be obtained with a mixed culture (rods: streptococci ratio during coagulation, 1: up to 15).
2.4. Chemical and Microbiological quality of dahi or yoghurt
Bozanic et al., (1998) prepared yoghurt from goat milk and from cow milk. They reported that yoghurt samples prepared from milk had a softer consistency and lower viscosity than those prepared from standard cow milk; they also had a higher acidity throughout the storage period. They also reported that sensory properties of samples of milk yoghurt were rated as being inferior to those of samples prepared from cow milk.
Ghaleb et al., (1998) separated Buffalo milk and the milk fat replaced by palm oil (PO) to produce recombined milk containing 5.50% fat and 8.75% SNF, which was used to make yoghurt and reported that free cholesterol content decreased more than esterified cholesterol. Acetaldehyde content, and titratable acidity of fresh and stored PO yoghurt
10 were similar to control. Syneresis was lower in PO yoghurt Sensory scores of fresh or stored PO yoghurt were acceptable.
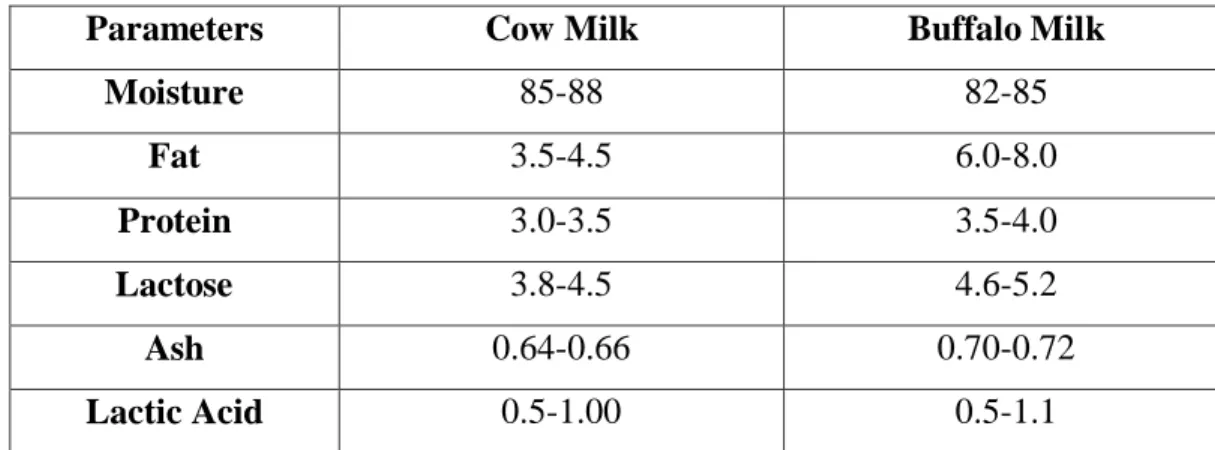
Table 1: Chemical standard of dahi
a) composition of cow milk and buffalo milk
Parameters Cow Milk Buffalo Milk
Moisture 85-88 82-85
Fat 3.5-4.5 6.0-8.0
Protein 3.0-3.5 3.5-4.0
Lactose 3.8-4.5 4.6-5.2
Ash 0.64-0.66 0.70-0.72
Lactic Acid 0.5-1.00 0.5-1.1
Source: Food Safety and Standards Regulations, 2011.
b) Composition of Whole milk and Skim yoghurt Parameters Whole Milk Yoghurt
(%)
Skim Milk Yoghurt (%)
Moisture 85-88 90-91
Fat 5-8 0.05-0.1
Protein 3.2-3.4 3.3-3.5
Lactose 4.6-5.2 4.7-5.3
Lactic acid 0.5-1.11 0.5-1.11
Ash 0.7-0.75 0.7-0.75
Source: Food Safety and Standards Regulations, 2011.
c) Nutritive value of Dahi per 100 g
Parameters Value (per 100 gm)
Energy 257 KJ
Fat 3.3 gm
Protein 3.5 gm
11
Carbohydrate 4.7 gm
Vitamin A 27 µg (3 %)
Riboflavin (vit B2) 0.14 mg (12%)
Source : Balasubramanian and Basu, 1985.
Table 2 : Microbiological standard of dahi
Parameters value ( per g)
Total viable count ≥10⁵/g
Coliform 10/g (maximum)
yeast and mold count 100/g (maximum)
Source: Indian Standard Institution, 1973.
Giudici et al., (1996) worked on the role of galactose fermenting yeast in plain yoghurt spoilage. They concluded that the presence of galactose, resulting from lactose hydrolysis by lactic acid bacteria, is the major potential cause of the changes in plain yoghurt brought about by galactose-positive, non-lactose fermenting yeasts.
Bozanic et al., (1996) prepared yoghurt samples using sterilized goat milk and sterilized cow milk and a 1:1 mixture of sterilized goat and cow milks. Yoghurt samples were the stored at 8°C for 9 days. They found that yoghurt made from the 1:1 mixture of milks tended to have the highest viscosity throughout the 9 day storage period, while cow milk yoghurt had the lowest. Goat milk yoghurt also had the lowest lactic acid content, while cow milk yoghurt had the highest. There were no significant differences between yoghurt samples with respect to sensory properties.
Jawalekar et al., (1993) prepared yoghurt form standardized cow (4% fat, 8.5% SNF) milk.
They found that buffalo yoghurt had higher viscosity and curd tension and lower syneresis score than had corresponding cow yoghurt.
Noeman and Shalabv., (1992) were used to study the effect of culturing on the chemical composition of the two products. Lactose content decreased to approximately 4.22 and 4.07 g/l00g respectively compared with 4.73g/100g in the non cultured milk. Vitamin B
12 content for both cultured products showed relatively minor changes, except for folic acid in zabady which increased.
Kehagias et al., (1992) studied on effect of on the yield and solids recovery of strained yoghurt form goat and cow milk. They found that yield and recovery of milk solids were higher at the lower range (4.3 - 4.1). Researched milk was richer than a standard milk in all constituents. However, the Intron penetration force of the yoghurt gel form experimented milk was lower compared with that from standard milk (measured just after fermentation).
The yield and the recovery of milk solids in strained yoghurt form experimented milk was higher than the yield and the recovered milk solids form standard milk.
Cardoso et al., (1991) reported that firmness of yoghurt made from buffalo whole milk (6.3% fat and 4.7% protein) was most acceptable when milk was pasteurized at 75°C for 5 min. Average chemical and microbiological composition was; 6.1, 4.68, 16.06 and 1.0 (percentage of milk fat, protein, total solid and acidity respectively) and 10 coliforms/ml.
Yoghurt could be stroed satisfactorily at 10°C for 7 days. Zabady and acidophilus milk made from buffalo semi-skim milk (3% fat).
Mehanna and Hefnawy., (1988) worked on cow, buffalo and mixed milk that had been heat treated at 90°C for 5min, and then refrigerated for 2 days, was inoculated with 2% yoghurt culture and incubated at 40°C for 4h. Rate of increase in acidity and decrease in during incubation was similar in milk form all 3 treatments. During refrigerated storage of the yoghurts for 7 days, no significant differences observed in chemical composition and organoleptic score of the yoghurt, but some differences (P<0.05) were noted in curd tension.
Salji et al., (1987) assessed the production processing and quality of dairy products in the Western Province of Saudi Arabia. They reported that microbiological analyses of fluid milks were of good microbial quality, but some contamination of yoghurt with coliforms yeasts or molds was noted. This was traced to the use of polluted water in 3 small-scale plants.
Ranganadham and Gupta., (1987) evaluated the sensory characteristics of dahi and yoghurt. They recommended that when evaluating the products, Judges should note the
13 type and condition of the container, aroma, colour and appearance, body and texture and flavour. Good quality dahi should have a creamy-white to creamy- yellow colour, a smooth, glossy appearance, a mildly acidic flavour and a weak-gel texture.
Manjunath and Abraham., (1986) used goats' milk to make yoghurt by standard methods and compared with cows' milk yoghurt and goats' milk yoghurt, showed an increased rate of lactic acid production and decreased rate of acetaldehyde production, 'otolytic activity was similar for both yoghurts. Goats' milk yoghurt had a softer body, was whiter in colour and less wheying off was observed, Members of a taste panel could not distinguish between the 2 Yoghurts (flavour and taste), and the characteristic flavour of goats' milk was masked in goats milk yoghurt which had a typical yoghurt flavour.
Jasjit et al., (1979) studied a comparative assessment of the antibacterial acitivity of pure and mixed-strain cultures of Streptococcus thermophilus and lactobacillus bulgaricus against Escherichia coli, Staphylococcus aureus, Pseudomonas fragi and Micrococcus flavus was made using cows' milk and buffaloes' milk. Antibacterial activity of yoghurt culture was greater in buffaloes' milk than in cows' milk.
Singh and Jasjit., ( 1979) prepared yoghurt from (i) cows' and (ii) buffaloes" milk using a 16-18 h old culture of Streptococcus thermophilus (Hst) and Lactobacillus bulgaricus ( W) in equal proportion. Yoghurt made from (ii) was rated' higher on the hedonic scale than the yoghurt from (I).
Duitschaever., (1978) reported that microscopic appearance of goat's milk yoghurt and of the streptococi in it was different from that of cows' -milk yoghurt. The goats' milk yoghurt was less viscous than that made from cows' milk, and when unstirred was less firm; when stirred, it showed no wheying off during subsequent storage at 4°C. Both products had similar amino acid profiles. In organoleptic tests, there were a 32% preference t‟or goats' milk yoghurt (72% when sugar and /or flavor was added).
Lusiani et al., (1974) worked on microbiological quality of yoghurt in connection with storage times and temperatures. Through a long investigation authors concluded that yoghurt has a shelf life of approx. 1 month if stored continuously at refrigeration temperature.
14 Sreenivasan and Ranganathan., (1972) observe that when market samples of dahi prepared by lactic acid fermentation, of milk are used as starters, the contaminating yeasts proliferate during daily transfer of previous days dahi and impart an off-flavor to the product after storage for 72 h.
2.5. Standards and Standardization of yoghurt or dahi
Ahmed et al., (2015) carried out an investigation on quality evaluation of stirred yoghurt flavoured with Guddaim fruit. The ingredients and fruit puree were collected from different places of Khartoum, Sudan. Yoghurt manufactured with Guddaim fruit was produced in their university laboratory. In their research, all the yoghurt samples were stored at 4ºC for 10 days and chemical, microbiological and sensory characteristics were carried out at 10-day intervals. Dilution was done maintaining a ratio of 1:10 (v/v) and used for total viable bacteria (TVB), coliform bacteria, Staphylococcusaureus and yeasts and molds counts. For coliform bacterial count Mac Conkey agar medium was used and plates were incubated at 32ºC for 48 hr (Christen et al., 1992). Also, Mannitol salt agar medium was used for Staphylococcus aureus count and the plates were incubated at 32ºC for 48 hr (Flowers et al., 1992). During their study coliform bacteria count ranged between Log 3.15 cfu/gm in the control and Log 3.69 cfu/gm in Treatment 1 (5% v/v Guddaim fruit extract), and the count showed a decrease in day 7 (Log 3.06 cfu/gm) before they increasing to the end. On the other hand, S. aureus count was found to be Log 3.70 cfu/gm in Treatment 3 (10% v/v Guddaim fruit extract) and Log 4.44 in the control. The count was increased during storage from Log 4.07 cfu/gm at day 1 to Log 4.16 cfu/gm at day 10 with a slight decrease in day 7 (Log 3.90 cfu/gm). It was suggested that the environmental contamination and heat treatment during preparation of yoghurt might be the reason for the presence of these microorganisms.
Das et al., (2015) evaluated the microbial load and the quality of the eighty-seven dairy samples collected from different locations of Dhaka city. The study considered the total viable count, total coliform count and total fungus count of the different dairy samples.
The coliform count of the yoghurt was 9.5×10³cfu/g which was undesirable according to the FDA standard. On the other hand, the mean viable count of the borhani was significantly higher than raw and UHT milk.
15 American Public Health Association (1983) set the standards for both coliforms and yeasts in yoghurt at less than 10 colonies per ml. and in only, one sample out of four.
Spanish Standard (1976) specified requirements applicable to the following types of yoghurt for the Spanish market: ordinary yoghurt (> 2% milk fat, > 8.5%S.N.F.), skim- milk yoghurt (< 0.5% milk fat, > 8.5% S.N.F.), yoghurt with fruit, juices and /or other natural products (must contain 70% yoghurt by weight). In all the fermentating organisms Streptococcus thermophilus and L. bulgaricus must be viable and abundant in the final product
Indian Standard Institution (1973) prescribed the types, requirements, method of sampling and test for fermented milk products (plain and flavoured) i.e. (i) sweet, dahi produced using a culture of streptococcus lactis, S. diacetilactis, V. diacetilactis either alone or in combination with or without Leuconostoc . spp., (ii) sour dahi, using cultures as above but with Lactobacillus bulgaricus and /or S. thermophilus, and (iii) yoghurt, produced using cultures of S. thermophilus and /or L. bulgaricus. Requirents are: maximum acidity (as lactic acid), 0.7, 1.0 and 0.8% by mass for (i), (ii) and (iii) respectively, maximum yeast and mould count 100/g, maximum coliform 10/g, and osatase test negative.
Eschmann., (1968) reported referring the swiss standards that fermented milk products in Switzerland should be negative PR (Phosphates Reaction), lactic acid bacteria should present in at least 16c' dilution and frozen bacteria not more than 50000/ml on retailing.
2.6. Diseases caused by the microbes
Milk, as well as other milk products such as butter milk, yoghurt milk, and butter can contain a large number of microbes with greater diversity and serves as a great growth medium (Ruegg P. L., 2003). Bacteria can be the causative agent of microbial spoilage of milk products. Because of low pH of most of the milk products, bacteria such as Shigella spp., Pseudomonas spp., Salmonella spp., can grow easily in them. There are other types of pathogenic bacteria present in the environment and they can cause various diseases to humans
16 Escherichia coli is a gram negative bacterium which can be found in lower intestine of warm blooded animals. A large variety of E. coli is present but most them are not infectious. They are harmless. E. coli are also opportunistic microbes. Some types of E.
coli such as E. coli 0157:H7 can create intestinal infection. Some other strains can cause bloody diarrhea, severe kidney failure which can cause death. Humans and animals can be infected by eating foods or drinking water which is already contaminated with E. coli.
Salmonella spp. are gram negative, rod-shaped (bacillus) bacterium. Salmonella enterica can cause four diverse clinical signs: bacteremia, gastroenteritis, asymptomatic carrier state and enteric fever. It is more common in youngsters less than 5 years old.
Gastroenteritis is also known as food poisoning showing the symptoms such as vomiting, sudden nausea, abdominal cramps, headache, diarrhea and high fever. In Asia non-typhoid salmonellosis is more common especially in industrialized countries. Their primary hosts are animals such as cattle, wild birds, flies as well as pets. The final hosts are human.
Humans are the only known hosts for Salmonella Typhi. Humans only get infected when they consume contaminated water and foods such as meat, milk, egg products, milk products which are contaminated with infected faeces as well as infected animals. Certain host carries the bacteria for years
Pseudomonas spp. is gram negative bacteria. Morphologically they are vibrios and enteric bacilli. They are motile bacterial species because they have peritrichous flagella.
Pseudomonas spp. is aerobes in nature and can be found widely in water, soil, skin and almost all the manmade environments. Pseudomonas aeruginosa can cause cystic fibrosis, urinary tract infection and also other external and internal of human body. Pseudomonas spp. is also opportunistic bacteria. They can remain silent inside host body but whenever they get the chance they can create worst situation. Pseudomonas spp. is predominate in raw milk and play a major part in milk spoilage (Muir et al., 1979; Griffiths et al., 1987).
Staphylococcus aureus are gram positive, non-motile, small round shaped cocci. They can be frequently found in respiratory tract, nose and skin. Pathogenic strains can cause infection by producing a cell surface toxin protein that binds with the antibodies and deactivates them. Staphylococcus aureus can spread by skin-to-skin contact, objects such as towels, cloths and other equipment that are used by the infected person. They can lay
17 dormant in host body for several years undetected. Staphylococcal scalded skin syndrome is a severe skin infection which can be seen in new born babies (Akbar and Anal., 2013).
Klebsiella is a gram negative, rod-shaped, non-motile bacterium. This species can be found everywhere in nature. Klebsiella is an opportunistic bacterium and primarily they attach those people who are immunocompromised and suffering from different disease such as diabetes. Klebsiella pneumonia is the most known pathogen among all the other species which cause human disease. Klebsiella spp. also can cause septicemia, intensive care unit infection, and urinary tract infection.
From this section of review it is clear that numerous scientists around the globe have tried to know the physical, chemical and microbiological quality of dahi or yoghurt prepared from different source of market milk under various condition. Very limited work has been conducted in our country regarding the microbiological quality particularly isolate the food-borne pathogens such as Escherichia coli and Salmonella sp and evaluate the quality of commercialized dahi.
18 Chapter - III
Materials and Methods 3.1. Study area
This experimental attempt was made to isolate the E. coli and Salmonella sp from dahi available in local market of Chattogram Metropolitan Area.
¹
Figure 3: Map of Chattogram Metropolitan showing study area 3.2. Study period
The experiment was conducted for a period of 6 months starting from July to December, 2019. Samples were collected from shops at weekly basis.
3.3. Materials
3.3.1. Media: Bacteriological parameters (Salmonella and E. coli) were determined by the methods as described in the "Standard Methods for Examination of Dairy Products" by APHA (1983). Xylose lysine deoxycholate agar and Mac conkey agar, Eosin methylene blue agar were used for Salmonella and E. coli count respectively. Buffered peptone water was used as pre-enrichment medium for the growth of bacteria. Plate count agar was used for evaluate the total viable bacteria count by using colony counter.
19 3.3.2. Chemical Analysis: Different specific biochemical media were prepared for different biochemical tests. Acidity and protein percentage was determined by titrating with 0.1 N sodium hydroxide solution and by Kjeldahl method respectively by using the procedure of Aggarwala & Sharma (1961). Fat percentage was determined by Gerber method.
3.4. Flowchart of the study design
Around 100-200 gm of 50 dahi sample were collected by using icebox Serial dilution was done upto 104
Spread plate technique applied
Count discrete bacterial colonies by using colony counter (cfu/gm)
inoculate isolates in selective agar medium like Mac conkey, EMB , XLD and incubated at 37 ̊c for 24 hours
Identification of the selected isolates
Morphological Characterization Biochemical Characterization Source: Standard Methods for examination of Dairy products by APHA, 1983.
3.5. Methods
3.5.1. Collection of dahi
A total of fifty (50) dahi samples (local and branded) were collected randomly from different sweetmeat shops and retail shop of the local markets under stringent hygienic conditions. Among them, three popular branded dahi such as Banoful, Fulkoli, Genuine were collected from market. Samples were brought to experimental site with the help of a icebox, maintaining the temperature 4-5°C. The samples size ranged from 100-200g packet in small size plastic pots. After collection, samples were stored in refrigerator at 4°C until analysis.
20 Figure 4: Local and Branded dahi sample
Figure 5: Collection of dahi sample 3.5.2. Chemical analyses (Dahi)
The following parameters were determined in the laboratory:
Acidity content (%)
Fat content (%)
Protein content (%)
Determination of Acidity percentage
Nine gram of sample was taken in a conical flask and 9 ml of distilled water was added to the sample and was mixed thoroughly with the help of a glass stirrer. 3-4 drops of phenolphthalein indicator was added to the sample. 0.1 N NaOH solution was taken in the
a) Local dahi b) Branded dahi
21 burette and was added drop by drop to the sample and stirred until a pink color was persisted for a short time. Finally the ml of NaOH required was noted and the calculation was made using the following formula:
Percentage of acidity = (ml of NaOH x 0.09 x strength of NaOH/ Weight of dahi) x 100 Where 0.09 is the gram of lactic acid equivalent to each ml of normal strength of NaOH.
17.6 ml dahi is equivalent to 18 grams of milk and 0.1 was the normality of NaOH used.
Determination of Fat percentage
17.5 ml of diluted sulfuric acid was added into the butyrometer. Nine gram of well mixed dahi sample was weighed and was taken into a butyrometer with the help of 9 ml pipette 9 ml of soft water was added with it and mixed thoroughly. Then 3 ml of normal amyl alcohol was added and mixed for at least 1 minute. After that, the opening was closed by the lock stopper and shaken well until the disappearance of white particle. The butyrometer with the sample was centrifuged for 5 minutes in a Gerber‟s centrifuge machine. Holding the butyrometer in vertical position and reading of fat column was recorded.
Determination of crude protein of Dahi sample
The determination of CP actually involves the determination of nitrogen content of the sample, which is multiplied by the factor 6.38.
Therefore, %CP= % N x 6.38
% of Nitrogen = (ml of 0.1N HCI solution used for titration x Normality of the acid x ml equivalent weight of Nitrogen/ Weight of the sample) x l00
Two grams of dahi samples whose dry matter percentage was known, transferred in a kjeldahl flask. One gram of mixed catalyzer was added to the flask. Then 20 ml of commercial concentrated sulphuric acid was poured gradually into the sample in the kjeldahl flask. The flask was kept in the digestion chamber in inclined position and was heated gently until frothing ceases. Boiling was continued (briskly boiling) for 30 minutes until the solution becomes clear. After digestion, the digested solution was cooled by air and 100 ml of distilled water was added to the digested sample. Some zinc granules were
22 added to prevent bumping. The digested solution was then neutralized by gradual adding of 80 ml of 40% NaOH solution without agitation. The flask was immediately connected to digest bulb on condenser and then tip of condenser was immersed in an Ehrlenmeyer flask containing 20 ml of 2% boric acid solution. The flask was rotated to mix the content thoroughly and was heated until all ammonia was distilled. The distillated sample was titrated with standard HC1 solution (0.1 N) using mixed indicator (Methyl blue+methyl red) and the percent of nitrogen was calculated.
3.5.3. Bacteriological analysis Serial dilution
Test tubes containing 9 ml of physiological (0.9% NaCl) saline water were autoclaved before use. Tenfold serial dilution of the dahi samples were prepared in autoclaved saline water. Initially, 1 gm of dahi was mixed with 9 ml of saline water in a test tube in order to dilution 10-¹ and mixed with 9 ml of saline in it by repeated pipetting in order to make tenfold dilution. Again, 1 ml from the 10-¹ test tube was transferred to 10-² labeled test tube and mixed with 9 ml saline solution in it by repeated pipetting. This action was repeated for the test tubes labeled as 10-³, and 10-⁴.
Spread plate technique
After finishing serial dilution, four plate count agar plates were labeled as 10¹, 10², 10³ and 10⁴. From each of the diluted sample test tubes 0.02 ml of sample from the test tubes labeled 10¹, 10², 10³ and 10⁴ were added on the respective plates and the drops were spread using spread plate technique with a spreader. All plates were then incubated at 37◦C for 24- 48 hours. After incubation, the plates having colonies were counted and noted down.
Morphological characterizations of bacteria
Buffered peptone water , Mac conkey, EMB , XLD agar were prepared and autoclaved at 121◦C, 15 psi and cooled at water bath to 45-50◦C . This buffered peptone water was used as enrichment media for Escherichia coli and Salmonella sp. The media was then dispensed into sterile petridish while liquid and left for solidifying. Using sterile technique,
23 Mac conkey, EMB, Xld agar plate were streaked by picking a loop full of colony culture with an inoculating loop by means of three quadrant streak plate method to obtain isolated discrete colonies. The plates were then incubated at 37◦C for 24 hours. After the incubation period the growth patterns of the bacteria were evaluated for size, pigmentation, form, margin, elevation and texture (Cappuccino and Sherman, 2005).
Figure 6: Agar media preparation 3.5.4 Biochemical characterization of the bacteria
Several biochemical tests were carried out in order to have a presumptive identification of the potential bacteria chosen before. Most of the methods were done according to the microbiology laboratory manual (Cappuccino and Sherman., 2005). The biochemical tests performed were Indole production test, Citrate utilization test and Urease test,
Citrate utilization test
Citrate utilization test was done to differentiate among enteric organisms on the basis of their ability to ferment citrate as a sole source of carbon by the enzyme citrate permease.
Simmons citrate agar slants of 2 ml in each vials were prepared by autoclaving at 15 psi 121◦C. Using sterile technique, small amount of the experimental bacteria from 24-hours old pure culture was inoculated into the vials by means of a streak inoculation method with an inoculating needle and the vials were incubated for 48 hours at 37◦C (Cappuccino and Sherman., 2005). Growth of organism and change of color from green to blue in positive sample and no color change obtain in negative sample (Figure 7). Bacteria which give
24 positive results for the citrate test include Salmonella, Enterobacter sp etc. E. coli, Shigella sp show negative result.
Indole Production test
Indole production test was done to determine the ability of the bacteria to degrade the amino acid tryptophan by the enzyme tryptophanase. Tryptophan broth of 5 ml in each test tube was prepared by autoclaving at 15 psi 121◦C. Using sterile technique, small amount of the experimental bacteria from 24 hours old pure culture was inoculated into the tubes by means of a loop inoculation method with an inoculating loop and the tubes were incubated for 48 hours at 37◦C. In order to test for indole production, 5 drops of Kovac„s reagent was added directly into the tubes (Cappuccino and Sherman., 2005). Cherry red ring form in the upper layer in case positive sample and no ring form in the upper layer in negative sample (Figure7). Bacteria which give positive results for the citrate test include E.coli, Proteus sp etc. and Salmonella, Klebsiella sp show negative result.
Urease test
Urease test was done to simultaneously determine the ability of the bacteria to hydrolized urea by means of the enzyme urease. Urease media was prepared by autoclaving at 15 psi 121◦C. The media was cooled to about 50-55◦C and 100ml of urea glucose solution was added aseptically to 900 ml base medium. After that, 6ml solution was transferred to each sterile test tube and allowed to form a semi solid medium. Using sterile technique, small amount of the experimental bacteria from 24 hours old pure culture was inoculated into the tubes by means of a stab inoculation method with an inoculating needle and the tubes were then incubated for 24 hours at 37◦C (Cappuccino and Sherman., 2005). In positive sample magenta to pink color change obtained in media and no color change found in negative sample (Figure 7). Bacteria which give positive results for the citrate test include Bacillus, Proteus sp etc. E. coli and Salmonella sp show negative result.
25 a) Absence of growth and no color change obtain in slant
b) Absence of pink to red color ring (cherry ring) in the upper layer
c) Development of bright pink color colonies
Figure 7 : Results of biochemical tests ; a) Citrate test; b) Indole production test;
c) Urease test
26 3.6. Statistical analysis
The data obtained were imported, stored and coded according to recorded information in the data sheet using the Microsoft Excel – 2007 program for statistical analysis. A descriptive statistics was performed for chemical and microbial parameters according to different samples. The result was presented as mean with the standard error and p-value
<0.05 was considered significant.
27 Chapter – IV
Results 4.1 Chemical analysis
The results of chemical analyses (Acidity, fat and protein percentage) of local and branded dahi samples (n=50) from study areas are shown in Table 3.
4.1.2. Fat
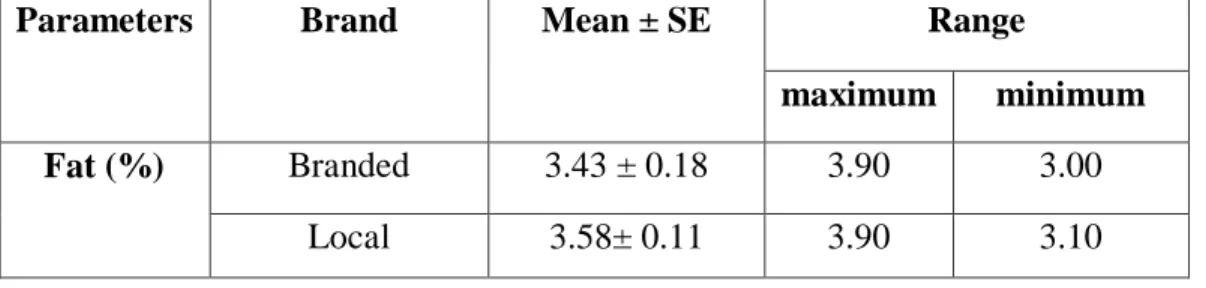
The average percentage of fat of branded Sweetmeat shops and retail shops made dahi were 3.43 ± 0.18 and 3.58 ± 0.11 respectively (Table 3). Statistical analysis showed that fat content of different dahi samples differ significantly (p<0.05). Maximum fat percentage was seen in local dahi (3.58 ± 0.11) and minimum fat percent was seen in branded dahi.
Among the collected branded dahi samples minimum fat percentage obtained in banoful dahi (3.43 ± 0.18) and maximum fat percentage obtained in Genuine dahi (3.57±0.11) (Table 4).
4.1.3. Acidity
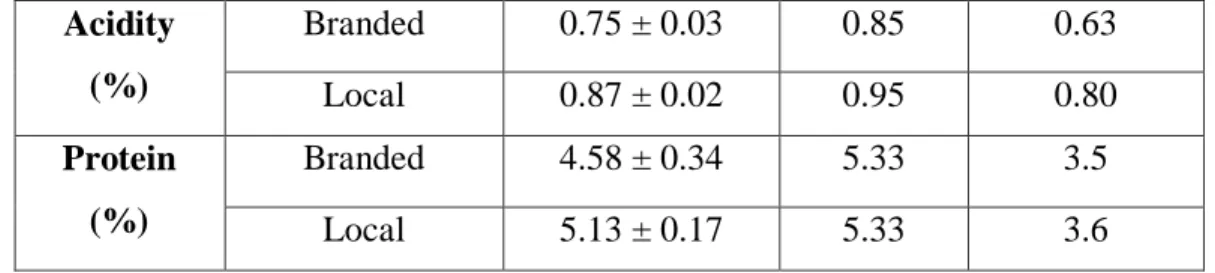
Acidity percentage for dahi samples of branded and local were 0.87 ± 0.02 and 0.75 ± 0.03 respectively (Table 3). Significant differences were found (p<0.05) in respect of acidity content of the samples. The highest acidity was that of local dahi at 0.87 ± 0.02 and the lowest acidity was that of Banoful dahi at 0.75 ± 0.03. On the other hand, highest acidity percentage (3.57± 0.11) obtained in Fulkoli dahi (Table 4) among the collected branded dahi samples .
Table 3: Chemical analysis of local and branded dahi collected from Chattogram Metropolitan Area
Parameters Brand Mean ± SE Range
maximum minimum
Fat (%) Branded 3.43 ± 0.18 3.90 3.00
Local 3.58± 0.11 3.90 3.10
28 Acidity
(%)
Branded 0.75 ± 0.03 0.85 0.63
Local 0.87 ± 0.02 0.95 0.80
Protein (%)
Branded 4.58 ± 0.34 5.33 3.5
Local 5.13 ± 0.17 5.33 3.6
Table 4: Chemical analysis of branded dahi collected from Chattogram Metropolitan Area
Parameters Brand Mean ± SE Range
maximum minimum
Fat (%) Bonoful 3.43 ± 0.18 3.90 3.00
Fulkoli 3.55 ± 0.20 4.10 2.90
Genuine 3.57± 0.11 3.80 3.10
Acidity (%)
Bonoful 0.75 ± 0.03 0.85 0.63
Fulkoli 0.83 ± .02 0.92 0.78
Genuine 0.77± .06 0. 87 0. 66
Protein(%) Bonoful 4.58 ± 0.34 5.33 3.50
Fulkoli 4.0 ± 0.36 5.00 3.00
Genuine 5.13 ± 0.17 5.33 3.60
4.1.4. Protein Percentage
The average percentage of protein of branded dahi and local dahi were 4.58 ± 0.34 and 5.13 ± 0.17 respectively (Table 3). Statistical analyses showed that there were significant dilference (P<0.05) within the protein content of different groups of dahi.
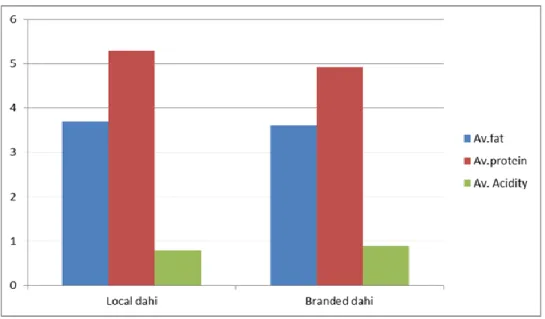
29 Figure 8: Fat , protein and acidity percentage of dahi
4.2. Microbial count
4.2.1. Total Viable Count (TVC)
The TVC is the number of bacteria in a sample that can grow and form countable colonies on standard plate count agar after being held at 37°C for 24 hours. Statistical analysis showed no significant difference (p>0.05) among the total viable counts of the Dahi samples from the collected areas. The highest total viable bacterial count 3x10⁵ cfu/gm was found in branded dahi and lowest total bacterial count was 1.2x10⁵ cfu/gm, which had been collected in local area (Table 5). The results of the total viable count of all samples was within the standard level (≥10⁵).
Table 5: Total bacterial count of collected dahi sample marketed in Chattogram Metropolitan Area
Samples no. Sample Total viable count cfu/gm
E. coli count Salmonella count
1 Banoful 2.8 x 10⁴ Nil Nil
30
2 Fulkoli 4.5 x 10³ Nil Nil
3 Genuine 3.0 x 10⁵ Nil Nil
4 Local 5.0 x 10² Nil Nil
5 Local 6.8 x 10⁴ Nil Nil
6 Local 5.0 x 10² Nil Nil
7 Local 2.1 x 10⁵ Nil Nil
8 Local 4.1 x 10² Nil Nil
9 Local 5.5 x 10³ Nil Nil
10 Local 1.1 x 10⁴ Nil Nil
11 Local 4.4 x 10³ Nil Nil
12 Local 5.1 x 10³ Nil Nil
13 Local 1.8 x10⁴ Nil Nil
14 Local 1.6 x 10⁵ Nil Nil
15 Local 3.2 x 10⁴ Nil Nil
16 Local 6.2 x 10² Nil Nil
17 Local 4.5 x 10³ Nil Nil
18 Local 2.3 x 10⁴ Nil Nil
19 Local 2.0 x 10³ Nil Nil
20 Local 1.2 x 10⁵ Nil Nil
21 Local 2.3 x 10² Nil Nil
22 Local 2.9 x 10⁵ Nil Nil
23 Local 1.8 x 10² Nil Nil
24 Local 3.6 x 10³ Nil Nil
25 Local 6.4 x 10⁴ Nil Nil
26 Local 4.3 x 10³ Nil Nil
31
27 Local 1.1 x 10³ Nil Nil
28 Local 2.0 x 10⁴ Nil Nil
29 Local 5.2 x 10⁵ Nil Nil
30 Local 2.1 x 10² Nil Nil
31 Local 6.2 x 10² Nil Nil
32 Local 5.5 x 10³ Nil Nil
33 Local 3.7 x 10² Nil Nil
34 Local 2.5 x 10⁴ Nil Nil
35 Local 3.1 x 10² Nil Nil
36 Local 9.0 x 10³ Nil Nil
37 Local 8.6 x 10⁴ Nil Nil
38 Local 1.9 x 10⁵ Nil Nil
39 Local 1.5 x 10³ Nil Nil
40 Local 2.36 x 10² Nil Nil
41 Local 2.4 x 10⁵ Nil Nil
42 Local 1.8 x 10⁴ Nil Nil
43 Local 4.0 x 10² Nil Nil
44 Local 7.3 x 10³ Nil Nil
45 Local 3.2 x 10⁴ Nil Nil
46 Local 2.6 x 10⁵ Nil Nil
47 Local 1.8 x 10³ Nil Nil
48 Local 1.04 x 10⁴ Nil Nil
49 Local 5.2 x 10² Nil Nil
50 Local 3.9 x 10³ Nil Nil
32 The table 5 showed the total viable count of marketed dahi which is range from 1.2x10⁵ to 3x10⁵ cfu/gm. On the other hand, E. coli and Salmonella sp count were nil.
Figure 9: Total viable bacterial count under colony counter 4.2.2. E. coli and Salmonella sp count
The presence of E. coli and Salmonella sp in dahi samples indicate the contamination of dahi during their production and handling which may cause public health problems. In this study no bacterial growth obtained in selective media like Mac conkey, EMB for E. coli and XLD for salmonella sp. Pink color colonies ; Greenish metallic sheen and black centered red colonies were absent in A) Mac conkey, B) EMB and C) XLD agar respectively. The data for E. coli and Salmonella sp count has not statistically tested as because all samples possess nil count (Table 5).
A B
33 Figure 10: Absence of microbial growth in selective media
4.3. Biochemical Characteristics of bacterial isolates of different samples
Suspected microorganisms were collected from the different samples. The selection of the microbes was done from different culture media according to their growth, morphology and visual form. Then the microorganisms were compared with the suspected one and selected one was then sub-cultured for biochemical tests. To obtain more specific and desired result different types of selective growth media were used to isolate specific microorganisms. All the biochemical tests were described with details in chapter III. The test results of the selected microorganisms are noted down with a chart (Table 6). During the study after all the biochemical tests have been done it was found that E. coli and salmonella sp was absent in all collected samples.
Table 6 : Biochemical characteristics of sample in different biochemical test Samples no. Sample Citrate
reaction
Indole reaction
Urease reaction
Organism interpretation
(E.coli/
Salmonella)
1 Banoful − − − absent
2 Fulkoli − − + absent
3 Genuine + + + absent
4 Local + − + absent
C
34
5 Local + + + absent
6 Local − − + absent
7 Local + + + absent
8 Local + + + absent
9 Local − − − absent
10 Local − − + absent
11 Local + + + absent
12 Local − − + absent
13 Local + + + absent
14 Local − − − absent
15 Local − − + absent
16 Local + + + absent
17 Local − − + absent
18 Local + + + absent
19 Local − − − absent
20 Local + + + absent
21 Local − − + absent
22 Local + + + absent
23 Local − − − absent
24 Local + + + absent
25 Local − − − absent
26 Local + + + absent
27 Local + + + absent
28 Local − − + absent
29 Local + + + absent
30 Local + + + absent
31 Local − − − absent
32 Local − − + absent
33 Local + + + absent
34 Local − − + absent



![The effects of five week aerobic interval training on the body composition of pencak silat elite athletes / Johansyah Lubis … [et al.]](data:image/gif;base64,R0lGODlhAQABAIAAAP///wAAACH5BAEAAAAALAAAAAABAAEAAAICRAEAOw==)