Level of Food Insecurity and Poverty in Bangladesh:
An Agro-economic, Social and Vulnerability Analysis
Shantana R. Halder Senior Research Fellow Research & Evaluation Division
BRAC
23 December 2003
Bangladesh FIVIMS Baseline Report: Agro- and Socio-economics 2 Abbreviations
BARI Bangladesh Agricultural Research Institute BBS Bangladesh Bureau of Statistics
BDHS Bangladesh Demographic and Health Survey BIDS Bangladesh Institute of Development Studies BRRI Bangladesh Rice Research Institute
BMD Bangladesh Meteorological Department CAMPE Campaign for Popular Education
CELS Child Education and Literacy Survey
CPEIMU Compulsory Primary Education Implementation Monitoring Unit CNS Child Nutrition Survey
CPI Consumer Price Index
DAE Department of Agriculture Extension DAM Department of Agricultural Marketing DMB Disaster Management Bureau DCI Direct calorie intake
EFA Education for All
FAO Food and Agricultural Organization FFW Food for Work
FIVIMS Food Insecurity and Vulnerability Information and Mapping Systems FPMU Food Production Monitoring Unit
GR Gratuitous Relief
GOB Government of Bangladesh HES Household Expenditure Survey
HIES Household Income and Expenditure Survey HKI Helen Keller International
HPI Human Poverty Index
IFPRI International Food Policy Research Institute IMS Integrated Multipurpose Sample
INFS Nutrition and Food Science IPI Income Poverty Index
IPRSP Interim Poverty Reduction Strategy Paper LGED Local Government Engineering Department LLP Low Lift Pump
MDG Millennium Development Goal MICS Multiple Indicators Cluster Survey NGO Non Governmental Organization NSP Nutritional Surveillance Project TFR Total Fertility Rate
TR Test Relief
UNICEF United Nations International Children Emergency Fund UNDP United Nations Development Programme
VGD Vulnerable Group Development VGF Vulnerable Group Feeding
Bangladesh FIVIMS Baseline Report: Agro- and Socio-economics 3 List of Tables and Figures
Tables
1. List of Indicators used in the Baseline report for Assessment of Food Insecurity and Vulnerability Status in Bangladesh
2. Contents of Education Watch reports 3. Land utilization statistics
4. Cropping area utilization under different crops (%)
5. Average monthly rainfall (cm) over the last 13 years (1990-2002)
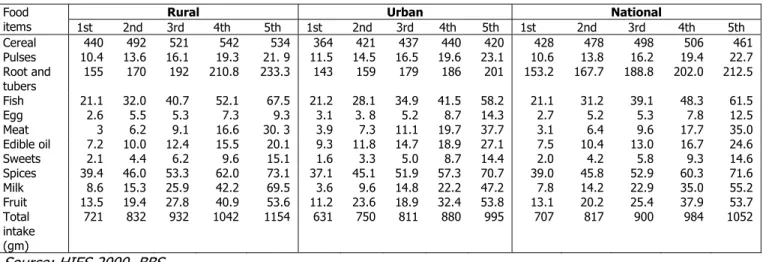
6. Production, availability of selected food items s in Bangladesh, 1991-2000 7. Differences between production and actual consumption of selected food items 8. Trend and pattern of national average food intake in Bangladesh (1962-2000) 9. Per capita per day consumption of different food items in 2000 by expenditure
quintile (gm/capita/day)
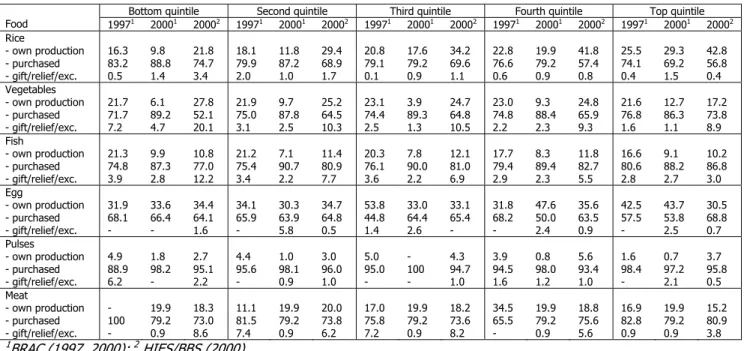
10. Source of food consumed in rural households by economic status, 1997 and 2000.
12. Poverty incidence estimates in Bangladesh 1973/74 – 2000 (using upper poverty line and based on cost of basic needs method)
13. Population below poverty line
14. Percentage share of population below poverty line by size of owned land in rural area.
15. Estimation of poverty by using CBN method: Variations in results 16. Share of food expenditure by major food item.
17. Percentage share of income of households by decile group.
18. Changes in income and expenditure of the rural households in the nineties by owned land size
19. Percentage share of income of rural household by source of income.
20. Average price of basic food items
21. Consumer price index (CPI) (Base: 1985-86=100)
22. Distribution of relief to the flood victims trough targeted food programmes (rice and wheat in MT)
23. Distribution of relief through Targeted Food Programmes
Bangladesh FIVIMS Baseline Report: Agro- and Socio-economics 4 Figures
1. Growth in population density by division (1901-2001) 2. Changes in land ownership
3. Divisional distribution of households by farm holding 4. District-wise cropping intensity and irrigation
5 Irrigation area under different crops 6 Area Under different methods of irrigation
7 Foodgrain production, requirement and availability
8. Source of rice and pulse consumed in rural houseolds according to per capita expenditure quintile, 1997 (BRAC, unpublished).
9. Distribution of rural landless households by no egg consumption and egg consumption from own production or purchase from market in year 2000 (NSP, HKI, 2002)
10. Poverty incidence across division
11. Poverty estimates according to different methods 12. Household expenditure share
13. Household expenditure share by expenditure quintile 14. CPI of rural population by division (1973-74=100)
15. Monthly variations in average wholesale price of coarse rice in Bangladesh 16. Trends in literacy rates (7+ yrs )
17. Literacy rate among 7+ years of age group by division 18. Literacy rate of pop. 7+ yrs of age by religion (Pop. Census)
19. Trends in adult literacy by rural and urban (Pop. Census 2001, BBS) 20. National adult literacy rates calculated by different agencies
21. Net enrollment rates (6-10 years of age) 22. Rural primary school NER
23. Gender variations in primary enrollment by poverty groups (6-10 yrs age group) 24. Geographical variations in primary enrollment by poverty groups (6-10 yrs age
group)
25. Access to electricity by division 26. Road length per sq. km territory (km) 27. Historical Flood Extents in Bangladesh Chart
1. Indicators suggested in FIVIMS guidelines Annexes
1. Differential cropping intensity in Bangladesh 2002-2003 2. Foodgrain production and availability (1969/70-2002/03) 3. Agroecologically constrained area – Bangladesh
4. 1998 flood extent
5. Effect of flood 1998 and Govt. relief allocation by district
Bangladesh FIVIMS Baseline Report: Agro- and Socio-economics 5 Table of Contents
I. Introduction II. Methodology
1. Selection of Indicators for baseline 2. Sources of data and information 3. Limitations
III. Basic Information about Bangladesh Demography
Distribution of rural households with land ownership IV. The Land Use
Use of Agricultural Land
Irrigation as one the factors of production
V. Food Production and Net Production Availability VI. Food production and The Balanced Diet
Net food availability and food intake VII. Food Intake
Source of Food Consumed in the Household VIII. Trends in poverty
Trends in poverty: results of the income measure
Trends in poverty: results of the direct calorie intake (DCI) measure
Incidence of poverty: variations in the results of different poverty estimates IX. Food and non-food consumption expenditure
X. Household income
XI. Food price and food insecurity Price of coarse rice
XII. Education Data source The indicators Literacy Adult Literacy
Primary School Enrolment XIII. Access to infrastructure
Access to electricity
Access to road communication
Bangladesh FIVIMS Baseline Report: Agro- and Socio-economics 6 XIV. Risks and shocks
Flood
The effect of 1998 flood on the lives of the poor and most vulnerable: the BRAC studies
Water, sanitation and health
Coping with the flood 1998: The lessons learned The effect of Flood: results of IFPRI studies
Effect on food consumption Impact on labour market Distribution of relief
Role of Government in Relief Operations for the Poor Coping with seasonality: the usual and current practices XV. Identification of the extreme poor and most vulnerable
Characteristics of the ultra poor and most vulnerable How to identify the extreme poor
XVI. Discussion and Conclusion References
Annexes
Bangladesh FIVIMS Baseline Report: Agro- and Socio-economics 7 Abstract
A large number of organizations are generating a great deal of information on the problems of food insecurity and poverty and sometimes there is duplication of efforts because of low level of exchange in information sharing. Sometimes this creates confusion by providing contradictory results. Data generation is also an expensive task and any duplication of efforts is a misuse of resources which could be used for other priority purposes. This report is the output of a methodological exercise being undertaken on how to compile available macro, meso and micro level information generated by various agencies and to relate those with the issue of food insecurity and poverty. The major areas covered here include: food production, factors of production, food availability, food accessibility, food intake, sources of food consumed, income and expenditure, poverty, food price, education, risks and shocks. It also gives the socio-economic characteristics of the highly food insecure population and some indication on how to identify the most insecure population.
Bangladesh FIVIMS Baseline Report: Agro- and Socio-economics 8 Executive Summary
Food security is about food availability, food accessibility and the ability to utilize the consumed food by the body system. This report is the output of a methodological exercise being undertaken on how to compile available macro, meso and micro level information generated by various agencies and to relate those with the issue of food insecurity and poverty. This report consists of XVI sub-sections. Section I gives an overview of the concept of food insecurity and vulnerability. Section II describes the methodology used for preparation of this report and gives a brief description of the data sources used for assessing the current agro-economic and social vulnerability, health and nutrition situation in Bangladesh. Some very basic information about Bangladesh including its territory, population, demography and land endowment are described in Section III while section IV emphasizes much more on some of the factors of food production like cropping intensity, use of agricultural land and irrigation. Food production, food availability and differences between food availability and the balanced diet are the issues covered in sections V and VI. Section VII covers food and nutrient intake. Issues related to poverty measurement, poverty incidence and trends in poverty are being discussed in section VIII. Expenditure, income and food price – the variables being used for measuring food accessibility are covered in sections IX-XI. Section XII describes the literacy situation in the country, section XIII focuses on access to electricity and road communication. Flood is one of the major crises the people of Bangladesh, especially the poor, have to cope with on a regular basis and section XIV provides a detail information on the 1998 flood. Identification of the poor and most vulnerable is an issue of concern to avoid leakage; section XV describes a micro study which gives a detail description on their socio-economic characteristics and suggests a methodology for identification of the extreme poor. Section XVI concludes with some suggestions and recommendations.
Bangladesh is a country with scarce resources and its major challenge is to feed its huge number of population. The food production data of BBS indicate that the country made remarkable progress in food production, especially rice, both in absolute amount and in per capita terms during the decade of 90s. In 1999/00 a total of 25 mmt of food grains (rice and wheat) were produced, more than the requirement of its total population as a whole. Vegetable production almost doubled during the decade. The year of 1999-00 experienced a milestone in potato production from 1240 thousand tons to 2951 thousand tons (a 2.5-fold increase), resulting in increase in per capita availability from the ever stagnating value of 30-37 g/day to 64 g/day. Along with cereal and vegetables visible achievements were also observed in the poultry and livestock sector. The 1990s was a decade of sustained increase in all kinds of animal products – fish, meat, egg and milk.
The per capita availability of fish increased from 20 g/day in 1991 to 34 g/day in 1999/00 which was essentially due to increase in inland fishery. Meat production increased, superceding the rate of increase in population, so the per capita availability increased to a value of 13 g/day in 2000 from 8 g/day in 1991. Egg and milk registered similar increasing pattern, but the availability of egg remained appallingly low (4 g/day). All together, at the decade end the per capita availability of total animal food was 86 g/day, still much less than the required amount (126 g/day).
Bangladesh FIVIMS Baseline Report: Agro- and Socio-economics 9 In contrast to above positive changes total production of pulses (one of the major sources of protein), oilseeds and fruits went down during the decades. These items may be described as “casualties” of the revolution in cereal production, mainly rice.
A comparison was made between per capita availability and the recommended bundle for balanced diet indicate that although the country broadly reached its self sufficiency level in cereal production but still is deficient in production of all other necessary food items to make the diet a balanced one.
HES/HIES of BBS and INFS of Dhaka University are the two major sources of food intake data. However, large differences exist between these two organizations in total food and calorie intake, presumably due to differences in methodology of data collection and data analysis. For example, while INFS data of national nutrition survey of 1995/96 shows a per capita daily food intake of 728 g/capita/day and calorie intake of 1868 kcal/capita/day, HES 1995/96 of BBS shows a food intake of 914 g/capita/day and calorie intake of 2254 kcal/capita/day. Because these figures are important for policy making at the national level, such large differences should be resolved through FIVIMS exercise.
Poverty is the major cause of food insecurity. However, different measures (income, expenditure and calorie intake) provide different figures regarding its incidence. HES/HIES of BBS is the main database being used for national poverty measurement that can be disaggregated up to 5 divisional levels. Except this there is no other wider disaggregated level database allowing measurement of poverty at the district or upazila level. According to all measures being applied for its measurement, Bangladesh made notable progress in poverty reduction, but a large number of country’s population are still below the poverty line income or below the range of food intake prescribed for maintaining a healthy life.
Among different geographical divisions Rajshahi was at the top of the line and Barisal at the bottom.
The poorest people (bottom quintile) spent more on food, mainly for cereal although aggregate expenditure for cereal in the 90s declined and that for non-cereal increased, due mainly to changes in price of different food items. The income inequality, which was higher in urban areas, increased at the same rate in the 90s both in rural and urban areas.
In 1995/96 the share of income of the bottom 20% of the population was only 5.71% and in the year 2000 their share declined to 4.97%. On the other hand contribution of the income of the richest (top 20%) increased from 50.8% to 55.02% during this period.
For educational attainment as part of social and human resources development, the report includes literacy for 7+ years of age group and the adults and net enrollment in primary school –indicators on which published data are available for at least up to divisional levels.
Here, a total of 4 different surveys of four different organizations were used. Because of differences in definitions of literacy being applied, different sources gave different figures on literacy rate – both national and adult. The definition of enrollment was almost uniform for all the organizations and all these sources show high aggregate level of enrollment rates among the primary school going aged children in both rural and urban areas.
Although there were variations in findings among the sources, all the surveys came up with practically no gender difference in enrollment.
Bangladesh FIVIMS Baseline Report: Agro- and Socio-economics 10 Flood is a major crisis the country has to face almost every year and the poor suffer most in disasters like flood. The BRAC “1998 Flood” study provides a very good insight on what are the mechanisms the poor use to cope with any such crisis. The IFPRI also made studies on flood and their results were in line with the findings of BRAC study. Flood severely affects the food habit of the poor both in quantity and quality. The poor who usually do not have stock in their house but can manage to get an alternative source of income, cut down their meals from 3 to at best 2. Lack of dry place and also fuel are the main constraints for preparation of food on a regular basis. Consumption of green vegetables decline substantially due to the inundation of vegetable plots. The diet of the slum dwellers who usually have no stock and who are used to buy food on a daily basis from the market suffer most from the flood.
About a quarter of the population in Bangladesh are considered to be extreme poor. The macro studies do not directly provide any information regarding their characteristics and also the reasons of their falling into extreme poverty. The BRAC micro study indicates that the extreme poor are those who have negligible assets beyond their home they live in, own no more than 10 decimals of land including their homestead and one-third of them are the de facto female headed households without any adult male income earner in their family. It also includes households where the main male income earner is physically handicapped not able to go for regular work. More than 80% of them could not afford to consume more than two meals a day and a significant proportion of them had to send their school going children to sell their labour for survival.
The major causes of their poverty are poverty inheritance, land redistribution due to family break-up, loss of income earner, natural calamities (including flood, river erosion), morbidity and dowry payment.
Bangladesh FIVIMS Baseline Report: Agro- and Socio-economics 11 I. Introduction
As per Millennium Development Goals (MDG) Bangladesh by the year 2015 has to 1) eradicate hunger, chronic food insecurity, and extreme destitution; 2) reduce poverty by 50%; 3) attain universal primary education for all of primary school age children; 4) eliminate gender disparity in primary and secondary school education; 5) reduce infant and under five mortality rates by 65% and eliminate gender disparity in child mortality; 6) reduce the proportion of malnourished under five children by 50% and eliminate gender disparity in child malnutrition; 7) reduce maternal mortality rate by 50%; 8) ensure access to reproductive health services to all; 9) reduce substantially, if not totally, social violence against women and children and finally 10) ensure disaster management and prevent environmental degradation for overcoming the persistence of deprivation.
Food security refers to physical and social access by all people at all times to enough food for a healthy productive life (FAO, 2000). Conversely, food insecurity exists when people lack transiently or persistently, access to sufficient quantities of safe and nutritious food required for normal growth and development, and for an active and healthy life.
The essential elements of the concept of food security are availability of food, ability to acquire it from the market and the ability to utilize the consumed food in the body system.
The supply or availability of food on an aggregate basis is important but not enough for food security, given the high inequality in the distribution of income. Availability of food at the national or community level does not ensure its equitable access to all. At the household level, an individual can obtain food from different sources: from own production, purchasing from the market, acquiring through food-for-work programmes or payment-in-food at firm level, receiving through feeding programme or getting as a subsidy. Acquisition of food from the market is mainly determined by the household economic status. Utilization of the nutrients available from the consumed food depends on infection-free health situation.
Accurate and timely information on the incidence, nature and causes of chronic food insecurity and vulnerability is crucial. National policy makers need it as part of their efforts to formulate and implement policies and programmes to reach the above MDG goals.
Information about food insecure and vulnerable people is lacking in many countries.
II. Methodology
Indicators for Assessing Food Insecurity and Vulnerability
A large number of natural as well as man-made factors obstruct the supply of adequate diet to all. Selection of a particular indicator is country-specific and depends on availability of information, reliability, compatibility and authenticity of sources and also the level of its disaggregation. Table 1 presents the list of indicators considered in this report for assessing food insecurity and vulnerability at the macro, meso and micro levels and for which some published data are available and which can be disaggregated at least up to rural and urban divisional levels.
Bangladesh FIVIMS Baseline Report: Agro- and Socio-economics 12 Table 1. List of Indicators used in the Baseline report for Assessment of Food Insecurity
and Vulnerability Status in Bangladesh
A. Food Production and Food Availability D. Socio-economic Indicators
Land use (under crop, non-crop, forest etc.) Literacy (7+ yrs, 15+ yrs, bread earners, gender)
Food production (cereal & non-cereal,
fisheries, livestock) Level of education (15+ yrs, bread earners, gender)
Food requirement (cereal & non-cereal,
fisheries, livestock) Land ownership Food availability (cereal & non-cereal,
fisheries, livestock)
Sources of income Food intake (cereal & non-cereal, fisheries,
livestock) E. Risks and Shocks
B. Factors of production Disaster (flood, drought, cyclone) Cropping intensity Seasonality
Irrigation Coping capability Rainfall F. Access to Infrastructure
C. Food Accessibility Access to electricity
Poverty incidence Access to paved road Poverty inequality (income)
Food expenditure Food price
Income/Expenditure share (cereal, non-cereal;
food, non-food, education, housing, recreation etc.)
Sources of data and information
In Bangladesh a large number of government, national and international NGOs (non- government organizations) and private organizations are involved in the generation of primary data on food production, food availability, food accessibility and food consumption, health and nutrition. Initially a thorough inventory was made on all available data sources related to food insecurity and vulnerability. Among the government agencies Bangladesh Bureau of Statistics (BBS) under the Ministry of Planning is the only authorized agency to publish national level data on behalf of the government of Bangladesh. In the report a number of data and information sources were used the list of which are given bellow:
1. Population Censuses, Bangladesh Bureau of Statistics 2. Census of Agriculture, Bangladesh Bureau of Statistics
3. Household Expenditure Surveys, Bangladesh Bureau of Statistics
4. The Child Education and Literacy Survey, Compulsory Primary Education Implementation Monitoring Unit (CPEIMU)
5. Education Watch, Campaign for Popular Education (CAMPE) and BRAC 6. Bangladesh Statistical Yearbooks, Bangladesh Bureau of Statistics 7. Data on rainfall, Bangladesh Meteorological Department (BMD)
8. Data on road infrastructure, Local Government Engineering Department (LGED) 9. Data on agricultural production, Department of Agriculture Extension (DAE)
Bangladesh FIVIMS Baseline Report: Agro- and Socio-economics 13 10.Data on losses from natural disasters, Disaster Management Bureau (DMB)
11.Data on food price, Department of Agricultural Marketing (DAM)
12.Data on food procurement, import and stock, Food Production Monitoring Unit (FPMU)
Limitations
This report uses available published and unpublished information collected from different ministries, government departments, academic and research institutions, national and international NGOs, donor agencies and also from websites. Food security is a complex problem which needs to be looked at from various dimensions. Due to lack of access to any primary database it was not possible to relate all the different dimensions of food security which is very much essential in characterizing and identifying the food insecure and most vulnerable.
Most of the data collected from various published documents and used in the FIVIMS baseline describe rural/urban, divisional or at best district level situation. There is an urgent need to incorporate the Upazila level data due to the fact that the poor and most vulnerable are not evenly distributed among different parts of a particular district. Some of the survey (data sets the published reports of which are used in this report) actually collected Upazila level data but not put the results in the report. Others published partial results of their survey data due to may be time constraint or some other priority reasons.
Due to lack of access to primary data base, the analysis of which might take longer time, it was not possible for the team to incorporate all the unpublished dimensions of the problem.
III. Basic Information about Bangladesh
Bangladesh is predominantly a flat land with a total area of 147,872 sq. km, extending from the Bay of Bengal in the south to the highlands of India under the foothills of the Himalayas in the north. More than 250 rivers, including the three major ones – the Padma (downflow of the Ganges), the Jamuna (downflow of the Brahmaputra) and the Meghna, drain the Himalayan ranges and pass to the Bay of Bengal through this small country. The huge volume of water brings with it the yearly cycle of floods and an estimated annual silt load of about 2.4 billion tons (UNDP 1995) . This constitutes the natural base for soil revitalization. Moreover, Bangladesh, lying between latitudes 210 and 260 N and longitudes 880 and 930 E, is strongly affected by heavy monsoons. The yearly rainfall ranges from 120 to 240 cm, with an average of 200 cm (MOE/GOB 1993).
Bangladesh is a subtropical country with three main seasons. Hot (March-May) with high weather temperature and increased humidity in the air, monsoon (June –September) with regular rainfall and rising rivers and cool seasons (October-February) with drier air and cooler temperature. The average temperature in the country ranges between 110C to 340C. The country is divided into 6 administrative divisions, 64 districts and 507 sub- districts (Upazilas) (BBS, 2002).
Demography
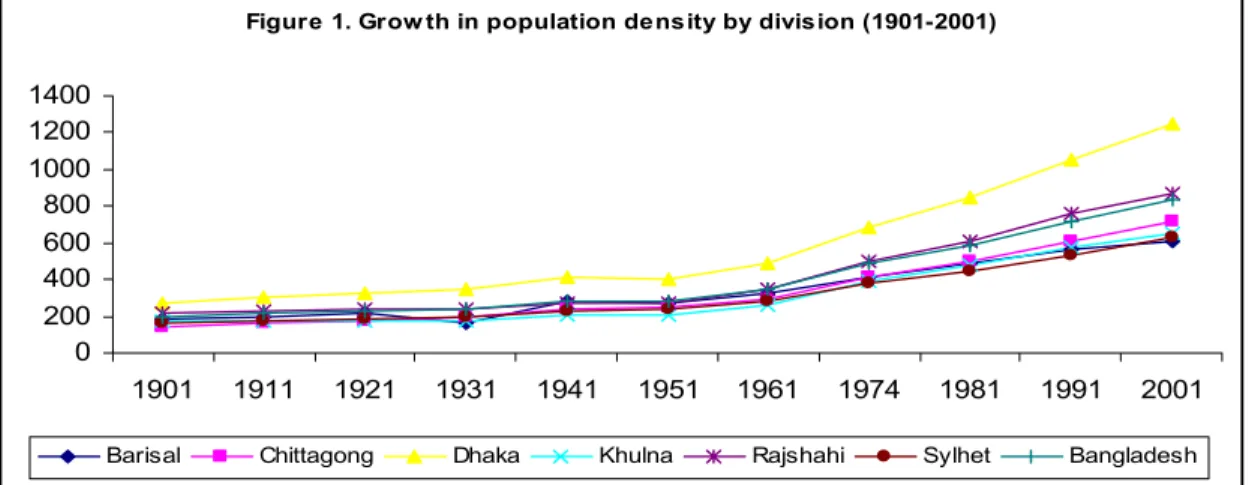
Bangladesh FIVIMS Baseline Report: Agro- and Socio-economics 14 According to Population Census 2001 provisional report the estimated population in the country was 123.85 million with an average household size of 4.9 persons. Around 77% of the population live in the rural areas. The male- female ratio is 104:100. Bangladesh is one of the most densely populated countries in the world with 838 persons living per sq.
km of the territory. Among its six administrative divisions population density is highest in Dhaka (1253 per sq. km) and lowest in Barisal (613 per sq. km.) (Figure 1). In terms of growth the country’s population has more than tripled in one century and the highest growth was in Chittagong division (389%) followed by Dhaka (369%) and Rajshahi (300%).
Figure 1. Grow th in population density by division (1901-2001)
0 200 400 600 800 1000 1200 1400
1901 1911 1921 1931 1941 1951 1961 1974 1981 1991 2001
Barisal Chittagong Dhaka Khulna Rajshahi Sylhet Bangladesh
Source: Population Census 2001, BBS
The country achieved remarkable success in reducing its annual population growth rate from 2.9% in the mid-seventies to 1.5% in the late-nineties, which was lower than that in India (1.8%) and Pakistan (2.5%). The total fertility rate (TFR) has also declined from 6.3 to 2.9 within 1975-2000 periods. The country’s total population will be more than 180 million in 2025 and 208 in 2050 if it cannot manage to further reduce the current fertility rate.
Distribution of rural households with land ownership
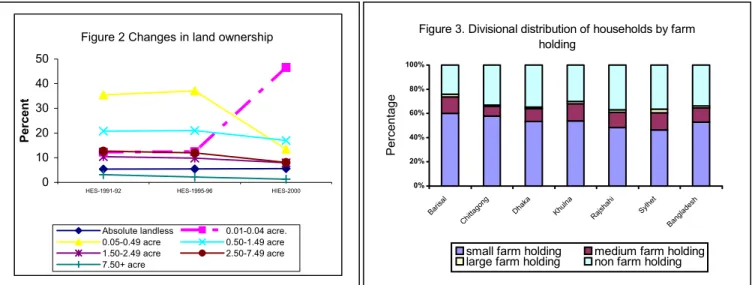
Land is the major productive asset of the rural Bangladeshi people. Increasing population pressure to this scarce resources, increases total number of the destitute with no land and the number of effective landless in the country. According to HIES 2000, percent of rural households owning less than 5 decimals of land has increased three-fold from 18% in 1991/92 to 52% in 2000, meaning that more than half of the rural households are now absolute landless. Along with increase in absolute landless households also increases the number of marginal and small farmers, with concomitant decrease in the number of large farmers owning more than 7.50 acres of land across the country (Figures 2 & 3). Rapid urbanization and increasing use of land for infrastructural development are also the other reasons for nearly 1% annual loss of agricultural land (Table 3).
Bangladesh FIVIMS Baseline Report: Agro- and Socio-economics 15 Source: HIES 2000, BBS
Source: HIES 2000, BBS Source: The Bangladesh Census of Agriculture, 1996, BBS IV. The Land Use
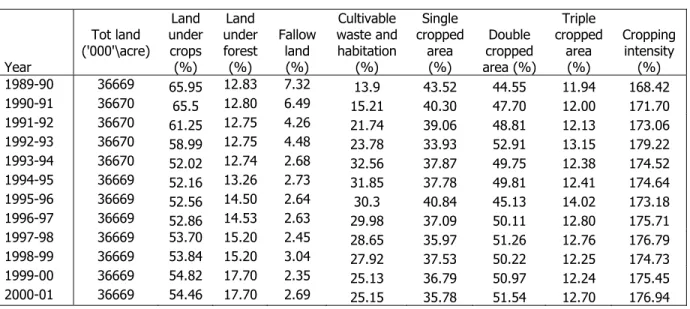
According to land utilization statistics presented in Table 3 over the last one decade
(1989/90 to 2000/01) the net sown area has declined from 66% to 55%, indicating loss of agricultural land at an annual rate of approximately 1.0%. Statistics show a little
improvement of the situation in the late nineties – the use of land for forest increased by 5 percentage points from 13% to 18% due to might be the effect of mass campaign of social forestry programme of the govt. and the NGOs involved in the implementation process of the govt.
Table 3. Land Utilization Statistics
Year
Tot land ('000'\acre)
Land under
crops (%)
Land under forest (%)
Fallow land (%)
Cultivable waste and habitation
(%)
Single cropped
area (%)
Double cropped area (%)
Triple cropped
area (%)
Cropping intensity
(%) 1989-90 36669 65.95 12.83 7.32 13.9 43.52 44.55 11.94 168.42 1990-91 36670 65.5 12.80 6.49 15.21 40.30 47.70 12.00 171.70 1991-92 36670 61.25 12.75 4.26 21.74 39.06 48.81 12.13 173.06 1992-93 36670 58.99 12.75 4.48 23.78 33.93 52.91 13.15 179.22 1993-94 36670 52.02 12.74 2.68 32.56 37.87 49.75 12.38 174.52 1994-95 36669 52.16 13.26 2.73 31.85 37.78 49.81 12.41 174.64 1995-96 36669 52.56 14.50 2.64 30.3 40.84 45.13 14.02 173.18 1996-97 36669 52.86 14.53 2.63 29.98 37.09 50.11 12.80 175.71 1997-98 36669 53.70 15.20 2.45 28.65 35.97 51.26 12.76 176.79 1998-99 36669 53.84 15.20 3.04 27.92 37.53 50.22 12.25 174.73 1999-00 36669 54.82 17.70 2.35 25.13 36.79 50.97 12.24 175.45 2000-01 36669 54.46 17.70 2.69 25.15 35.78 51.54 12.70 176.94 Source: BBS various years
Figure 2 Changes in land ownership
0 10 20 30 40 50
HES-1991-92 HES-1995-96 HIES-2000
Percent
Absolute landless 0.01-0.04 acre.
0.05-0.49 acre 0.50-1.49 acre 1.50-2.49 acre 2.50-7.49 acre 7.50+ acre
Figure 3. Divisional distribution of households by farm holding
0%
20%
40%
60%
80%
100%
Barisal Chittago
ng Dhak
a Khulna
Rajsha hi
Sylhet Bangladesh
Percentage
small farm holding medium farm holding large farm holding non farm holding
Bangladesh FIVIMS Baseline Report: Agro- and Socio-economics 16 Use of Agricultural Land
With the increasing population pressure the country has to adopt green revolution packages1 at the beginning of the 1960s to increase its food production. Currently nearly two-thirds of the total cultivable land are being used for multiple crop production (see map in Annex 1).
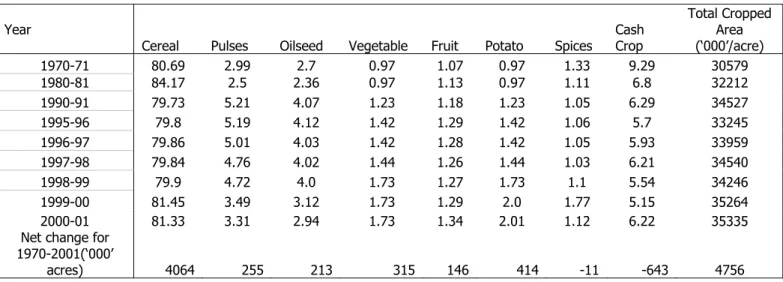
Rice is the major staple food in Bangladeshi diet and more than 80% of the total cropping area are used for paddy production (Table 4). In percentage terms the allocation of land for cereal (rice and wheat) cultivation remained the same since independence but in absolute terms the total area under cereal cultivation has increased quite significantly.
Eighty-five percent of the total increased cropped area are used for cereal production.
After cereals expansion has taken place for potato and vegetable cultivation. Land area used for pulses and oilseeds production increased up to 1997/98 and since then a gradual declining trend was observed.
Table 4. Cropping area utilization under different crops (%)
Year
Cereal Pulses Oilseed Vegetable Fruit Potato Spices
Cash Crop
Total Cropped Area (‘000’/acre) 1970-71 80.69 2.99 2.7 0.97 1.07 0.97 1.33 9.29 30579 1980-81 84.17 2.5 2.36 0.97 1.13 0.97 1.11 6.8 32212 1990-91 79.73 5.21 4.07 1.23 1.18 1.23 1.05 6.29 34527 1995-96 79.8 5.19 4.12 1.42 1.29 1.42 1.06 5.7 33245 1996-97 79.86 5.01 4.03 1.42 1.28 1.42 1.05 5.93 33959 1997-98 79.84 4.76 4.02 1.44 1.26 1.44 1.03 6.21 34540 1998-99 79.9 4.72 4.0 1.73 1.27 1.73 1.1 5.54 34246 1999-00 81.45 3.49 3.12 1.73 1.29 2.0 1.77 5.15 35264 2000-01 81.33 3.31 2.94 1.73 1.34 2.01 1.12 6.22 35335 Net change for
1970-2001(‘000’
acres) 4064 255 213 315 146 414 -11 -643 4756 Source : BBS Various years
Irrigation as one the factors of production
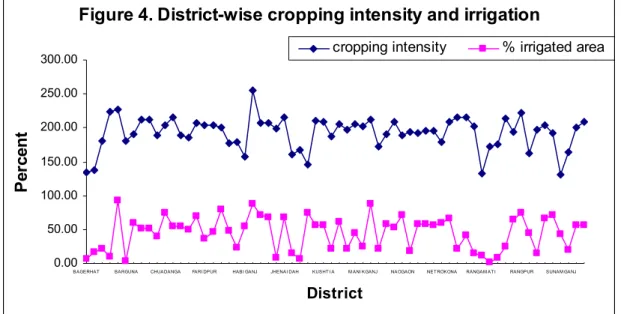
One of the major factors contributing to increase in cropping intensity was the coverage of new areas under irrigation (Figure 4). The recent achievement of Bangladesh to become self- sufficient in rice production was due mainly to expansion of cropping area under irrigated boro rice cultivation which gives twice higher yield than the other rice crop.
According to the statistical reports of BBS, in 1970/71 only 8.3% of the total paddy area was under boro cultivation. Over years area under boro rice has grown at a fast rate and by 2000/01 it reached up to 34.5% to total paddy area. This was possible due mainly to introduction of irrigation facilities. In 1980/81, area irrigated to total cropping area was only 12.4% which reached to 31% in 2000/01. Irrigation coverage varies widely among
1 Expansion of total cropping area by increasing cropping intensity, replacement of low to high yielding varieties, use of chemical fertilizers and insecticides and pesticides, irrigation and improvement of production management.
Bangladesh FIVIMS Baseline Report: Agro- and Socio-economics 17 districts with lowest level in Patuakhai (only 1.3% of the total cropped area) and highest in Bogra (92% of the total cropped area) (see figure 4).
Figure 4. District-wise cropping intensity and irrigation
0.00 50.00 100.00 150.00 200.00 250.00 300.00
BAGERHAT BARGUNA CHUADANGA FARI DPUR HABI GANJ JHENAI DAH KUSHT I A M ANI KGANJ NAOGAON NET ROKONA RANGAM AT I RANGPUR SUNAM GANJ
District
Percent
cropping intensity % irrigated area
Sources: DAE, Ministry of Agriculture, Agricultural Census 1996, BBS
The development of irrigation facilities negatively correlated with the average rainfall.
Observatory-wise average rainfall data for the last 13 years provides the evidence for that.
For example, average annual rainfall in Bhola, Patuakhali, Feni, Rangamati and some other districts of Sylhet, Barisal and Khulna divisions are relatively high. These are the districts where irrigation facilities are also very low (Table 5).
Bangladesh FIVIMS Baseline Report: Agro- and Socio-economics 18 Table 5. Average monthly rainfall (cm) over the last 13 years (1990-2002)
Sl.
No. Observation
stations Jan Feb. March April May June July Aug. Sept. Oct. Nov. Dec. Total Average 1 Dinajpur 11 10 9 66 198 384 387 355 477 125 10 9 2056 171 2 Rangpur 12 11 20 122 261 447 383 379 409 175 12 4 2240 187
3 Rajshahi 6 19 20 51 142 253 314 244 317 105 18 8 1501 125
4 Bogra 10 14 14 77 201 305 378 297 353 142 10 10 1816 151
5 Mymensingh 9 22 42 136 329 421 411 323 350 214 19 7 2288 191 6 Sylhet 10 49 159 331 561 787 760 625 535 168 21 7 4024 335 7 Srimangal 8 45 106 170 434 449 358 336 272 194 35 14 2426 202
8 Ishurdi 6 25 35 75 179 263 278 219 342 97 19 8 1552 129
9 Dhaka 10 23 67 116 330 281 379 312 288 182 32 10 2034 170 10 Comilla 11 33 89 140 345 355 460 288 214 159 49 13 2160 180 11 Chandpur 6 33 72 197 275 325 427 313 261 143 33 5 1994 166 12 Jessore 14 25 49 65 179 328 316 248 243 112 39 8 1631 136 13 Faridpur 11 28 46 117 248 307 336 309 226 177 36 9 1856 155 14 Madaripur 7 33 68 122 276 374 394 325 249 155 46 5 2059 172 15 Khulna 14 59 59 61 179 344 327 301 259 127 47 5 1788 149 16 Satkhira 14 43 49 87 160 304 361 284 289 127 40 4 1769 147 17 Barisal 14 33 77 106 233 410 443 331 236 176 59 4 2126 177
18 Bhola 10 36 74 98 256 473 434 343 264 178 50 5 2226 186
19 Feni 6 36 115 180 392 552 680 576 321 184 71 9 3090 258 20 M.court 8 36 109 142 365 559 668 567 349 202 67 7 3101 258 21 Hatiya 6 27 63 91 333 625 670 488 409 267 60 20 3079 257 22 Sitakunda 7 35 109 145 393 581 693 557 329 240 74 12 3163 264 23 Sandwip 14 33 102 105 459 804 873 649 394 270 69 10 3656 305 24 Chittagong 7 41 71 115 364 572 705 548 246 216 63 17 2963 247 25 Kutubdia 9 29 70 73 303 680 821 564 276 218 83 11 3135 261 26 Cox's Bazar 6 28 57 84 370 821 1013 691 400 239 109 15 3837 320 27 Teknaf 0 23 23 50 344 1039 1168 964 405 265 87 5 4379 365 28 Rangamati 7 31 101 116 411 505 580 430 268 157 60 17 2688 224 29 Patuakhali 7 36 55 123 228 556 574 470 360 209 58 4 2686 224 30 Khepupara 6 38 64 107 314 550 684 482 370 290 81 8 2997 250 31 Sydpur 12 6 22 87 221 425 420 344 463 141 12 6 2164 180 32 Tangail 8 27 53 125 281 303 327 265 302 138 29 9 1872 156 33 Mongla 10 36 48 71 191 389 356 329 326 153 53 1 1968 164 34 Chuadanga 15 24 21 50 166 245 334 232 307 109 24 10 1543 129 Total (cm) 311 1027 2138 3801 9921 16016 17712 13988 11109 6054 1575 296 83867 6989 Average (cm) 9 30 63 112 292 471 521 411 327 178 46 9 2467 206 Source: Bangladesh Meteorological Department (BMD)
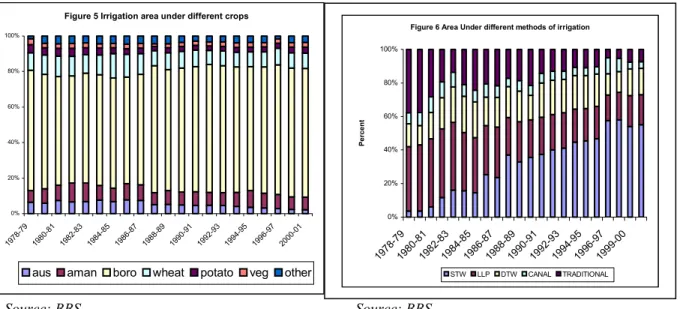
It is revealed from Figure 5 that irrigation is mainly provided for rice (aus, aman and boro), wheat, potato and vegetable cultivation. Irrigated boro rice area constituted by almost three-fourths of the total irrigated area and the trend was in the increase in recent years. Regarding methods of irrigation the Low Lift Pump (LLP) and other traditional methods which were of common use two decades ago have been gradually replaced by relatively low cost shallow tube-wells (STW) which are more suitable to our country context dealing mainly with small and marginal farmers. This happened also because of the fact that the commanding area needed for STW installation is relatively low, it can be reinstalled if necessary and also it is easy to handle (Figure 6).
Bangladesh FIVIMS Baseline Report: Agro- and Socio-economics 19
Figure 5 Irrigation area under different crops
0%
20%
40%
60%
80%
100%
1978- 79
1980- 81
1982- 83
1984- 85
1986- 87
1988-89 1990-
91 1992-93
1994- 95
1996-97 2000-
01
Percent
aus aman boro wheat potato veg other
Source: BBS Source: BBS
V. Food Production and Net Production Availability
Food production
Although food production data are collected by BBS, Bangladesh Rice Research Institute (BRRI), Bangladesh Agricultural Research Institute (BARI), Department of Agriculture Extension (DAE), Ministry of Food and Ministry of Agriculture on a regular basis, BBS is the only authorized body under government structure to publish production data. In terms of level of disaggregation, the published documents used for preparing the present report provide mainly district level data on cereal production; for the other food items, only the national aggregate level data are available.
According to BBS, the country made remarkable progress in food production, especially rice, both in absolute amount and in per capita terms during the decade of 90s (Table 6).
In 1999/00 a total of 25 mmt of food grains (rice and wheat) were produced, more than the requirement of its total population as a whole. Vegetable production was almost doubled and the greater increase registered in the latter half of the decade. The year of 1999-00 experienced a milestone in potato production from 1240 thousand tons to 2951 thousand tons (a 2.5-fold increase), resulting in increase in per capita availability from the ever stagnating value of 30-37 g/day to 64 g/day. Along with cereal and vegetables visible achievements were also observed in the poultry and livestock sector. The 1990s was a decade of sustained increase in all kinds of animal products – fish, meat, egg and milk. The per capita availability of fish increased from 20 g/day in 1991 to 34 g/day in 1999/00 which was essentially due to increase in inland fishery. Meat production increased, superceding the rate of increase in population, so the per capita availability increased to a value of 13 g/day in 2000 from 8 g/day in 1991. Egg and milk registered similar increasing pattern, but the availability of egg remained appallingly low (4 g/day).
All together, at the decade end the per capita availability of total animal food was 86 g/day.
Figure 6 Area Under different methods of irrigation
0%
20%
40%
60%
80%
100%
1978-79 1980-81
1982-83 1984-85
1986-87 1988-89
1990-91 1992-93
1994-95 1996-97
1999-00 Year
Percent
STW LLP DTW CANAL TRADITIONAL
Bangladesh FIVIMS Baseline Report: Agro- and Socio-economics 20
Along with the positive change in some food items, negative growth was also observed in some other food items. Total production of pulses (one of the major sources of protein for the poor), oilseeds and fruits has gone down. These items thus appear to have become casualties of the revolution in cereal production. Production of pulses increased somewhat during 1991-95 (during which time rice production decreased), but then their production showed a steady decrease, which showed a record low value of 383 thousand tons in 1999-2000. Accordingly, per capita availability decreased. Same was the fate of fruits and oilseeds (oil).
The net production availability of sweeteners and spices remained almost unchanged during the decade.
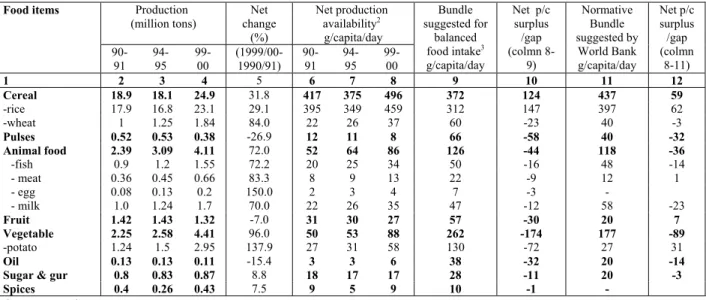
Table 6. Production, availability of selected food items in Bangladesh, 1991-2000.
Production
(million tons) Net change
(%)
Net production availability2 g/capita/day Food items
90- 91
94- 95
99- 00
(1999/00- 1990/91)
90- 91
94- 95
99- 00
Bundle suggested for
balanced food intake3 g/capita/day
Net p/c surplus /gap (colmn 8-
9)
Normative Bundle suggested by
World Bank g/capita/day
Net p/c surplus /gap (colmn
8-11) 1 2 3 4 5 6 7 8 9 10 11 12 Cereal 18.9 18.1 24.9 31.8 417 375 496 372 124 437 59 -rice 17.9 16.8 23.1 29.1 395 349 459 312 147 397 62 -wheat 1 1.25 1.84 84.0 22 26 37 60 -23 40 -3 Pulses 0.52 0.53 0.38 -26.9 12 11 8 66 -58 40 -32
Animal food 2.39 3.09 4.11 72.0 52 64 86 126 -44 118 -36
-fish 0.9 1.2 1.55 72.2 20 25 34 50 -16 48 -14 - meat 0.36 0.45 0.66 83.3 8 9 13 22 -9 12 1
- egg 0.08 0.13 0.2 150.0 2 3 4 7 -3 -
- milk 1.0 1.24 1.7 70.0 22 26 35 47 -12 58 -23 Fruit 1.42 1.43 1.32 -7.0 31 30 27 57 -30 20 7 Vegetable 2.25 2.58 4.41 96.0 50 53 88 262 -174 177 -89 -potato 1.24 1.5 2.95 137.9 27 31 58 130 -72 27 31 Oil 0.13 0.13 0.11 -15.4 3 3 6 38 -32 20 -14 Sugar & gur 0.8 0.83 0.87 8.8 18 17 17 28 -11 20 -3 Spices 0.4 0.26 0.43 7.5 9 5 9 10 -1 -
Source: BBS various years,
VI. Food Production and the Balanced Diet
One of the major challenges for the country is to feed its huge number of population with sufficient quantity of food. Bangladesh not having much means to import all food it requires, the domestic agricultural production is the main determinant in shaping the meals, and therefore the nutrition, of the people at large. Table 6 also provides a detail calculation about the net production availability by broad food items, their differences with the poverty bundle suggested by the World Bank and the bundle suggested for a balance diet4.
2 calculated based on production data presented in Table 1. Net production availability = (Gross production – 10% deducted for seed and loss from the gross production)/Total population
3 Yusuf, H.K.M. (1997), Sustainable Food Security Report, FAO, 1997.
4A balanced diet is one that is composed of food items in such quantities and such proportions as to meet the requirements of all the nutrients the body needs to maintain a healthy and active life. Recommendations for balanced diets for an average Bangladeshi are available for Bangladesh (Yusuf and Halder, 2002). Among all, the bundle suggested by Yusuf conforms more closely to the universally accepted energy ratios for balanced
Bangladesh FIVIMS Baseline Report: Agro- and Socio-economics 21 According to the World Bank prescribed minimum food bundle, the country broadly reached its self-sufficiency level in cereal production and also in the production of potato, fruits and meat. The comparison with the bundle suggested for balanced diet indicate that the country still is deficient in production of all the non-cereal food items if it wants to provide balanced food for all.
Net food availability and food intake
Except the cereals available information does not allow to calculate net availability5 of food consumed at household level since local production is only one of the many market sources for that. There are many other legal (including public and private import, food aid) and illegal (cross-border trade) sources from which goods are entering into the market and for which no national level data are available. There is also lack of information about what proportion of the imported consumable goods is used for human consumption. In this respect the actual household level consumption can act as a good proxy for that. The difference between production and actual consumption indicate the proportion of the food coming from different non-production sources. Differences between actual consumption (which has been considered as a proxy for market availability) and the prescribed bundles showing the consumption-requirement gap can help the policy maker in formulating appropriate policy interventions.
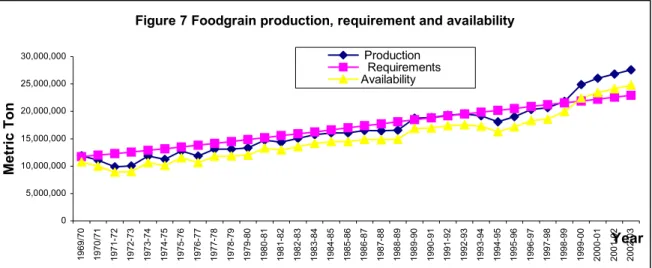
Figure 7 and Annex 2 presents foodgrain production, requirement and net availability for 1969/70 – 2002/03 years. The macro-availability data indicate a considerable acceleration in the aggregate foodgrain production in the country over the years since independence.
This accelerated growth performance of cereal production as already mentioned in the IPRSP6 document need to be weighted against potential limitation posed by gradual decline in the total amount of cultivable land (as already mentioned above).
food: energy from carbohydrate – 60%, from fat/oil – 25%, and from protein – 15% (Garrow and James, 1995). The formulation provides a total quantity of food as 949 g/person/day, supplying 2310 Kcal and 69 g protein.
5 Net availability is calculated by deducting 10% for seed, feed and wastage from production and then added with net import and changes in government stock.
6 Interim Poverty Reduction Strategy Paper
Bangladesh FIVIMS Baseline Report: Agro- and Socio-economics 22 Figure 7 Foodgrain production, requirement and availability
0 5,000,000 10,000,000 15,000,000 20,000,000 25,000,000 30,000,000
1969/70 1970/71 1971-72 1972-73 1973-74 1974-75 1975-76 1976-77 1977-78 1978-79 1979-80 1980-81 1981-82 1982-83 1983-84 1984-85 1985-86 1986-87 1987-88 1988-89 1989-90 1990-91 1991-92 1992-93 1993-94 1994-95 1995-96 1996-97 1997-98 1998-99 1999-00 2000-01 2001-02 2002-03Year
Metric Ton
Production Requirements Availability
Source: BBS, Bangladesh Food Grain Digest, July 2002, World Food Programme
Due to lack of net availability data for non-cereal items a comparison between production and actual consumption has been made and the results presented in Table 7 show a reducing gap between these two, indicating the declining dependence of import and increasing strength of the local economy to feed its people by using its internal resources.
According to table, in 1999/00 the country was in a position to fulfill 100% demand for cereal, meat, liquid milk, potato, sugar and gur. The country could also reduce the gap between supply and demand on fish (due to increasing expansion of inland fish cultivation) and vegetables. At the same time the market demand on pulses and spices are fulfilled mainly by the import.
Table 7. Differences between production and actual consumption of selected food items
1 Source: HIES 2000, BBS
2 Calculated using data of Table 6
Food item Differences between 2000 actual consumption and
the prescribed bundles2 (%) Production contribution to consumption2 (%) World Bank Balanced diet 1995/96 2000
Cereal 10.2 23.6 73.7 101.9
-rice 13.4 32.0 75.2 100.1
-wheat -132.6 -248.8 77.2 215.1
Pulses -150.0 -312.5 78.6 50.0
Animal food -34.1 -43.2 70.3 97.7
-fish -23.1 -28.2 56.8 87.2
- meat 7.7 -69.2 75.0 100.0
- egg na -16.7 100.0 66.7
- milk -93.3 -56.7 81.3 116.7
Fruit 28.6 -103.6 107.1 96.4
Vegetable -25.5 -85.8 34.6 62.4
-potato 50.9 -136.4 62.0 105.5
Oil -53.8 -192.3 30.0 46.2
Sugar & gur -185.7 -300.0 188.9 242.9
Spices - 80.0 13.5 18.0
Bangladesh FIVIMS Baseline Report: Agro- and Socio-economics 23 VII. Food Intake
Data on food intake are collected by many organizations. The Poverty Monitoring Survey, Household Expenditure Survey (HES) and Household Income and Expenditure Survey (HIES) – are the three major data sources under BBS collecting consumption data from a nationally representative sample which can be disaggregated up to 5 divisional and urban and rural levels. HKI is also collecting consumption data since 1990 under its Nutrition Surveillance Project (NSP). NSP collects data once in every two months to cover vulnerability to seasonality. International Food Policy Research Institute (IFPRI) also conducted a Food Consumption and Nutrition Survey in Bangladesh in 1991/92. BRAC has a time series and panel database on consumption from a representative sample of its micro-finance beneficiaries and also from other non-BRAC equally poor households who are not members of any NGOs. The Institute of Nutrition and Food Science (INFS) of Dhaka University collected data for national nutrition surveys, first in 1962/64,and which also has gender disaggregated data relating to who within the household consumes what proportion of food (intra-household food distribution).
Table 8 presents national, rural and urban aggregate results of INFS and BBS on food consumption for various years. According to INFS, during 1962/64-1995/96 per capita total food intake in rural and urban areas had fallen 99 g/capita/day in rural (from 841 to 742 g/capita/day) and 24 g/capita/day (from 726 to 702 g/capita/day) in the urban areas.
At the national level, except potato and meat consumption of all other items had fallen during the 1962/64 and 1995/96 periods. The rural data showed a steady decrease for all items during 1962/64 - 1981/82 periods after which slight improvements (but less than the 1962/64 level) were observed for non-cereal items. The urban data available for 1962/74 and 1995/96 years also showed that except cereal and potato, consumption amount of all other food items was less in 1995/96 the amounts consumed in 1962/64.
Cereal consumption during these periods showed only 15 g/capita/day increase while potato consumption was more than doubled (increased from 32 g/capita/day to 77 g/capita/day). Results of the calorie and nutrient intake show a steady decrease in the rural areas.
According to HES/HIES of BBS, per capita aggregate consumption of major food items, both in physical amount and in calorie terms, had significantly increased in the first half of nineties but declined in the second half of the decade (both in rural and urban areas), the period when significant increase in production of major food items were observed7. The major decrease was for wheat, rice, vegetables, fish and sweeteners consumption. On the other hand, the results show that consumption of pulses in the rural areas, the local production of which has declined in the second half of nineties has increased from 13 g/capita/day to 15 g/capita/day.
A large differences exists between INFS and HES in total food and total calorie intake, presumably due to differences in methodologies8 applied for data collection and data analysis. For example, while the 1995/96 survey of INFS show average food intake of 728
7 The contradiction between impressive growth of production and decrease in consumption in the latter part of the decade is difficult to explain.
8 INFS of Dhaka University uses food weighing method and HES of BBS uses 24-hours recall method
Bangladesh FIVIMS Baseline Report: Agro- and Socio-economics 24 Table 8: Trend and pattern of national average food intake in Bangladesh (1962-2000)
Intake
g/capita/day (INFS)a Intake
g/capita/day (BBS)
National Rural Urban National Rural Urban Food
1962-64 1995-96 1962/64 1975-76 1981-82 1995-96 1962-64 1995-96 91/92 1995-96 2000 1995-96 2000 1995-96 2000
Cereals 488 436 536.9 523 488 452 363.7 379 487 508.7 486.7 521.9 502.8 442.1 422.4
Pulses 27.6 11 28 23.8 8.0 16 26.5 10 14 14.0 15.6 12.9 15.0 19.4 19.0
Animal food 74.2 61 57.6 44.1 44.5 54 117 85 56 91.2 86.7 84.5 82.2 123.8 104.5
Fish 35.4 33 33 22.3 23 32 41.9 37 22 43.8 38.5 42.2 37.8 51.7 40.9
Meat poultry and egg 11.4 13 7.3 4.9 6.0 9 21.9 28 11 15.1 18.5 12.0 15.4 30.0 31.0
Milk 27.4 15 17.3 16.8 15.5 13 53.2 20 23 32.3 29.7 30.3 29.0 42.1 32.6
Fruits 15.1 14 10.1 20.6 17.4 18 17.5 13 34 27.6 28.4 25.3 26.5 38.8 35.6
Vegetables
(leafy+non.leafy) 134.5 112 134.6 125.7 120 113 134.4 108 57 152.6 140.5 154.4 141.1 142.9 137.9
Potato+ Sweet potato 48.8 72 55.5 52.3 62.7 70 31.6 77 42 49.5 55.0 46.7 54.7 64.4 58.4
Added oil 8.3 8 6.2 3 3 6 13.7 13 7 9.9 12.8 8.4 11.3 17.0 19.1
Sugar/Gur 8.8 7 7.4 7.3 8.7 6 11.7 9 19 37.2 50.0 35.5 48.5 45.4 56.1
Spices and others 6.11 7.1 4.6 7.2 12.7 6.8 10 8 11 23.1 16.9 20.9 16.6 36.7 17.7
Total amount (g) 811.4 728.1 840.9 806.9 765 741.8 726.1 702 727 913.8 893.1 910.5 898.7 930.8 870.7
Total energy (Kcal) 2118 1868 2251 2094 1943 1892 1777 1779 2021 2254 2240 2263 2263 2208 2150
Total protein (g) 55.31 46.93 57.5 58.5 48.4 46.36 49.7 48.99 49 66.01 62.5 65.38 61.88 69.19 64.96
Energy from cereal (%) 79.3 80.3 82.0 85.9 86.4 82.2 70.4 73.3 83 78.0 75.4 79.7 77.1 69.2 68.5
a- Jahan and Hossain, 1998