in the Department of Computer Science and Engineering, Daffodil International University has been accepted as sufficient for partial fulfillment of the requirements for the degree of B.Sc. Department of Computer Science and Engineering Faculty of Science and Information Technology Daffodil International University. We would like to express my sincere gratitude to Almighty Allah and the Head of CSE Department for his kind help in completing our project and also to other faculty members and staff of CSE Department of Daffodil International University.
So, if a student spends his/her time doing a lot of those activities, he/she will not be able to make a good score. They, can prepare them to score well by following our SGPA & CGPA prediction project routine. As a result, students can follow the routine and make a good preparation for the exam to get a good result.
If a student got fewer points than he/she expected, but he/she wants to get a good result, he/she will use our project for SGPA prediction. He/she will receive suggestions from our project on how he/she can prepare for a good result.
Motivation 1
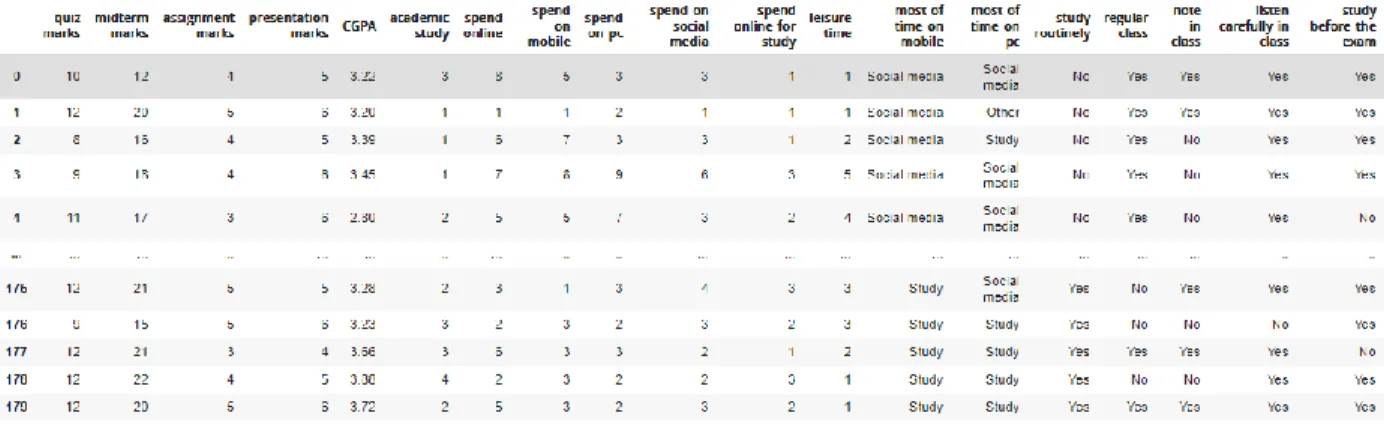
In short, the education system at universities is different than at school or college. At universities there are attendance marks, quiz marks, assignment marks, presentation marks, project marks, interim marks and final exam marks. So if the students get good marks in all segments, they should study more and sincerely.
It is also important for a person, but if students pass their all times or more times by using social media or something like that, they will not be able to make a good result. That's why we built a project called, Prediction Of The Final Exam SGPA & CGPA. There are some students who got good marks in all the segments and there also those students who didn't get good enough marks and also there are students who got the worst marks in all the segments.
Rationale of The Study 2
Research Questions 2
Their findings and limitations are summarized, along with the scope and challenges of the research. In the first section, we will discuss the previous related work, then in the second section, we will show the result or summary of my related work study, and then we will discuss the strengths and challenges faced in carrying out this project. These tests do not consider the withdrawn class (W) because most of the data is missing for such records.
Since the data set is very small (197 records for results, after removal as mentioned above), they perform a stratified 5-fold cross-validation for each of the classifiers to observe and compare their stability. For the first time, they attempted to predict the final grade of students in undergraduate courses based on their performance in the same course before the final exam and the type of course and the teacher teaching that course. They have the following useful conclusions: The grade of more than 96% of students can be accurately predicted even without the result of the final exam.
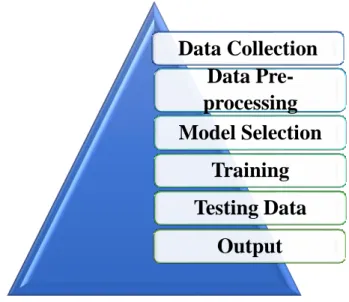
The main focus of this research work is to create a system that can predict the students' final exam results. Since there are several factors available related to prediction results, data collection had faced one of the major difficulties for this research project. When we started collecting data locally, it became too difficult due to the pandemic situation in our country.
Model selection is the most important and also one of the most difficult parts of a research project. For this, we tested several models with our test data in search of the most suitable one for our research project. For research related to machine learning, most researchers use them for their research.
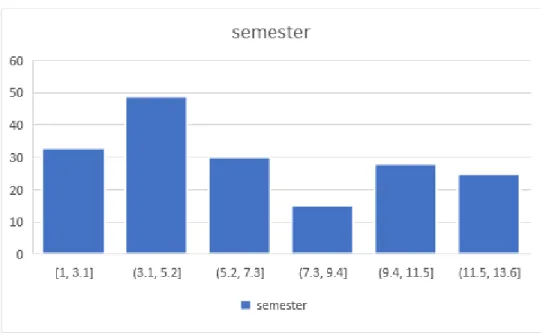
In this chapter for our model and code implementation we first collected the data. Here, at the Fig 4.6 we can see from the graph, here is the effect of semester on results. Use a confusion matrix to visualize the results of the model in the form of a confusion matrix using numpy, seaborn and matplotlib.
Here In this chapter, we discussed whether the results of the study of performance and the results of the study include the analysis of experimental results, and also expressive analysis, this research question. In our research work, some of the dataset is trained and some of the dataset is tested. We are doing this project for the benefit of the college students to predict their SGPA.
Gathering data to predict SGPA and CGPA final exam results using machine learning.
Expected Outcome 2
Report Layout 3
In Chapter 1: In this chapter we can discuss briefly in terms of the introduction, the motivation and then the objectives, and also the expected outcome and so on. In Chapter 2: In this chapter we had given a presentation about the main condition of our work and discussed about the case law in the project. In Chapter 3: In this chapter we talked about research methodology. We discuss the research topic and instruments, data collection procedure, statistical analysis and implementation requirements.
BACKGROUND 4-7
- Related Work 4
- Comparative Analysis and Summary 5
- Scope of The Problem 6
- Challenges 7
Navin venkat (Indian Institute Of Science) & Sahaj Srivastava (Birla Institute of Technology . & Science)[2] is made for a project on predicting student marks using machine learning. Therefore, they have 9 classes (A to E and NC) as they denote the students who took the course until completion. Khurum Nazir Junejo and Eman Eman [3] both made a project on grade prediction using supervised machine learning techniques.
After applying various algorithms for data preprocessing and machine learning on 2,500 course records, they achieved outstanding prediction performance (varying between 73-96% accuracy). This means that students' performance on various instruments before the final exam is strongly related to their performance on the final exam. Another point of interest is that the easiest to predict is an F grade, followed by a C grade, while the hardest to predict is a B+ grade.
Ultimately, the number of students whose grades drop because of their final exam performance is greater than those who improve because of the final exam, and finally the rule induction classifier outperforms the ID3 classifier in predicting student performance. With extensive research on relevant papers and projects, we have come to the decision to use the Naïve Byes Classifier because, this classifier is the best to predict the probability of different classes based on different attributes. The Naïve Byes classifier is the most accurate algorithm among others for data classification, which is the simplest algorithm.
We decided to use Naïve Byes Classifier as the main classification model Naïve Byes Classifier is the first to train and fast to classify. By using the dimensions, we have a good range of accuracy to find the best possible comparison. There will be some range of problems such as students may think that their midterm score is good so they don't need to do much preparation for the final exam.
But from all this research, we have come to the conclusion that the Naïve Byes Classifier algorithm is the easiest and best for us. When we discovered that it provides an easy-to-use library, we realized that the work of the classifier would be easier.
RESEARCH METHODOLOGY 8-11
Research Subject and Instrumentation 8
Data Collection Procedure 9
Here we store all the data in Google Drive as it makes our work easier. In Google Drive we can use that data stored online in our project. We saved all data as CSV files.
Statistical Analysis 10
Implementation Requirements 11
Experimental Setup 12
Model Summary 12
If students do well in the quiz, they will be able to achieve a good SGPA. So if the students get good marks in the intermediate exam too then it is very easy for those students to do good sgpa and cgpa. In our project, we suggest to students how to get a good result on the final exam.
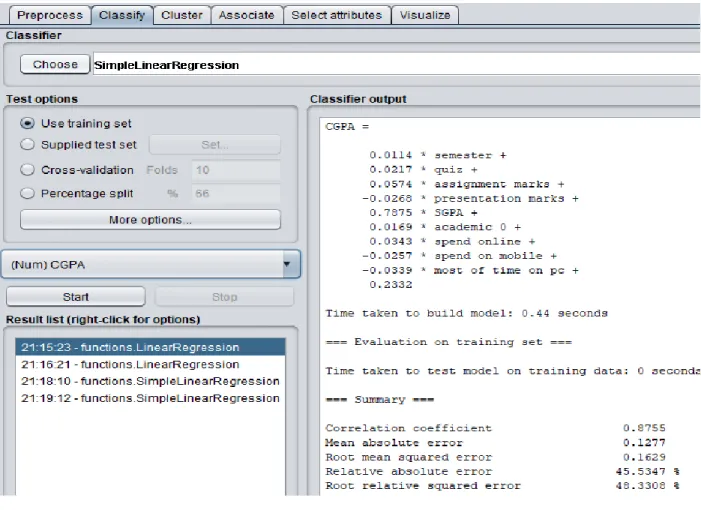
Those who will get good marks in the mid term will easily be able to score well in the final exam. In the WEKA classification we use the tree and choose the Random Forest tree and show that the correlation coefficient for the CGPA rate is 98.34%. In WEKA classification we use the tree and choose the Random Forest tree and show that the correlation coefficient for the SGPA rate is 98.63%.
We take another tree and select Random tree and show the correlation coefficient of CGPA rate is 99.99%. We take another tree and choose Random tree and show the correlation coefficient for SGPA the rate is 1. We take another tree and choose Decision Table and show the same correlation coefficient rate for CGPA.
We take another tree and select Decision Table and show the same correlation coefficient rate for SGPA. From all that research, we can say that the effect of the result will depend on how students manage their time. If students give more time to study, they will get good marks and can achieve a good result.
Experimental Results and Analysis 13
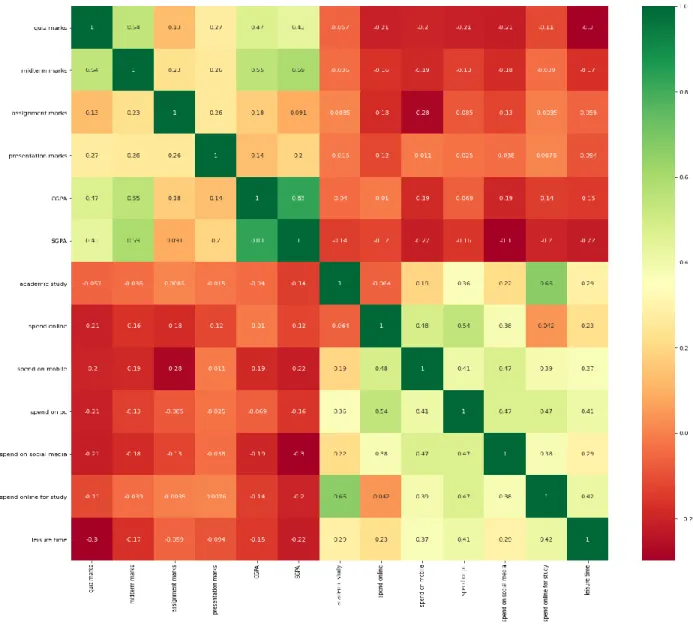
- Correlation For Each Features 13
- Effect of Activities 14
- Assignment 14
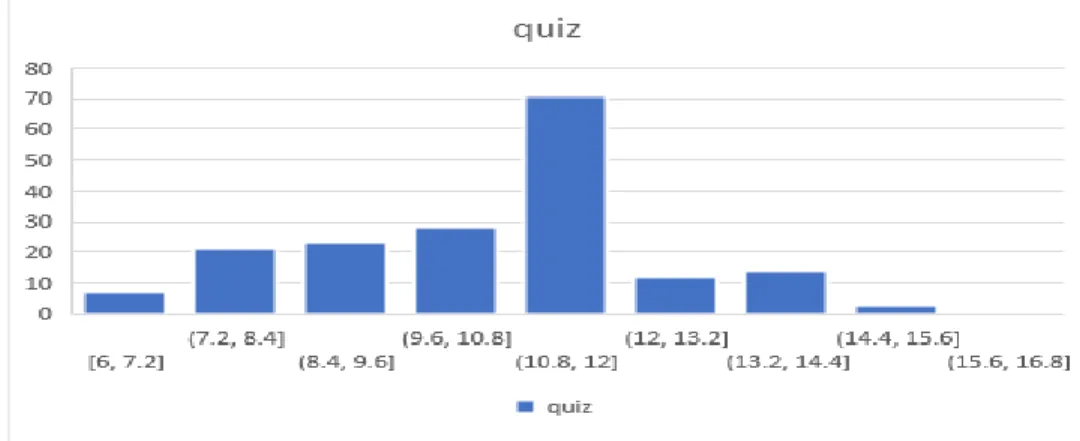
- Quiz 15
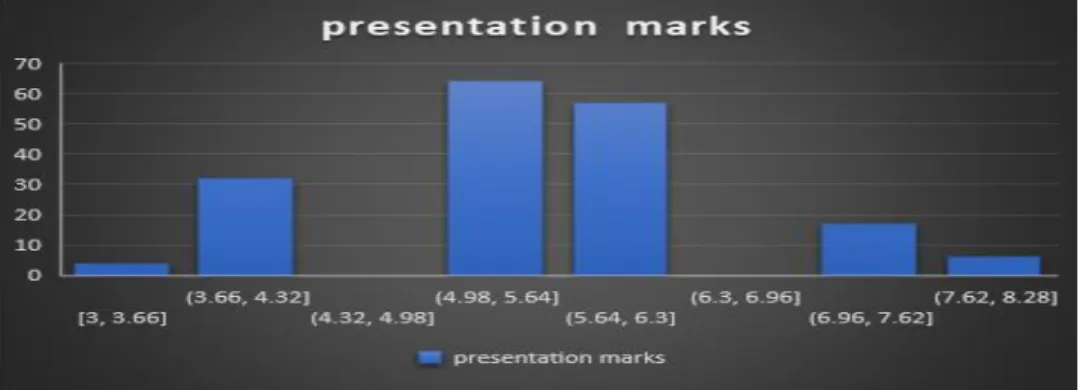
- Presentation 15
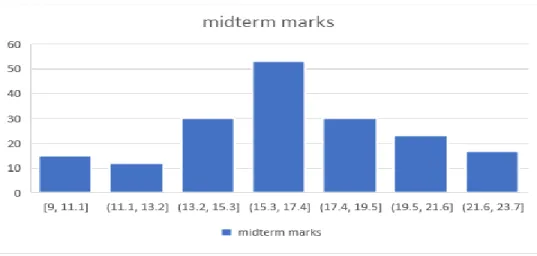
- Mid-Term 16
- Effect Of Semester 17
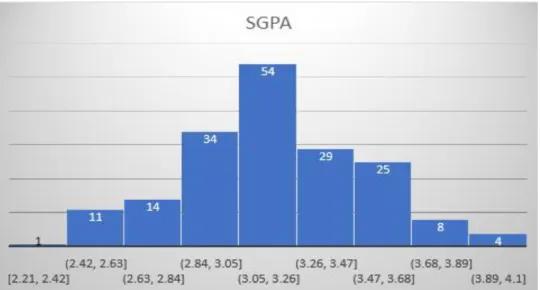
- Effect of SGPA 17
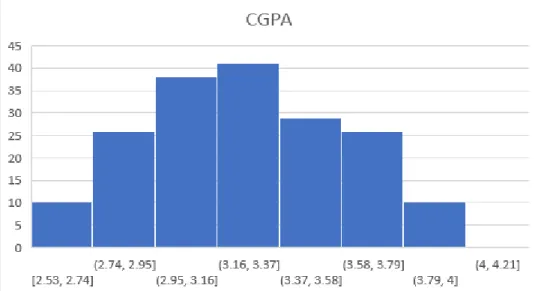
- Effect of CGPA 18
- Linear Operation 19
- Linear Regression 19
- Simple Linear Regression 20
- Random Forest 22
- Random Tree 24
- Decision Table 26
- Logistic Regression Using Confusion Matrix 28
- Effect of Result 29
Discussion 30
Summary of the Study 31
So using machine learning to solve our problems is critical to advancing today's system development inventions. When a student can predict the final SGPA and CGPA using our project, he will be able to make good preparation for a good result. Before working with the Naïve Byes algorithm, we tried many ways to solve our problem and failed to get the best result.
Do you take the help of a teacher/classmate if you do not understand a subject of academic study.
Conclusion 31
Recommendation 31
Implication for future study 32