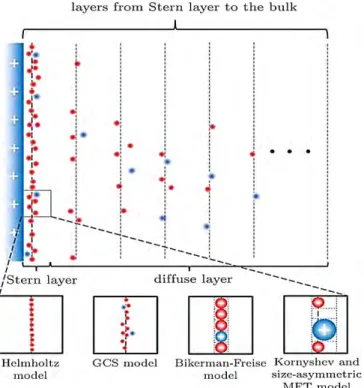
Submitted in partial fulfillment of the requirements for the degree of Master of Mechanical Engineering. EDLC capacitance CSSt : Stern layer capacitance CSD : Diffuse layer capacitance. The set of two layers is called the Gouy–Chapman–Stern (GCS) EDL model.
- Background
- Electrochemical capacitors
- Development of mean-field electrical double layer theory
- Electric double layer (EDL)
- Gouy–Chapman–Stern (GCS) model
- Characterization of EDLC performance
- Advantages of Electrochemical Supercapacitors (ES)
- Applications of ES
- Challenges for ES
- Objectives of the Present Study
On the other hand, the redox reaction is the key for pseudo-capacitance between the electrode and the electrolyte. There is a layer of ions attracted to the electrode surface formed by balancing the electrode charge. 𝑊𝑊 (1.18) where Ci is the electrode capacitance (positive or negative electrode) and W is the weight (in grams) of the electrode material.
![Fig 1. 2: Schematic representation of a porous carbon electrical double layer capacitor in a charged (left) and discharged state (right) [8]](https://thumb-ap.123doks.com/thumbv2/filepdfnet/10866058.0/20.893.130.764.727.1072/schematic-representation-porous-carbon-electrical-capacitor-charged-discharged.webp)
- Pioneering Works
- Use of molecular modeling for EDLC design
- Electrolytes for EDLC applications
- MnO x based composites for supercapacitor applications
- Factors affecting the capacitance of MnO x
- Challenges for Mn oxides
- Recent developments
Since the conductivity of MnO2 is low, the specific capacitance decreases with increasing thickness of the electrode layer. Usually, the specific capacitance of a metal oxide material will increase significantly as its surface area increases [78]. However, it should be noted that the specific capacitance of the composite electrode may be compromised by the low faradaic reaction activity of the conductive supports.
Synthesis procedure
- Synthesis of GO and rGO
- Synthesis of rGO-MnO 2
Experimental Set-up
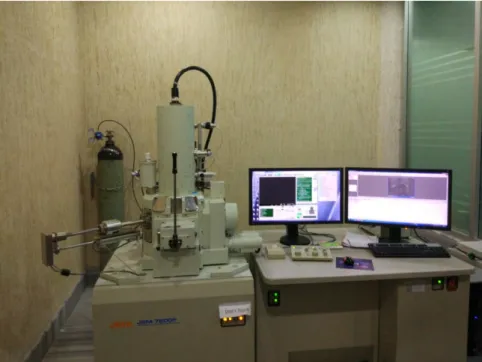
- Field Emission Scanning Electron Microscopy (FESEM)
- Energy Dispersive X-ray Spectroscopy (EDX)
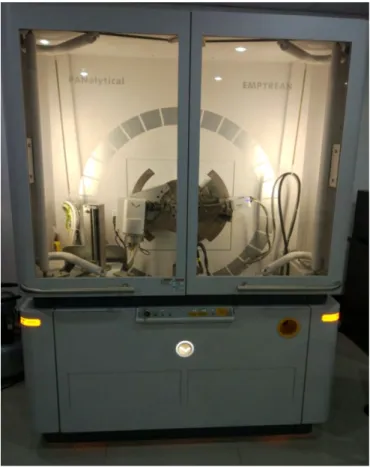
- X-Ray Diffraction Spectroscopy (XRD)
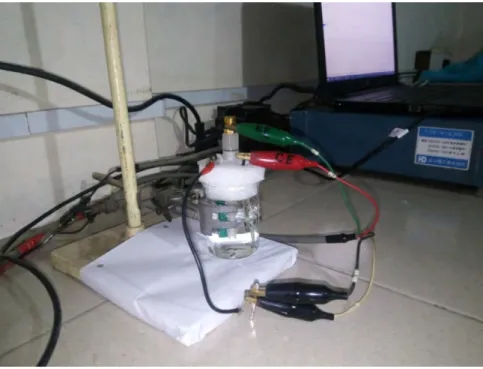
- Cyclic Voltammetry (CV)
- Chronopotentiometry (CP)
X-ray energy being characteristic of the element from which it is emitted, the identity of the elements and their relative abundance can be determined by detecting this x-ray radiation. XRD is one of the most powerful, reliable, non-destructive techniques for the qualitative and quantitative analysis of crystalline materials, in powder or solid form. Diffraction grating directions can occur with random orientation of the powder sample, all of which are achieved by scanning the sample using a range of 2θ angles.
D = kλ/ βcos𝜃𝜃 (3.2) Where D is the crystallite size, k is a shape factor which is dimensionless (typical value 0.9), l is the x-ray wavelength, β is the line broadening half way of the maximum intensity (FWHM) and θ is the Bragg angle (in degrees). One of the main advantages is that it is relatively straight forward and easy to analyze and interpret data. W hen the potential approaches a specific value that favors the reduction of the active material, current response increases rapidly leading to an anodic peak and the corresponding current and potential is called a nodal peak current. an d an odic potential.
The size of the diffusion layer and also the time it takes to record the scan can be used to rationalize this. By varying these factors, cyclic voltammetry can provide information regarding process dependence, the stability of transition metal oxidation state in the complex form, reversibility of electron transfer reactions, reactivity of active material, etc. It is an electroanalytical technique in which an intact solution of an electroactive species, in the presence of an excess of a supporting electrolyte, is electrolyzed at a programmed current density between an indicator electrode and a counter electrode and the potential -variation of the f ormore vs.
The specific capacitance of an electrochemical capacitor can be easily calculated from its potential response in CP based on the relationship -.
- Molecular Dynamics Simulation
- Molecular D ynamics S imulation: Large-scale Atomic/Molecular M assively
- Modeling the Physical System
- The Lennard-Jones Potential
- Periodic Boundary Conditions (PBC)
- Time Integration Algorithm
- Ensembles
- Particle-Particle Particle-Meshstyle (PPPM) & kspace_style command
- General Procedure of Molecular Dynamics Simulation
- Limitations of MD Simulations
- Modeling of the Simulation Domain for the present study
- Graphene Models
- Simulation Physics employed in the present study
- Simulation Time step
- Simulation Domain
- Simulation Cell
- Electrolyte solution
- Simulation Parameters employed
- Atoms
- Force Field parameters – bond coefficients
- Lennard-Jones parameters
- Surface Charge density
- Electric Potential Calculation
One of the advantages of using LAMMPS is that the code designed and used can be easily modified or extended with new functionality [109]. To test the conservation of total energy E = K+V, the kinetic energy must be estimated. This is one of the most important tests to verify that the MD simulation is running correctly.
For this purpose it is possible to keep the temperature within specified tolerances by periodic scaling of the speeds. The boundary condition for the application of PPPM is that it must be 3d and periodic in all dimensions. The only exception where the above boundary condition can be modified is slab option which must be set with kspace_modify. Because an infinite series of periodic images of the simulation domain will be created where every charge in the system interacts with charges in periodic image.
A simulation can be said to be realistic if it imitates the behavior of the real system. It must be possible to reproduce the practical behavior of the material under the conditions of the operation of the simulation. The determining factors for the number of electrolyte ions are the concentration and charge neutrality of the entire system. The number of water molecules and solvent ions (NaCl) used in our Molecular Dynamics simulation system are summarized in Table 4.3.
Bonds are defined between specified pairs of atoms by bond coefficients and remain in force for the duration of the simulation.
![Fig 4. 1: Periodic boundary conditions (The central box is outlined by a thicker line) [111]](https://thumb-ap.123doks.com/thumbv2/filepdfnet/10866058.0/64.892.296.598.264.568/fig-periodic-boundary-conditions-central-outlined-thicker-line.webp)
Experimental Analysis
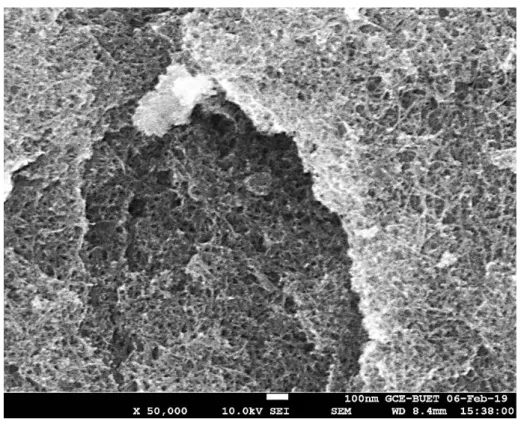
- Scanning Electron Microscope (SEM) Analysis
- Energy Dispersive X-Ray Spectroscopy (EDX) Analysis
- X-Ray Diffraction (XRD) Analysis
- Electrochemical Analysis
The surface of graphene-MnO2 nanocomposite is porous in nature which is responsible for increasing the functionality of graphene-MnO2 nanocomposite. The EDX result of the graphene-MnO2 binary composite confirms the presence of graphene C, in addition to the significant amount of Mn and O of MnO2 in the sample suggesting a MnO2. The XRD analysis of the prepared graphene-manganese oxide composite (Fig. no. 5.3) shows the weak crystalline nature of MnO2 on the graphene surface.
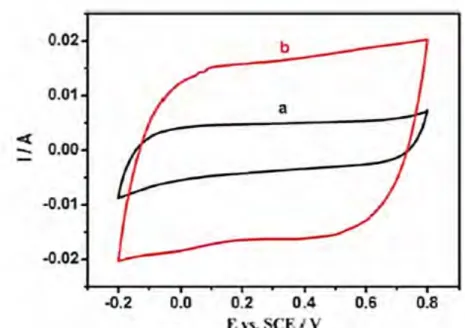
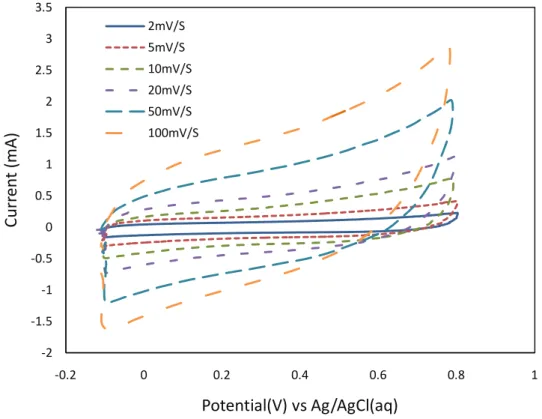
The light shift of the differences (2θ as well as peak intensity in the XRD patterns of graphene-MnO2 composite can be attributed to the effect of graphene and is the proof that MnO2 nanoparticle has been successfully incorporated on graphene skin. T he focus of these experiments was to to find out the capacitive behavior of the graphene-MnO2 nanocomposite in NaCl electrolyte.The CV curve of graphene - MnO2 nanocomposite at different scan rates is shown in Fig.
As shown in all figures of the CV curves of graphene - MnO2 at different scan speeds, the shapes of the CV curves were significantly affected by the scan speed. In other words, the decrease in capacitance value with higher current density is attributed to the constraint arising from the faster movement of electrolyte ions toward adsorption sites [126]. The supercapacitors showed significantly high specific capacitance. even at high current density. Several studies have been conducted on the graphene-MnO2 nanocomposite to understand its potential as an energy storage material.
By comparing these research projects it can be said that graphene-MnO2 supercapacitors have high potential in the energy storage sector.
Molecular Dynamics Analysis
- Validation
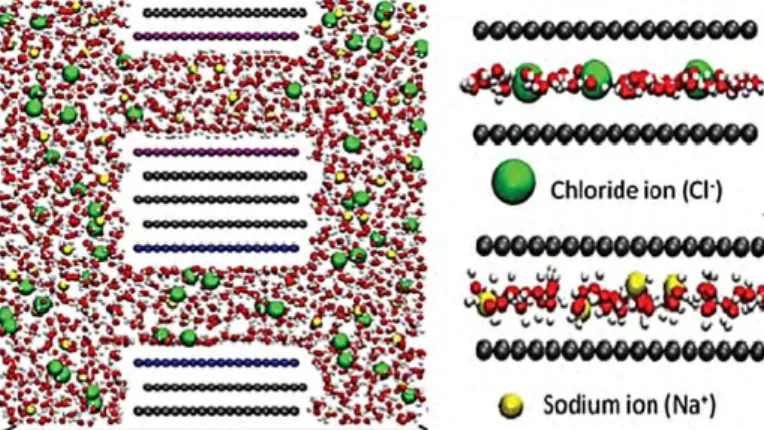
Since RDF helps to find structural changes that determine the atomic positions in crystalline and amorphous materials, the effect of surface charge on the EDLC structure has been investigated in Fig. -) increases with increase with surface charge density. The overall effect shows a decrease in potential as well as capacitance due to the increase in surface charge density for graphene-MnO2 electrodes.
The structure of electric double layer (EDL) has greatly affected by surface charge density and solution concentration shown in Fig. Uion = potential from ionic electric double layer and electrode surface charge Uwater = potential from polarized water molecules. 5.12, it can be seen that as the surface charge density increases, the potential area decreases, indicating that the total capacitance also decreases.
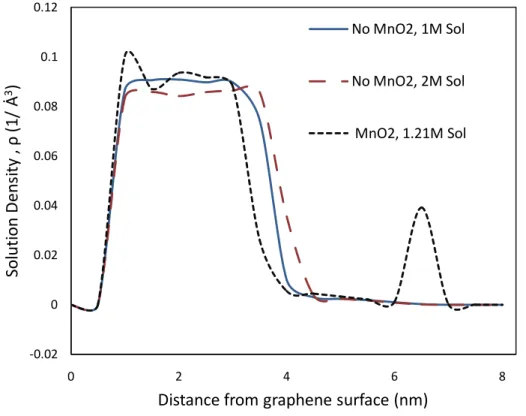
Again, as the surface charge density increases, the first density peak decreases indicating less capacity for high surface charge conditions. It can be said that as the solution density increases, the solution density shifts towards the bulk region after an optimal density range from Fig. Also, the Na+ ion density increases with the increase in the width of the carbon crack pores in the first density layer.
With the increase in density of solution, solution density shifts to the bulk region to an optimum density range.
Conclusion
The wear pore model studied in this work offers an improved design which consists of two sections. The second section consists of a raphene-MnO2 electrode surface perpendicular to the first section, which is equal to the model without wear pore (planes). Thinner EDL from electrolyte ion will give a small electrolyte potential (Uion), thus a reduction in the electrical constant that largely cancels the beneficial effect on capacitance from a thinner EDL.
The aqueous solvent also plays an important role in determining the capacitance values at the graphene-MnO2 cathodes and nodes. This is because the calculated dielectric constants of water (εwater) on the anode side are significantly lower than the results for that on the cathode. This could be understood in terms of the reorientation of water molecules in the first water layer under different electric fields.
The water molecules in the first water naturally have their O-H bonds touching the graphene-MnO2 (zero charge) surface. In general, water molecules near the junction surface are relatively harder to polarize and thus the dielectric constant is smaller. Finally, the calculated capacitance values of the graphene-MnO2 anode are lower than those of the cathodes.
Our findings clearly highlight that the inclusion gap pore using edge defects in graphene-MnO2 electrodes can dramatically improve the EDL capacity and thus the overall performance of supercapacitors.
Recommendation
23] Chuang, C.M., Huang, CW, Teng, H., and Ting, J.M., “Effects of carbon nanotube grafting on the performance of electric double-layer capacitors,” Energy Fuels, vol. 31] Kong, X., Lu, D., Liu, Z. and Wu, J., "Molecular dynamics for the charging behavior of nanostructured electric double layer capacitors containing ionic liquids at room temperature,". 36] Aparicio, S. and Atilhan, M., "Choline-Based Ionic Liquids on Graphite Surfaces and Solvation of Carbon Nanotubes: A Molecular Dynamics Study," J.
49] Wang, H., and Pilon, L., “Mesoscale modeling of electrical double-layer capacitors with three-dimensional ordered structures,” J. 50] Wang, H., Varghese, J., and Pilon, L., “Simulation of electrical double-layer capacitors with mesoporous electrodes: Effects of morphology and electrolyte permittivity." 67] Subramanian, V., Zhu, H., and We i, B., “Nanostructured M nO2: H ydrothermal synthesis and electrochemical properties as a s upercapacitor electrode material,” J .
75] Huang, Q., Wang, X., and Li, J., "Characterization and performance of electrochemically prepared manganese hydroxide and its application to supercapacitors," Electrochimica Acta, vol. 90] Li, L., Qin, Z.Y., Wang, L.F., Liu, H.J., and Zhu, M.F., “Anchoring of Alpha-Manganese Oxide Nanocrystallites in Multiwall Car Anotubes as Electrode Materials for Supercapacitor,” J. 96 ] Jiang, R., Huang, T., Liu, J., Zhuang, J., and Y u, A., “A Stepless Method to Repair Nanostructured Anganium Oxide and Its Electrochemical Properties as a Supercapacitor Electrode , ” Electrochimica Acta, vol.
123] Li, Z., Wang, J., Liu, S., Liu, X., and Yang, S., "Synthesis of Hydrothermally Reduced Graphene/MnO2 Composites and Their Inherited Electrochemical Properties as Supercapacitors," J.
![Fig 1. 3: Potential profile with distance from electrode in EDLC [10].](https://thumb-ap.123doks.com/thumbv2/filepdfnet/10866058.0/22.893.291.604.740.1090/fig-1-potential-profile-distance-electrode-edlc-10.webp)
![Fig 1. 5: Specific power versus specific energy of modern storage devices [19-20].](https://thumb-ap.123doks.com/thumbv2/filepdfnet/10866058.0/28.893.233.666.177.457/specific-power-versus-specific-energy-modern-storage-devices.webp)
![Fig 3. 5: Potential response of an ideal electrochemical capacitor in CP. [108]](https://thumb-ap.123doks.com/thumbv2/filepdfnet/10866058.0/59.892.242.659.219.433/fig-potential-response-ideal-electrochemical-capacitor-cp-108.webp)
