PLANTING GEOMETRY OF WHEAT GROWN AS PURE STAND AND INTERCROPPING WITH GRASSPEA AND LENTIL
MST. NURJAHAN KHATUN Reg. No. 04-0 1290
A Thesis
Submitted to the Faculty of Agriculture Sher-e-Bangla Agricultural University, Dhaka,
In partial fulfillment of the requirements for the degree of
MASTER OF SCIENCE IN AGRONOMY
SEMESTER: January- June, 2009 Approved by:
Prof. Dr. Md. Faziul Karim Supervisor
Associate Prof. Dr. H. M. M. Tariq Hossain Co-supervisor
Prof. Dr. Md. Faziul Karim Chairman
Examination Committee
TIqucfr7!E
This is to certify that the thesis entitled, "(PLJ4M7rwg
g01cETYocF Wi{cr GROWNAS (7UE scc JATLCROMIXG WIrJ{ çsscr
DLEW17L" submitted to the Faculty of Agriculture, Sher-e-Bangla Agricultural
University, Dhaka, in partial fulfilment of the requirements for the degree of MASTER OF SCIENCE in AGRONOMY, embodies the result of a piece ofbona fide research work carried out by MST. NURJAHAN KI-JATUN,
Registration No. 04-01290 under my supervision and guidance. No part of the thesis has been submitted for any other degree or diploma.I further certify that such help or source of information, as has been availed of during the course of this investigation has duly been acknowledged.
PL7
AGRJCUIT B&'"
Dated:3J7c7
Place: Dhaka, Bangladesh Prof. Dr. Md. Faziul Karim Supervisor
100 # W
'411J
4cOWLEWtT
)4(1iam6ullTafi, aTE praises are lue to (mTity )4122fi cRjthôu( J1Wamin for his geraciowc ljn6ness and infinitive mercy in alT the end.eavors to author to (et her
succesfutTy compCete the research wor&ani the thesis.
The author woulf likç to e.press her heartfelt gratitufe and most sincere appreciations to her Supervisor and Chairman, (Prof Or 5Wd ¶Fa.zlu( Kfl rim, Department of J4gronomy, Shier-e-(l3ang(a )1gricu[tural Vniversity, D/1ag for his valuaôlTe guitiance, ativice, immense help, encouragement and support through out the stufy. Lik,çwise grateful appreciation is conveyei to Co-S upervisor)4ssoc. (Prof q)r. 9i M. M. 'TariqJ(ossain, Department offigronomy, Slier-e-(Bang(a
14gricultural Vniversity, DTiaag for his constant encouragement, cordial suggestion, constructive critisms anti va(ua6(e ativi.ces to complete this thesis.
The author also express her Leepest respect and ôoundless gratitwie to alT the respecteti teachers of the Department of figronomy, Sfier-e-(Bang(a )4gricultural Vniversity, q)Iiaa for their co-operation, va(uaôlTà teaching and inspiration throughout the course stutiy and research work,. The author wishes to etenti her special tllan&s to £Masum, Lecturer, Department of J4gronomy, Shier-e-C8ang(a )4gricu(tural Vniversity, DIlakg; )siu.zzaman cBailu, Lecturer, Department of J4gronomy, STier-e-Bang(a i4grzcuüura[ Vniversity, <Dfiaki, for their sincere co-
operation.
The author is also thankful to 1(pngkpn, Silormi, S/ia lina for their hefp Luring experimentation. Special than,Qs to all other fhends for their support and encouragement to complete this thesis. The author isgratefulto her parents, 6rotllers and other rel2stive '.cfor their support anti encouragement and corfuzl love dtiing the stutiy.
cFina15 the author appreciates the assistance rentiereti ôy the staff of the Department of )4gronomy and )4gronomy Fiel1 La6oratoiy, Shzer-e-'Bangla )4gricuftural Vniversity, c'DIiaka who have rwlpei her Luring the penoci of
experimentation.
iv
F-7T-T f -7
ONTENTS .
CHAPTER TITLE PAGE NO.
ACKNOWLEDGEMENT iv
CONTENTS v-ix
LIST OF TABLES x-xi
LIST OF FIGURES xi
LIST OF PLATES xii
LIST OF APPENDICES xiii
ACRONYMS xiv
ABSTRACT xv
1 INTRODUCTION 1-3
2 REVIEW OF LITERATURE 4-12
3 MATERIALS AND METHODS 13-23
3.1 Location 13
3.2 Site selection 13
3.3 Climate and weather 13
3.4 Planting materials 13
3.5 Plant characteristics and variety 13
3.5.1 Wheat 13
3.5.2 Grasspea 15
3.5.3 Lentil 14
3.6 Experimental treatments 15
3.7 Experimental Design and Layout 15
3.8 Details of the field operations 16
CHAPTER TITLE PAGE NO.
3.8.1 Land preparation 16
3.8.2 Fertilizer application 16
3.8.3 Seed collection and sowing 16
3.8.4 Germination test 17
3.8.5 Weeding 17
3.8.6 Irrigation 17
3.8.7 Harvesting and sampling 17
3.9 Recording of data 18
3.9.1 Wheat 18
3.9.2 Grasspea 18
3.9.3 Lentil 18
3.10 Procedure of recording data 19
3.10.1 Wheat 19
3.10.1.1 Plantheight 19
3.10.1.2 Above ground dry matter plant' 19
3.10.1.3 Tillers plant' 19
3.10.1.4 Length of spike 19
3 10 1 5 Spikelet spike' 19
3.10.1.6 Weight of thousand grain 19
3.10.1.7 Grain yield 19
3.10.1.8 Harvest index 20
3.10.2 Grasspea and lentil 20
vi
CHAPTER TITLE PAGE NO.
3.10.2.1 Plantheight 20
3.10.2.2 Above ground dry matter planf' 20
3.10.2.3 Branches planf' 20
3.10.2.4 Pods planf1 20
3.10.2.5 Weight of thousand seeds 20
3.10.2.6 Seed yield 20
3.10.2.7 Harvest mdcx 21
3.11 Relative yield and land equivalent ratio 21
3.12 Equivalent yield 22
3.13 Monetary advantage 23
3.14 Economic analysis 23
3.15 Benefit cost ratio 23
3.16 Statistical analysis 23
4 RESULTS AND DISCUSSION 24-57
4.1 Wheat 24
4.1.1 Growth attributes of wheat 24
4.1.1.1 Plantheight 24
4.1.1.2 Above ground dry matter planf 27
4.1.1.3 Tillers planf' 29
4.1.2 Yield attributes of wheat 31
4.1.2.1 Length of spike 31
4.1.2.2 Spikelet spiked 33
CHAPTER - TITLE PAGE NO.
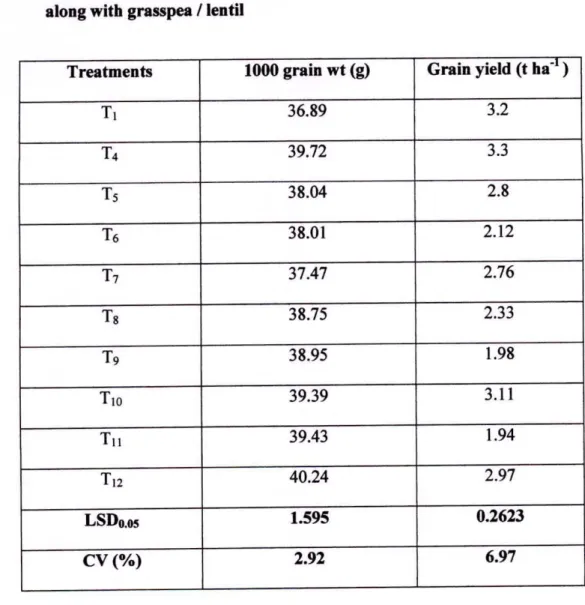
4.1.2.3 Thousand grain weight 35
4.1.2.4 Grain yield 35
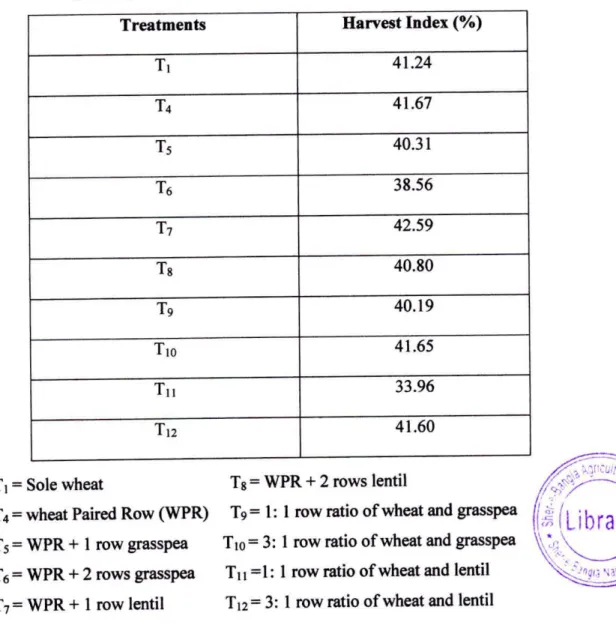
4.1.3 Harvest index 37
4.2 Grasspea 38
4.2.1 Growth attributes of grasspea 38
4.2.1.1 Plant height 38
4.2.1.2 Above ground dry matter plant 40
4.2.1.3 Branches planf' 41
4.2.2 Yield and yield attributes 42
4.2.2.1 Pods planf' 42
4.2.2.2 Thousand seed weight 42
4.2.2.3 Seed yield 42
4.2.3 Harvest index 42
4.3 Lentil 44
4.3.1 Growth attributes of lentil 44
4.3.1.1 Plant height 44
4.3.1.2 Above ground dry matter plant' 46
4.3.1.3 Branches plant' 47
4.3.2 Yield and yield attributes 48
4.3.2.1 Pods plant' 48
4.3.2.2 Thousand seed weight 48
4.3.2.3 Seed yield 48
(Lihrary))
viii
CHAPTER TITLE PAGE NO.
4.3.3 Harvest index 48
4.4 Productivity performance 50
4.4.1 Relative yield 50
4.4.1.1 Relative yield of wheat 50
4.4.1.2 Relative yield of grasspea 50
4.4.1.3 Relative yield of lentil 50
4.5 Combined yield of wheat and grasspeallentil 50
4.6 Land equivalent ratio 51
4.7 Equivalent yield 53
4.7.1 Wheat equivalent yield 53
4.7.2 Grasspea equivalent yield 53
4.7.3 Lentil equivalent yield 53
4.8 Economic performance 55
4.8.1 Total variable cost 55
4.8.2 Gross return 55
4.8.3 Net return 55
4.8.4 Monetary advantage 55
4.9 Benefit cost ratio 56
5 SUMMARY AND CONCLUSION 58-60
REFERENCES 61-70
APPENDICES 71-87
(L ihrary)
LIST OF TABLES
TABLE TITLE PAGE
NO.
I Dry matter accumulation of wheat at different days 28 as influenced by different intercropping systems
along with grasspea / lentil
2 Number of tillers plant' of wheat at different days 30 under different intercropping systems
3 Spike length of wheat at different days as influenced 32 by different intercropping systems along with grass
pea / lentil
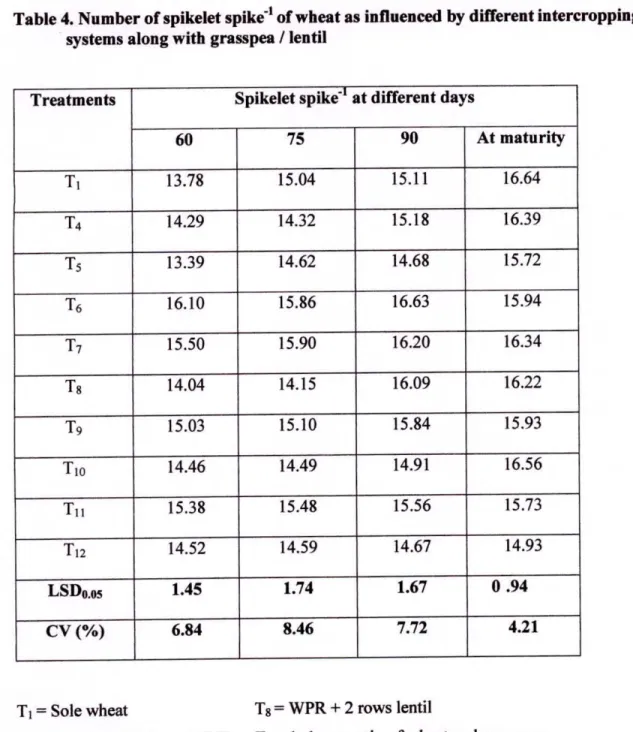
4 Number of spikelet spik&' of wheat as influenced by 34 different intercropping systems along with grass pea
/ lentil
5 Grain yield of wheat as influenced by different 36 intercropping systems along with grass pea / lentil
6 Harvest Index of wheat as influenced by different 37 intercropping systems along with grass pea / lentil
7 Above ground dry matter of grasspea at different 40 days as affected by different intercropping systems
with wheat
8 Number of branches planf' of grasspea at different 41 days as affected by different intercropping systems
with wheat
9 Pods plant' , 1000 seed weight, Seed yield and 43 harvest index of grasspea as influenced by different
intercropping system
10 Above ground dry matter of lentil at different days as 46 affected by different intercropping systems
11 Number of branches plani' of lentil at different days 47 as affected by different intercropping systems
x
TABLE TITLE PAGE NO.
12 Yield attributes, yield and harvest index of lentil as 49 influenced by different intercropping systems with
wheat
13 Productivity performance of wheat as sole and grown 52 along with grasspea and lentil under different
intercropping systems
14 Equivalent yield of wheat, equivalent yield of grass 54 pea and equivalent yield of lentil as affected by
different intercropping systems
15 Economic analysis of wheat and grass pea /lentil 57 under different intercropping systems
LIST OF FIGURES
FIGURE TITLE PAGE
NO.
1 Plant height of wheat at different days under different 26 intercropping systems
2 Height of grasspea at different days as affected by 39 different intercropping systems with wheat
3 Height of lentil at different days as affected by 45 different intercropping systems with wheat
(LihraryH
I
LIST OF PLATES
PLATE TITLE PAGE
NO.
1 Field showing normal row planting of wheat at 73 vegetative and grain filling stages
2 Field showing paired rows planting of wheat at 73 vegetative and grain filling stages
3 Field showing paired rows of wheat + I row grasspea 74 at vegetative and grain filling stages
4 Field showing 3:1 row ratio of wheat & grasspea at 74 vegetative and grain filling stages
xl'
LIST OF APPENDICES
APPENDIX TITLE PAGE NO.
I Map showing the experimental site Under study 71
II Layout of Treatments arrangement 72
III
ANOVA
for plant height of wheat 75 IVANOVA
for drymatter of wheat 76 VANOVA
for number of tillers plant-] of wheat 77 VIANOVA
for length of spike of wheat 78 VIIANOVA
for spikelet spik&', 1000 grain weight and 79yield of wheat
VIII
ANOVA
for plant height of grasspea 80IX
ANOVA
for drymatter of grasspea 81 XANOVA
for number of branches plant" of grasspea 82 XIANOVA
for number of pods plant- , 1000 seed weight 83and yield of grasspea
XII ANOVA
for plant height of lentil 84XIII ANOVA
for drymatter of lentil 85XIV ANOVA
for number of branches plant-' of lentil 86XV ANOVA
for number of pods plant-', 1000 seed weight 87 and yield of lentilACRONYMS
AEZ = Agro- Ecological Zone
BBS Bangladesh Bureau of Statistics
BARI = Bangladesh Agricultural Research Institute
BCR = Benefit Cost Ratio
cm Centi-meter
cv. Cultivar (s)
CV (%) = Percentage of Coefficient of Variance
Oc = Degree Centigrade
DAS = Days After Sowing
et al.
= And othersetc. = Etcetera
FAO = Food and Agricultural Organization
g = gram(s)
ha = hectare
HI = Harvest Index
Hr = hour(s)
kg = Kilogram
LER = Land Equivalent Ratio
LSD = Least Significant Difference
m = meter
mm = millimeter
MP = Muriate of Potash
m2 = Square meter
N = Nitrogen
No. = Number
NR = Normal Row
NS = Not significant
PR = Paired Row
SAU = Sher-e-Bangla Agricultural University
t ha' Tons per hectare
TSP Tripple Super Phosphate
UNDP = United Nations Development Program
var, = Variety
WPR = Wheat Paired Row
% = Percentage
xiv
PLANTING GEOMETRY OF WHEAT GROWN AS PURE STAND AND INTERCROPPING WITH GRASSPEA AND LENTIL
ABSTRACT
An experiment was conducted at the Agronomy field of Sher-e-Bangla Agricultural University, Dhaka, during November 2008 to March 2009 to evaluate the effect of planting geometry of wheat grown as pure stand and intercropping with grasspea and lentil on the productivity and economic performance of intercropping systems. The experiment consisted of twelve treatments (Ti = Sole wheat, T2 = Sole grasspea, T3 = Sole lentil, T4 = Wheat Paired Row (WPR), T5 = WPR + 1 Row grasspea, T6 = WPR + 2 Rows grasspea, 17 = WPR + 1 Row lentil, T8 = WPR + 2 Rows lentil, T9 = 1:1 row ratio of wheat and grasspea, T10 = 3:1 row ratio of wheat and grasspea, T11 = 1:1 row ratio of wheat and lentil, T12 = 3:1 row ratio of wheat and lentil), which were laid out in a RCB design with three replications. Results revealed that, planting geometry had significant effect on plant height, tillers planf', above ground dry matter planf', length of spike, spikelet spike 1, 1000 grain weight, grain yield and harvest index of wheat. Planting geometry also significantly changed plant height, branches plant", above ground dry matter plant-', 1000 seed weight, seed yield (t ha') and harvest index of grasspea and lentil. The results showed that, planting pattern of one row grasspea fitted in between two paired rows of wheat (T5) gave the highest wheat equivalent yield (4.31 t ha'), LER (1.38), monetary advantage (Tk. 13423.91 had ), gross return (Tk.72369 hi' ),.net return (1k. 30126 had) and BCR (1.71). The second highest BCR (1.70) and LER (1.19) were noted from To treatment (3:1 row ratio of wheat & grasspea). In this intercropping system grasspea showed better compatibility than lentil when intercropped with wheat.
Chapter 1
Introduction
4 "R
Chapter 1 INTRODUCTION
Wheat (Triticum aestivum L) is one of the most important staple food crops of the world, occupying 17% (one sixth) of crop acreage worldwide, feeding about 40%
(nearly half) of the world population and providing 20% (one fifth) of total food calories and protein in human nutrition (Gupta et al., 2008).
Rice alone cannot fulfil the cereal demand. Wheat is the second important cereal crop in Bangladesh. Therefore, efforts are being made to increase the production of wheat.
The total land acreage of wheat in Bangladesh was 0.39 million ha and the total production was 0.84 million metric tones with an average yield of 2.15 t ha' in 2007- 08 (BBS, 2008).
Wheat contains plenty of proteins (12.6%), vitamins and minerals. As a second cereal crop, its importance is high in Bangladesh and increasing day by day. In Bangladesh, wheat is grown in upland condition during the rainfed season (November- March).
The monthly maximum and minimum temperature during this period ranges from 25.8 to 30.5°C and 13.8 to 20.3°C in the south east zone and from 24.9 to 32.3°C and 10.3 to 16.7°C in the north east zone respectively (Hossain et al., 2001).
In Bangladesh, various types of pulses are grown. Among them grasspea, lentil, mungbean, blackgram, fieldpea and chickpea are important. Only grasspea, lentil, blackgram and chickpea contribute more than 75% of the total production of pulses.
According to FAO (1999) recommendation a minimum intake of pulse should be 80 g day'head'. In Bangladesh it is approximately 12 g day'. This is because that our national production of pulses is not adequate to meet up our demand.
Grasspea (Lathyrus sativus) is popularly known as khesari, chickling pea, Indian vetch etc. The grasspea seeds are boiled and consumed as pulse and can be used in dhal preparation and bread making. It can be used in making local beverage. Leaves can be used as a pot-herb and can be consumed as vegetable after boiling. Seeds are dehusked and parched before use (Kay, 1979).
Germination of grasspea seeds enhances content of vitamins, especially folic acid, biotin and pyridoxine. The seeds contain 1.5% sucrose, 6.8% pentanose, 3.6% phytin,
1.5% lignin, 6,69%albumin, 13.3% globulin and 3.8% glutenin (Duke, 1981;
Williams et al., 1994).
The total land acreage of grasspea in Bangladesh was 15.92 thousand ha and the total production was 13.42 thousand metric tones with an average yield of 1.19 t ha' in 2003-2004 (BBS, 2005). Seed yield of grasspea crops ranges from 0.9-1.5 t ha-' while crops sown from inoculated seeds yielded up to 2 t ha' in USA (Kay, 1979; Duke, 1981).
Lentil (Lens culinaris Medik) is the most important pulse in Bangladesh. Lentil is an excellent source of vitamin A, vitamin B, potassium, iron and provides fiber. Its protein content ranges from 22 to 35%. It is an excellent supplement to cereal grain diet because of its good protein / carbohydrate content. It is used in soups, stews, casseroles and salad dishes. Lentil can be used as green manure crop and Indian head variety provides a large amount of fixed nitrogen estimated to be 20 lb/acre (Oplinger et al., 1990). However, lentils must be teamed with a grain, such as rice, pasta or barley, to compete and enhance their protein availability to the body. Unlike meat, poultry, fish and eggs, the protein of lentil contains no cholesterol and virtually no fat.
The total acreage of lentil in Bangladesh was 68.83 thousand ha and the total production was 72 thousand metric tones with an average yield of 0.96 t ha-' (BBS, 2008).
lntercropping is the system where two or more crops grown simultaneously in the same land at the same time. Crop production can be intensified through intercropping (Zandstra, 1979). In the tropical and sub-tropical regions, cereal-legumes intercropping are the most popular practices because of its many additional advantages (Okigbo and Greenland, 1979). Intercropping is not only a means of augmentation of crop production and monetary returns over space and time but also provides insurance against total crop failure and / or provides better avenues of employment for the rural folk (Bandyopadhyay, 1984). Though cereal-legumes intercropping have many advantages but all crop combinations are not equally profitable (Mandal and Mahapatra, 1990; Shah et al. 1991).
Instead of uniform row, paired row planting of cereal is an advantageous management which ultimately improves the gross return by fitting legume crops between the wider spaces of paired cereal crop. Singh (1979) observed that sorghum gave maximum
2
yield and monetary advantage when grown between paired rows of maize. He reported that component crops being grown in wider spaces of paired row system enable the plants to utilize efficiently the soil nutrients and solar radiation. Karim et al. (1990) reported that the monetary advantage from groundnut cultivation between paired rows of maize.
Pulse is a rabi crop. During rabi season our farmers are interested to grow boro rice, wheat and maize as their yield is higher than pulse. Pulses have been pushed down to the marginal land due to the increased area of boro rice, wheat and maize. Thus, we obtain poor yield from pulse crops as such the market price of pulse is increasing day by day because it is being imported from abroad. It is very urgent to improve pulse yield with high yielding variety cultivating on the main land. The only way is to bring back pulse on the main land through intercropping pulse with cereal crop. From the above reality, so the experiment was initiated with following objectives:
i) To determine the planting system / pattern and total yield of wheat + grasspea / lentil under intercropping systems.
To assess the compatibility between wheat and grasspea / lentil as intercropping combination.
To assess the economic validity of wheat & grasspea / lentil intercropping system.
Chapter 2
Review of Literature
Chapter 2
REVIEW OF LITERATURE
Intercropping has many advantages for the farmers. It increases total production, acts as insurance against failure of the principal crop and better utilization of interspaces in crops. It reduces the cost of intercultural operation and increase the fertility of the soil.
It gives higher land equivalent ratio and higher equivalent yield. Some of the research works relating to this experiment have been reviewed in this chapter.
Raheja (1954) reported that in Madhya Pradesh in India a mixture of wheat and gram in proportion of 2:1 was found to give the highest net return than other seeding ratios.
Evans (1960) and Kurate (1966) indicated that intercropping was a useful practice as it often gave higher returns and total production than growing one crop alone.
Ram et al. (1963) reported that intercropping was found to be helpful in soil moisture conservations, proper utilization of labors and natural resources and solving the unemployment problems of the developing countries.
Agboola and Fayemi (1971) reported that through a number of studies, it was revealed that intercropping covered the risk of crop failure, earned more profit, stabilized production, increased soil fertility and conserved soil moisture. It also increased the total yield and returns in terms of unit land area.
Saxena (1972) reported that crops of varying maturity needed to be chosen so that a quick maturing crop completes its life cycle before the grand period of growth of the other crop starts.
Andrews (1972) reported that intercropping was found to be helpful to improve nutritional quality of diet allowed better control of weeds, decreased the incidence of insect pests, increased land equivalent ratio, reduced soil erosion and helped in the better use of sunlight and water.
Andrews (1972) reported that the higher was the LER, the more was the agronomic benefit from intercropping. The LER might be increased up to 2 by adopting intercropping.
IRRI (1973) conducted an experiment and observed that it made better use of sunlight, land and water. It might have some beneficial effects on pest and disease problems. In almost all cases, it gave higher total production; monetary returns and greater resources use efficiently and increase the land productivity by almost 60 percent.
Andrews and Kassam (1976) concluded that the degree of spatial and temporal overlap in the two crops can vary somewhat, but both requirements must be met for a cropping system to be an intercrop. Numerous types of intercropping, all of which vary the temporal and spatial mixture to some degree, have been identified.
Dairymple (1976) indicated that net returns per unit area and return per unit time of work were increased by increasing cropping index even up to 300 following the intercropping technique.
Hasanuzzaman (1976) concluded that with increased production of wheat and its acreage in Bangladesh, crop combination like wheat and potato; Tobacco and wheat;
Mustard and wheat; Flax and wheat, legume and wheat, etc. were shown to be encouraging.
Krarntz et al. (1976) observed that mixed / intercropping legume and non- legume covered risk, earned more profit and stabilized production, improved soil fertility, conserved moisture and facilitated efficient labor distribution.
Trenbath (1976) reported that the main advantage of using legumes in intercropping and mixed cropping was found to be the saving of nitrogen fertilizer.
Hoque et al. (1978) working on mixed cropping of wheat - lentil and gram - mustard at various seed ratios found that wheat - gram gave the best production per unit area with 50 100 or 50 : 50 wheat - gram combinations giving about 50% increase in production.
The farmers followed different types of intercropping and mixed cropping. The common mixture comprised of a dwarf and tall type of a legume and a non-legume.
Grasspea is popular choice of the farmers for mixed cropping with cereals and oil seeds such as wheat, barley, grain sorghum. Mustard, linseed or safflower (Agrikar, 1979).
Rathore et al. (1980) observed in maize + blackgram intercropping system that paired planting of maize at 30/60 cm using the inter paired space for growing blackgram, significantly increased the production and income compared with standard method of planting of maize at 60 cm row spacing.
Razzaque (1980) conducted an experiment on wheat, gram, lentil and mustard and showed that the combinations of wheat with mustard and gram were quite compatible producing 19 and 11 percent, respectively more yield than those under monocrops.
Singh (1979) observed that sorghum gave maximum yield and monetary advantages when grown between paired rows of maize. He reported that components crops being grown in wider spaces of paired row system enable the plants to utilize efficiently the soil nutrients and solar radiation.
Singh (1981) reported that the intercropping of wheat with chickpea, lentil or grasspea under adequate moisture conditions did not give higher total grain and dry matter production but was more profitable. Total monetary return was higher than sole crop and LER was greater than monocrop.
Waghmare et al. (1982) reported that legume might benefit in association with non- legume crops.
Sharma et al. (1982) stated that LER measures the crop productivity of a unit area covered by a crop mixture vis-ã-vis that of the sole component.
Singh (1983) reported that maximum benefit occurs when component crops are sown n wider row spaces for the tall crop component without reducing its plant population.
Such spatial arrangement augments the utilization of available space, soil nutrients and solar radiation for the companion crops. Therefore technique of "paired row"
planting has been developed to harness the maximum advantage from an intercropping system.
Singh and Singh (1983) conducted an experiment and found that highest land equivalent ratio (1.27) was recorded in wheat and gram intercropping system followed by wheat + pea (1.19) and wheat + lentil (1.10).
Gupta and Sharma (1984) reported that sorghum in paired rows of 30 + 60 cm did not reduce yield when compared to that from uniform rows of 45 cm and in addition a yield of 2.11 t ha was obtained from pigeonpea resulting anincrease in LER by 1.26.
Natarjan and Willey (1985) reported that the yield advantages of intercropping due to better and over all use of resources by the companion crop.
Natarajan and Willey (1985) and Fawusi et al. (1982) pointed out that the LER value was influenced by many factors like density, competitive abilities, morphology, and growth duration and management etc.
Manson et al. (1986) stated that intercropping did not always increase the total yield.
Sometimes it reduced the yield. Cassava yields were reduced by 2.3 to 4.7 t h&' when intercropped with cowpea or peanut.
Quayyum et al. (1987) conducted an experiment on intercropping maize at row distances of 75, 100 and 125 cm with one, two and three rows of chickpea between maize rows. Two years data revealed intercropping of maize grown at a spacing of 75 x 25 cm with two rows of chickpea produced the highest total maize equivalent yield of 5590 kg hi1. This was 22% higher than the yield of sole crop of maize. Two combined, maize + chickpea, yield gave the highest net return of Tk. 12803 hi' and highest LER of 1.35 indicating that the mixture was 35% more efficient in terms of land utilization than sole crop of maize.
Palaniappan (1988) described that if the LER was equal to or less than one, it was considered to have no advantage of intercropping over monoculture in term of production. But if LER was more than one under intercropping was considered to have agronomic advantage over monoculture practice.
Singh et al. (1988) reported that combined yield of maize + legume was higher both at 1:1 and 1:2 rows than monoculture of maize. It was possibly due to increased yield of maize in addition to bonus yield of legumes.
Hiremath et al. (1989) conducted an experiment and reported that wheat grain yield was not affected by intercropping with soybean at 1:1 to 4:3 row ratios; however, soybean seed yield was reduced about 0.58 t ha' when intercropped. The highest land equivalent ratio (1.33) was obtained from intercropping wheat and soybean in a 1:2 row ratio and gross return from 3:1 row ratio.
Karim et al. (1990) conducted an experiment to study the effect of planting system of maize with rows of groundnut grown as mono and / or intercrop. Maximum grain yield of maize (2.96 t hi') was obtained from monoculture in uniform row which was identical to maize uniform row, with two or three rows of groundnut. Higher maize
VA
and wheat equivalent yield was found in uniform 3 or paired 6 rows of groundnut.
Both the former and later combination gave higher LER (1.44) and net return of Tk.
8719 and 8502 ha', having same benefit cost ratio.
Patra et al. (1990) reported that the association of soybean gave the highest combined yield at both 1:1 and 1:2 row ratios, whereas the association between maize and sesame recorded the lowest combined yield due to severe competition.
Dhingra et al. (1991) conducted an intercropping experiment with maize and mungbean under different planting patterns and row orientation where higher maize yield was obtained from intercropping system. This increase in maize yield was attributed to the complementary effect of mungbean in terms of biological nitrogen fixation.
Atar et aL (1992) conducted a field experiment at New Delhi with wheat based intercropping system. They reported that intercropping system ensured highest water use efficiency.
Nag et al. (1992) reported that monoculture of maize, cowpea, khesari, mungbean, groundnut and maize intercropped with legumes in paired rows were compared in an experiment conducted during 1993-94, highest maize equivalent yield (6973 kg hi') was obtained from maize + mungbean intercropping, but maize + groundnut combination gave highest maize equivalent yield (5615 kg hi') in 1994-95. Maize + mungbean and maize + groundnut also gave highest net return (Tk. 50952 hi' and Tk.
40245 hi') during 1993-94 and 1994-95, respectively. On an average maize + cowpea and maize + khesari combination gave the highest benefit cost ratio (5.34 and 5.32) and land equivalent ratio (1.35).
Singh et al. (1992) stated that the monetary advantage evaluated over sole wheat indicated a positive gain from intercropping system. Maximum monetary advantage was recorded from wheat + grass pea in 3:1 row ratio followed by the same crops with 1:1 row ratio. Sole crops failed to give maximum net return. It appeared that wheat, mustard and grass pea was less benefited under sole cropping. Wheat when grown with grass pea gave 24 to 46% higher monetary advantages over sole wheat.
Shafi et al. (1993) stated that wheat grain yield was 2.47 t hi' in the pure stand and 1.62, 1.81 and 2.14 t hi' when intercropped in 2, 3 or 4 row strips, respectively with safflower. Safilower seed yield was 0.34 t hi' in the pure stand and 0.03 - 0.08 t ha'
when intercropped. Cost - benefit ratio was highest from the intercrop using strips of 3 rows of the each crop.
Alteieri (1994) reported that intercropping of compatible plants also encourages biodiversity, by providing a habitat for a variety of insects and soil organisms that would not be present in a single intercrop environment. This biodiversity can in turn help to limit outbreaks of crop pests.
Nazir et al. (1994) conducted an experiment and found that in monetary term, both the wheat - fenugreek and wheat - lentil intercropping systems proved to be more beneficial than the other cropping systems including monocropped wheat.
Banik (1994) carried out an experiment to evaluate wheat and legume intercropping under 1:1 and 2:1 row ratios and found that the wheat peas intercropping (1:1) gave the highest wheat yield equivalent of 3.02 t ha followed by the wheat - lentil intercropping (2.91) which also gave the highest monetary returns.
Carr et al. (1995) reported that LER value was 1.15 for sole cropping while they had an experiment of wheat-lentil intercropping.
Singh and Sarawgi (1995) conducted an experiment on the effect of row ratio, nitrogen and irrigation in wheat-chickpea intercropping system with row ratios of 2:1 2:2. The best intercropped treatment was where the crops were grown in using the row ratio of 2:1.
Verma et al. (1997) conducted a field trial in winter seasons that was carried out with wheat and lentils grown alone or intercropped in a 4: 2 row ratio. The wheat in pure stand was given 80 kg N + 16kg P + 16 kgha (100% NPK), while sole lentil received 20 kg N + 16 kg P ha' (100% NP). Intercrops were given 8 different combinations of fertilizers. Wheat grain yield was 3.29 t hi' in pure stand and 2.73 - 3.12 t ha7l when intercropped. Lentil seed yield was 1.53 t hi' in pure stand and 0.22 - 0.41 t hi' when intercropped. The highest wheat-equivalent yield and net returns were obtained when wheat with 100% NPK and intercropped with lentils fertilized with 75% NP.
Alam et al. (1997) conducted an experiment and stated that wheat + chickpea, wheat + lentils and wheat + peas reduced the total weed population by 26, 12 and 28% and weed biomass by 31, 13 and 27% respectively, compared to the wheat monoculture.
01
Tomar et al. (1997) conducted a field trial on sandy loam soil in winter seasons where wheat was grown alone or intercropped with Lens cu/mans and Cicer anietinum in 2:
2 or 3: 2 row ratios. Seed yields of all crops were decreased by intercropping. Total plant N content was highest in Lens cu/mans grown alone increasing N fertilizer rate (0 - 90 kg N hi') increased wheat grain yield but did not generally affect legume seed yields.
Markunder et al. (1997) found that the mixed cropping or intercropping of wheat with lentil increased the productivity per unit area compared to sole cropping of wheat or lentil.
Dwivedi (1998) found that all intercropping systems had higher total yield and net returns than pure stands. Higher equivalent yields were obtained with intercropping.
The land equivalent ratio (LER) values were found to be greater than unity. It was also reported that practicing wheat and pulse intercropping reduced the total weed population significantly compared to the wheat monoculture.
Ahmed and Saeed (1998) conducted an experiment on wheat and lentil intercropping at row ratios of 4: 3, 5:3, 8:3 or 10:3. Wheat grain yield was highest (4040 kg hi') with the 10:3 row ratios. This treatment produced lentil seed yield of 441 kg hi'. The second highest yield was obtained form 8:3 ratio whereas wheat was 3760 kg and lentil was 481 kg hi'.
Malik et al. (1998) conducted a field trial with wheat grown alone or intercropped with lentils, gram or rape. Grain yield of wheat was decreased by 371, 420 and 388 kg hi' with intercropping of lentil, gram and rape, respectively. However, losses in wheat yield were compensated by increased income from the intercrops. The highest net income with a benefit - cost ratio (2.75) was obtained from wheat - lentil intercropping compared with a BCR of 2.35 for wheat alone.
Ahmed et al. (1998) conducted a field experiment in Pakistan. Wheat and lentil were grown alone or intercropped in 80 cm X 100 cm strips or wheat: lentil row ratios of 4:3, 5:3, 8:3 or 10:3. Wheat grain yield was highest (4040 kg hi') with the 10:3 intercrop. This treatment produced lentil seed yield of 424 kg hi'. The 8:3 intercrop produced wheat grain yield of 3760 kg and lentil seed yield of 481 kg and the highest net return, which was only slightly higher than the returns obtained with the 10: 3 intercrop.
Rahman (1999) stated that intercropping of grass pea and yellow sarson with wheat was sustainable over sole wheat. The association of wheat with grass pea under either 3:1 or 1:1 was more sustainable, which accounted for better value with respect to biological parameters and was economically more remunerative.
Rahman (1999) and Miah (1982) examined that wheat and grasspea intercropping proved as sustainable over sole crop.
Thakur et al. (2000) demonstrated that chickpea + safflower intercropping in 3:1 and 6:2 row ratios were superior to pure stands of either crop components and to chickpea + mustard and chockpea + linseed.
Ashok et al. (2001) evaluated an experiment at New Dethi. They found that number of tillers per plant of wheat was not significantly affected by wheat based intercropping system.
Ghanbari and Lee (2002) reported that significant effect on spike length of wheat was found with intercropping system. They reported that proper fertilization under intercropping system increased spike length of wheat.
Nargis and Krishna (2003) conducted an experiment and observed that weed was significantly controlled by wheat + sunflower and wheat + linseed at 3:1 and 3:1 row ratios, respectively.
Nargis et al. (2004) evaluated an experiment on mixed cropping of lentil (100%) and wheat (20, 40, 60 or 80%). It was observed that in lentil, 100% lentil + 40% wheat gave the highest number of branches per plant (3.25), whereas 100% lentil + 60%
wheat recorded the greatest plant height (35.70 cm). The highest number of seeds per plant (47) and seed yield (1278 kg ha) of lentil were obtained under line sowing.
Sole wheat (broadcast) produced the tallest plants (89.15 cm) and the longest spikes (9.84 cm). The highest land equivalent ratio (1.52), monetary advantage and benefit:
cost ratios (1.84) were recorded for intercropping lentil (100%) and wheat (40%).
They also reported that the highest seed yield (2704 kg ha) was obtained under line sowing of sole wheat. The variation in the number of effective tillers per plant and number of seeds per plant was not significant. In both crops, line sowing was superior over broadcasting. The higher land equivalent ratio indicated that mixed cropping or intercropping increased the productivity per unit area compared to sole cropping of lentil.
11
Islam (2006) conducted a study and reported that yields of wheat (3.00 - 3.08 t h&) were obtained with wheat 100% + grasspea 20% + fertilizer 100% and wheat 100% + grasspea 100% + fertilizer 120% treatments. Highest fodder yield (1.47 t had) was obtained with the treatment of wheat 100% + grasspea 100% + fertilizer 120%. The best land equivalent ratio (LER), benefit-cost ratio (BCR) and total net return were 1.96, 1.558 and 14466.50 Tk. ha' respectively and these were obtained with the treatment of wheat 100% + grasspea 100% + fertilizer 120%.
UlIah (2007) reported that higher combined yield, net return, BCR and LER over sole wheat when broadcasted chickpea in between two paired rows of wheat.
Sultana (2007) reported that the highest LER, combined yield, net return and BCR was obtained while wheat + grasspea cultivated under mixed cropping systems.
Hossain et al. (2010) calculated higher net return (Tk. 14452 ha') and benefit cost ratio (3.06) where they maintain two rows of wheat alternate with one row chickpea with 40-30-20 N, P205, K20 Kg ha-i, respectively in a wheat + chickpea intercropping experiment.
They also reported that, two rows wheat alternate with one row chickpea (i.e. 80W:
60C) gave highest land equivalent ratio(1 .29), wheat equivalent yield (3.13 t had), net return (Tk. 164330 ha) and benefit cost ratio (4.13) followed by that of 3 : 2 combination (i.e. 60W : 60C) in another intercropping experiment.
They also showed that highest wheat equivalent yield (2.46 t ha'), net return (Tk.
14976 hi') and benefit cost ratio (2.64) was recorded from two rows of wheat alternate with one row chickpea.
The foregoing review made it clear about the intercropping system for its advantage in regards of land use, greater yield, monetary benefit etc. The paired row wheat in combination with pulse like grasspea or lentil plays an important role to use land in economic way for greater yield and monetary advantages.
Chapter 3
ONMaterials and Methods
Chapter 3
MATERIAL AND METHODS
3.1 Location
The Experiment was conducted at the research farm of Sher-e-Bangla Agricultural University (SAU), Dhaka during the period from November 2008 to March 2009.
3.2 Site selection
The experimental field was located at 900 22' E longitude and 230 41' N latitude at an altitude of 8.6 meters above the sea level. The land was located at 28 Agro ecological zone (AEZ 28) of "Madhupur Tract" (Appendix I). It was deep red brown terrace soil and belongs to "Nodda" cultivated series. The soil was clay loam in texture having PH ranges from 5.47 to 5.63. Organic matter content was very low (0.82%).
3.3 Climate and weather
The climate is subtropical with low temperature and minimum rainfall during December to March was the main feature of the rabi season.
3.4 Planting materials
Three types of crops having dissimilar growth habits have been used in this experiment. The crops were wheat (Triticum aestivum), grasspea (Lathyrus sativus) and lentil (Lens culinaris). In this experiment wheat was grown as main crop and grasspea and lentil were grown as companion crop.
3.5 Plant characteristics and variety 3.5.1 Wheat
BARI gom- 19 (Shourav) is a high yielding variety of wheat. The variety was released by WRC (Wheat Research Centre) of BARI in 1998. This variety is suitable for late sowing. It completes its life cycle within 102-110 days. The height of the plant is 90- 100 cm. It produces 5-6 tillers planf'. The stem is hard enough and does not lodge in wind and storm. Leaves are flat, droopy and deep green. Flag leaf is wide and droopy in nature. The number of spikelet spike' is 42 - 48 and size of grains are medium to large and the color of the grains is white. The weight of 1000 seed is 40-45 g. Plant
requires 60-70 days to emerge spike. It has ability to give 3.54.6 t hi' in favorable condition. This variety is tolerant to leaf spot and leaf rust diseases. This variety is heat tolerant that is why in case of late sowing it gives better yield. The variety gives 10-12% more yield than the traditional variety (BAR!, 2005).
3.5.2 Grasspea
A high yielding grasspea variety namely BAR! khesari-2 was selected as planting material. This variety was released by BAR! in 1996 .The height of the plant is 55-60 cm. The leaf is broader than the local variety and color of the flower is blue. The size of the seed is slightly larger and weight of 1000 seed is 50-55 g. The color of the seed is slightly grey. Seed contains about 24-26% protein. It requires 125-130 days from sowing to maturing / ripening. The average yield of this variety is 1.5-1 t ha(BAffl, 2005).
3.53 Lentil
BAR! masur-4 is a high yielding variety of lentil. This variety was released by BAR!
in 1 996.The height of the plant is 40 cm light green in color .The size of the leaflet is large and there is a hook at the tip of the leaf. The color of the flower is violet. The size of the seed is larger than the local variety and is more flat. The color of the seed is reddish brown and weight of 1000 seed is 18-20 g. This variety is tolerant to rust stem phylium blight. The seed contains about 24 to 26% protein. This variety completes its life cycle within 110-115 days. The average yield of this variety is 1.6- 1.7 tha' (BARI, 2005).
14
3.6 Experimental treatments The treatments are as follows - T1 = Sole wheat
T2 = Sole grasspea T3 = Sole Lentil
T4 = Wheat Paired Row (WPR) T5 = WPR+ One row grasspea T6 = WPR+ Two rows grasspea T7 = WPR+ One row lentil T8 = WPR+ Two rows lentil
T9 = 1:1 Row ratio of wheat and grasspea T10 =3:1 Row ratio of wheat and grasspea T1 I = 1:1 Row ratio of wheat and lentil T12 = 3:1 Row ratio of wheat and lentil 3.7 Experimental Design and Layout
The experiment was laid out in a Randomized Complete Block Design (RCBD) with three replications. The experimental unit was divided into three blocks each of which represents a replication. Each block was divided into 12 plots in which treatments were applied at random. The distance maintained between two plots was 0.75 m and between blocks was 1.5 m. The plot size was 4 m x 2 .5 m. It is mentioned here that the sole wheat was sown maintaining row spacing as 20 cm. The seeds were sown as continuous in each line following the seed rate. Sole grasspea / lentil were sown maintaining line and plant spacing as 30 cm X 10 cm, respectively. The wheat paired row was created as two wheat line brought close together with 10 cm line spacing.
Thus 40 cm free space was obtained between two wheat paired rows (WPR). In case ofT5 / T7 treatment, one row grasspea / lentil was fitted between two WPR. In T6 / T8 treatment, two rows of grasspea / lentil was fitted between two WPR. In case of 1: 1 row ratio of wheat and grasspea / lentil alternate wheat and grasspea / lentil was sown in line and in case of 3: 1 row ratio of wheat and grasspea / lentil one row grasspea / lentil was fitted after three rows of wheat. The layout of the treatments arrangement is given in appendix H.
3.8 Details of the field operations
The cultural operations were carried out during the experimentation are presented below:
3.8.1 Land preparation
The experimental field was first ploughed on 01 November 2008. The land was ploughed thoroughly with a power tiller and then laddering was done to obtain a desirable tilth. The clods of the land were hammered to make the soil into small pieces. Weeds, stubbles and crop residues were cleaned from the land. The final ploughing and land preparation was done on 10 November 2008. The layout was done as per experimental design on 11 November 2008.
3.8.2 Fertilizer application
For sole wheat fertilizers were applied at the rate of 100, 80, 30 and 20 kg ha' of NPK and S respectively. 2/3 urea and whole amount of other fertilizers were applied as basal dose and rest 1/3 urea was applied at crown root initiation stage (21 DAS) followed by irrigation.
In case of sole grasspea and lentil fertilizers were applied at the rate of 20, 40, 20 and 7 kg ha' of NPK and S respectively. The entire amount of urea, TSP, MoP & gypsum were applied as basal.
In case of wheat and grasspea / lentil intercrop fertilizers were applied as the recommended rate for wheat. No additional fertilizers were applied for grasspea / lentil.
3.8.3 Seed collection and sowing
The wheat seeds (cv. Shourav) were collected from Wheat Research Centre of Bangladesh Agricultural Research Institute (BAR!), at Joydebpur, Gazipur and the grasspea seeds (BAR! khesari-2) were collected from Pulse and Oil seeds Research Centre from the same institute. The lentil seeds (BARI masur-4) were collected from Bangladesh Agricultural Development Corporation (BADC).
Seeds were treated with Vitavax 200 @ the rate of 3 g kg-1 of seeds and sown in line on 12 November 2008 as per treatments. The recommended seed rate of wheat, grasspea and lentil were 125, 50 and 40 kg had, respectively. The seeds were placed in lines as per treatments. After that the seeds were covered with loose friable soil.
16
3.8.4 Germination test
Germination test was performed before sowing the seeds in the field. Filter papers were placed on four Petri dishes and the papers were soaked with water where 100 seeds were placed at random in each Petri dish. Data on germination were determined as percentage basis by using the following formula:
Number of germinated seeds
Germination test (%) = x 100
Number of seeds set for germination 3.8.5 Weeding
Weeds were controlled through three weeding at 20, 35, 50 days after sowing (DAS).
The weeds identified were Kakpaya ghash (Dactyloctenium aegyptium L), Shama (Echinocloa crussgalli), Durba (Cynodon dactylon), Arail (Leersis hexandera), Mutha (Cyperus rotundus L), Bathua (Chenopodiunm album), Shaknatey (Amaranthus viridis), Foska begun (Physalis beteophylls), Titabegun (Solanum torvum) and Shetlomi (Gnaphalium luteolabum L).
3.8.6 Irrigation
Germination of seeds was ensured by light irrigation. Two Irrigations were given at crown root initiation and heading stages (22 and 53 DAS). During irrigation care was taken so that water could not flow from one plot to another or overflow the boundary of the plots. Excess water of the field was drained out.
3.8.7 Harvesting and sampling
At full maturity, the wheat, grasspea and lentil crops were harvested plot wise on 9 March 2009. Before harvesting 10 plants of wheat, grasspea and lentil from each plot was selected randomly and uprooted. Those were marked with tags, brought to the threshing floor where seeds and stover were separated, cleaned and dried under sun for 4 consecutive days. Crop of each plot was harvested from 3.75 m2 separately.
Then those were weighted to record the seed yield which was converted into t hi'.
3.9 Recording of data
The following data of crops were collected during the study period.
3.9.1 Wheat
Plant height from 15 DAS to harvest
Above ground dry matter plant' from 15 DAS to harvest Tillers plant-' from 30 DAS to harvest
Length of spike from 60 DAS to harvest Spikelet spike' from 60 DAS to harvest 1000 grain weight (g)
Grain yield (t ha') Harvest index (%)
3.9.2 Grasspea
Plant height from 15 DAS to harvest
Above ground dry matter plant ' from 15 DAS to harvest Branches planf' from 30 DAS to harvest
Pods plant
1000 seed weight (g) Seed yield (t ha') Biological yield (t ha') Harvest index (%)
3.9.3 Lentil
Plant height from 15 DAS to harvest
Above ground dry matter plant -' from 15 DAS to harvest Branches plant' from 30 DAS to harvest
Pods planf'
1000 seed weight (g) Seed yield (t ha') Biological yield (t ha) Harvest index (%)
18
3.10 Procedure of recording data
The data was taken at 15 days interval. The detail outline of data recording is given below:
3.10.1 Wheat
3.10.1.1 Plant height (cm)
The heights of 10 plants were measured from the ground level to tip of the plants and than averaged. It was taken from 15 days after sowing to harvest.
3.10.1.2 Above ground dry matter plant'
Ten plants were collected at different days after sowing (15, 30, 45, 60, 75, 90 DAS and at harvest) and then oven dried at 700 C for 72 hours. The dried samples were then weighed and averaged.
3.10.1.3 Tillers plant'
10 plants were uprooted randomly and then total numbers of tillers were divided by 10. It was taken from 30 DAS to harvest.
3.10.1.4 Length of spike (cm)
Lengths of spike were measured from 10 plants and then averaged. This was taken from 60 DAS to harvest.
3.10.1.5 Spikelet spike -'
The numbers of spikelet spike4 were measured from 60 DAS to harvest.
3.10.1.6 Weight of thousand grain (g)
One thousand cleaned dried seeds were counted randomly from each harvested sample and weighed by using digital electric balance.
3.10.1.7 Grain yield (t ha')
Wheat was harvested randomly from 3.75 m2 area of land of each plot. Then the harvested wheat was threshed, cleaned and then sun dried up to 12% moisture level.
The dried seeds were then weighted and averaged. The grain yield was converted into th&'.
3.10.1.8 Harvest Index (%)
Harvest index was determined by dividing the economic yield (grain yield) to the biological yield (grain + straw yield) from the same area and then multiplied by 100.
Grain yield (t ha)
Harvest Index (°"°) = Grain yield (t hi') + straw yield (t ha1) X 100 3.10. 2 Grasspea and lentil
3.10.2.1 Plant height (cm)
The heights of 5 plants were measured from the ground level to tip of the plants and than averaged. It was taken from 15 DAS to harvest.
3.10.2.2 2 Above ground dry matter plant'
Five plants were collected at different days after sowing (15, 30, 45, 60, 75, 90 DAS and at harvest) and then oven dried at 700 C for 72 hours. The dried samples were then weighed and averaged.
3.10.2.3 Branches plant'
Five plants were collected randomly. Total number of branches from five plants were counted and then averaged. It was taken from 30 DAS to harvest.
3.10.2.4 Pods plant'
Number of pods planr' was taken from five plants separately only at harvest and then averaged.
3.10.2.5 Weight of thousand seeds (g)
One thousand cleaned dried seeds were counted randomly from each harvested sample and weighed by using digital electric balance and the mean weight was expressed in gram.
3.10.2.6 Seed yield (t ha')
Grasspea and lentil was harvested randomly from 3.75 m2 area of land of each plot.
Then the harvested wheat was threshed, cleaned and then sun dried up to 12%
moisture level. The dried seeds were then weighted and averaged. The grain yield was converted into t ha".
ZI]
3.10.2.7 Harvest Index (%)
Harvest index was determined by dividing the economic yield (seed yield) to the biological yield (seed + straw yield) from the same area and then multiplied by 100.
Seed yield (tha1)
X 100 Harvest Index (%) = Seed yield (t ha') + Straw yield (t ha')
3.11 Relative yield and land equivalent ratio (LER)
Relative yield and land equivalent ratio were used for comparing intercropping treatments. To evaluate the productivity advantage of intercropping, LER was calculated. LER values were computed with the help of the following formulae (IRRI, 1973).
Relative yield of wheat =
Relative yield of grasspea =
Intercrop yield of wheat Sole crop yield of wheat
Intercrop yield of grasspea Sole crop yield of grasspea
Relative yield of lentil = Intercrop yield of lentil Sole crop yield of lentil
Land equivalent ratio (LER) = Relative yield of wheat + Relative yield of grasspea / lentil
LER in its simplest form has been defmed as the relative area of sole crops that would be required to produce the yield achieved by intercropping. An LER value of 1.25 would indicate yield advantage of 25% (Willey, 1 979a).
3.12 Equivalent yield (t ha)
In the intercropping system, equivalent yields were used as criteria for evaluating the productivity of yield of companion crop (grasspea / lentil) in to the yield of main crop (wheat) on the basis of prevailing market price using the following formula (Anjaneynlu etal., 1982).
YgX Pg Wheat equivalent yield = Y +
PW
or, Y +
(For intercropping) Where,
Y = Seed yield of wheat (intercrop) (t h&') Yg = Seed yield of grasspea (intercrop) (t ha') P = Market price of wheat seed (Tk. 15 kg 1)
Pg = Market price of grasspea seed (Tk. 50 kg) Yi = Seed yield of lentil (intercrop) (t ha) P1 = Market price of lentil seed (Tk. 75 kg 1) Similarly,
Yt X Pi Pw
Grasspea equivalent yield = Yg + Yw X Pw pg (For intercropping)
Where,
Yw Seed yield of wheat (intercrop) (t ha') Yg = Seed yield of grasspea (intercrop) (t ha 1) P = Market price of wheat seed (Tk. 15 kg') Pg = Market price of grasspea seed (Tk. 50 kg')
Similarly, YWX
Lentil equivalent yield = Y1 +
(For intercropping) Where,
Yw Seed yield of wheat (intercrop) (t hi) Yj = Seed yield of lentil (intercrop) (t ha) P = Market price of wheat seed (Tk. 15 kg') P, = Market price of lentil seed (Tk. 75 kg")
22
3.13 Monetary Advantage (Tk. ha')
The monetary advantages (Tk. ha') were calculated for each component crop separately as per following formulae (Willey, 1979b).
Monetary advantages = Value of combined yield X LER-1 LER Where, LER= Land Equivalent Ratio
3.14 Economic analysis
Total number of labors used for different operations were recorded along with cost of variable inputs to compute the variable cost of different treatments. The cost and return analysis was done for each treatment on per hectare basis.
3.15 Benefit-cost ratio (BCR)
In order to compare better performance, benefit - cost ratio (BCR) was calculated.
BCR value was computed from the total cost of production and net return according to the following formula.
Gross return (Tk. ha 1) Benefit cost ratio (BCR)
Total cost of production (Tk. ha ')
3.16 Statistical analysis
Data collected from different parameters were compiled and tabulated in proper form.
Appropriate statistical analysis was made by MSTATC computer package program and the treatment means were compared by least significance difference (LSD) at 5%
level of significance.
Chapter 4
Results and Discussion
' (Uhrary)
Chapter 4
RESULTS AND DISCUSSION
This experiment was conducted to determine the effect of planting geometly of wheat grown as pure stand and intercropping with grasspea / lentil under different intercropping systems. Data on plant growth characters, yield contributing characters and yield were recorded to asses the trend of growth, development and yield of crops under different intercropping systems. The analysis of variance (ANOVA) of data is given in Appendices. The results have been presented and discussed under the following headings:
4.1 Wheat
4.1.1 Growth attributes of wheat 4.1.1.1 Plant height (cm)
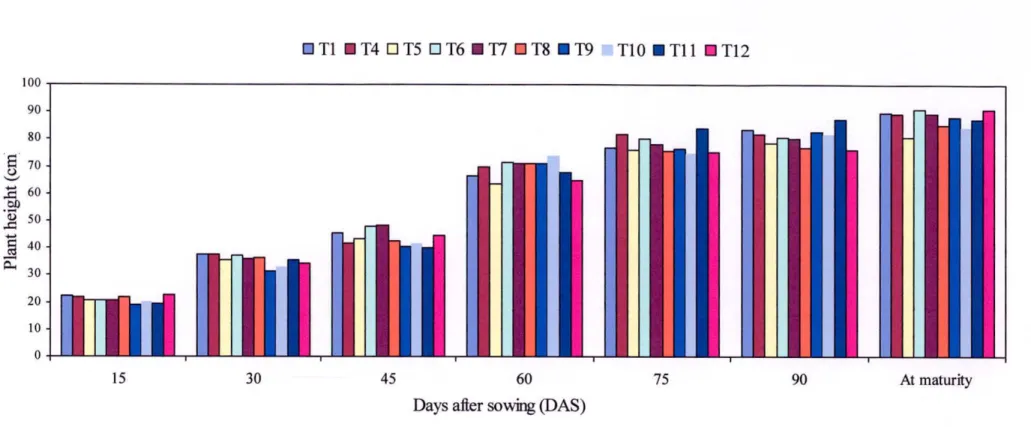
Plant height of wheat increased with the advancement of plant age. Plant height of wheat was affected by different intercropping systems (Fig. 1).
At 15 DAS, the tallest plant (22.59 cm) was obtained from T12 treatment which was statistically similar with T1, 14 and 18 treatment and the shortest plant was obtained from T9 treatment (19.12 cm) which was statistically similar with T5, 17, T10 and T11 treatments. At 30 DAS, highest plant height (37.58 cm) was obtained from T4 and the lowest (30.54 cm) was obtained from T treatment.
At 45 DAS, T7 treatment resulted in highest plant height (48.41cm), which was statistically similar with T6• The lowest plant height (39.98 cm) was obtained from T11 treatment and it was statistically similar with T4, T9 and T10 treatments.
74.05 cm plant height was recorded from T10 treatment which was highest and 63.46 cm the lowest plant height was recorded from Is treatment at 60 DAS.
At 75 and 90 DAS, the highest plant height 84.01 cm and 87.02 cm, respectively was obtained from T11 treatment whereas lowest plant height 74.97 cm and 75.91 cm were obtained from T8 and T12 treatment, respectively.
At fmal harvest, the tallest plant (91.08 cm) was observed in T12 treatment which was statistically similar with T1 and T6 treatments. The shortest plant (80.62 cm) was observed in T5 treatment.
Islam (2006) showed that, plant height of wheat varied significantly due to intercropping system. Pratibha et al. (2000) conducted an experiment on the growth parameters of sunflower intercropped with pea, linseed, niger and gram under 1:1 and 1:2 row planting geometry during winter season and showed that height of sunflower plants were almost identical under both planting geometry of the intercropping and sole cropping.
25
DT1IT4DT5DT6•T7DT8•T9 T1O•TI1UTI2
L 1
Oi 1
1111
15ii!Iiiii!I i i" 1 1
30 45d
60 75 90 At maturityDays after sowing (DAS)
Fig. 1. Plant height of wheat at different days under different intercropping systems (LSD0.05 = 1.64, 2.09, 1.71, 1.72, 1.86, 1.71 and 1.65 at 15, 30, 45, 60, 75, 90 DAS and harvest, respectively)
Ti = Sole wheat T7 = WPR + I row lentil T10 = 3: 1 row ratio of wheat and grass pea T4 = wheat Paired Row (WPR) T8 = WPR + 2 rows lentil T11 =1: 1 row ratio of wheat and lentil
T5 = WPR + I row grass pea T9 = 1: 1 row ratio of wheat and grass pea T12 = 3: 1 row ratio of wheat and lentil T6 = WPR + 2 rows grass pea
100 90 80 70 60 50 40 30 20 10 0
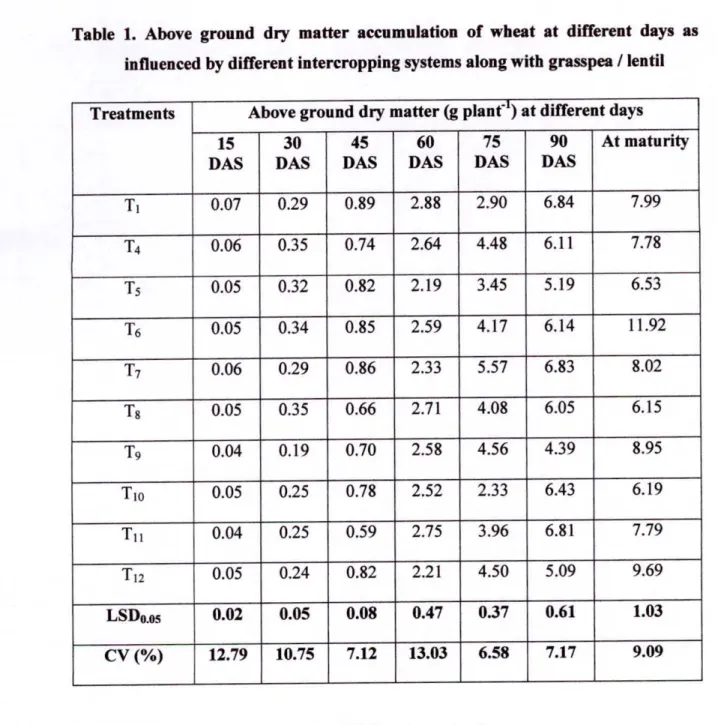
4.1.1.2 Above ground dry weight plant' (g)
Dry matter weight of wheat varied significantly due to different sowing patterns (Table 1). Dry matter weight of wheat increased with the advancement of plant age.
At 15 DAS, the highest dry matter of wheat (0.07 g) was obtained from T1 treatment and the lowest dry matter (0.042 g) was obtained from T11 treatment. At 30 DAS, the highest dry matter weight of wheat (0.35 g) obtained from T8 treatment which closely followed by T4 treatment. The lowest dry matter (0.1 9g) was obtained from T9 treatment.
At 45 and 60 DAS, the highest dry weight of wheat was obtained from T1 treatment (sole wheat) and the lowest dry weight was found from T1, (0.59 g) and T5 (2.20 g) treatment.
At 75 DAS, the maximum dry weight of wheat was obtained from T7 treatment (5.57 g).
The minimum dry matter was obtained from T,0 treatment (2.33 g).
At 90 DAS, the highest dry matter (6.84 g) was recorded from T1 treatment which was statistically similar with T7 and T11 treatments. The lowest dry matter (4.39 g) was obtained from T9 treatment. At maturity, the highest dry matter of wheat was obtained from T6 treatment (11.92 g). The lowest dry matter (6.15 g) was obtained from T8 treatment and it was statistically similar with T10 treatment.
Irrespective of treatment difference the dry matter production of wheat was slow upto 30 DAS then increased with time and got pick at harvest. It was appeared that the above ground dry matter increases in sole wheat treatment at all growth stages except 30, 75 and at maturity when it was intercropped with grasspea I lentil. Probably the wheat plants were influenced for higher accumulation of above ground dry matter when it grew in association legume crop.
However, dissimilar findings were also found by Islam (2006) who reported that dry matter weight of wheat was significantly affected by intercropping system.
27
Table 1. Above ground dry matter accumulation of wheat at different days as influenced by different intercropping systems along with grasspea / lentil Treatments Above ground dry matter (g plant') at different days
15 DAS
30 DAS
45 DAS
60 DAS
75 DAS
90 DAS
At maturity
T1 0.07 0.29 0.89 2.88 2.90 6.84 7.99
14 0.06 0.35 0.74 2.64 4.48 6.11 7.78
T5 0.05 0.32 0.82 2.19 3.45 5.19 6.53
T6 0.05 0.34 0.85 2.59 4.17 6.14 11.92
T7 0.06 0.29 0.86 2.33 5.57 6.83 8.02
T8 0.05 0.35 0.66 2.71 4.08 6.05 6.15
T9 0.04 0.19 0.70 2.58 4.56 4.39 8.95
T10 0.05 0.25 0.78 2.52 2.33 6.43 6.19
T11 0.04 0.25 0.59 2.75 3.96 6.81 7.79
112 0.05 0.24 0.82 2.21 4.50 5.09 9.69
LSD0.05 0.02 0.05 0.08 0.47 0.37 0.61 1.03 CV (%) 12.79 10.75 7.12 13.03 6.58 7.17 9.09
T1 = Sole wheat T8 = WPR + 2 rows lentil
14 = wheat Paired Row (WPR) 19 = 1: 1 row ratio of wheat and grass pea T5 = WPR + 1 row grass pea Tio = 3: 1 row ratio of wheat and grass pea T6 = WPR + 2 rows grass pea T11 =1: 1 row ratio of wheat and lentil T= WPR + I row lentil T12 = 3: 1 row ratio of wheat and lentil
28
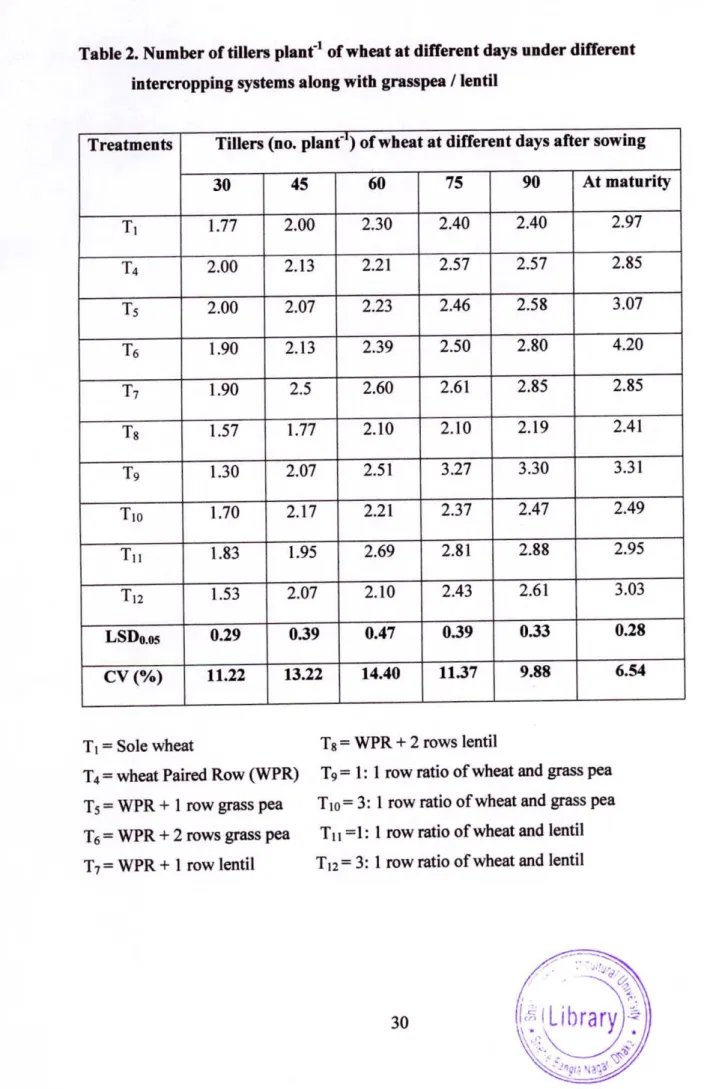
4.1.1.3 Tillers plant'
The number of tillers planf'of wheat varied significantly due to different sowing patterns (Table 2). At 30 DAS, the highest number of tillers plant'of wheat was obtained from T4 and T5 treatments (2.0). The lowest number of tillers plant' was obtained from T9 treatment which was statistically similar with T8 and T12 treatments (1.30).
At 45 DAS, the maximum number of tillers plantof wheat (2.5) was obtained from T7 treatment and the minimum number of tillers plant' (1.77) was obtained from T8 treatment which was statistically similar with T9 treatment.
At 60 DAS, the highest number of tillers planf1 of wheat (2.69) was obtained from T11 treatment and it was not significantly different from T6 and T9 treatments. The lowest number of tillers planf1 (2.097) was obtained from T8 and T12 treatments which were statistically similar with T4 and T,0 treatments. At 75 DAS, the maximum tillers planf' of wheat (3.27) was reordered from T9 treatment and it was statistically similar with T11 treatment. The minimum (2.10) number of tillers planf' was reordered from T8 treatment which was statistically similar with T1 and ho treatments.
At 90 DAS, the highest (3.30) number of tillers planf' of wheat was recorded from 19 treatment and it was statistically similar with T6, T7 and T11 treatments. The lowest number of tillers plant4 (2.19) was obtained from Ts treatment followed by T1 and T10 treatments.
At maturity, the highest (4.2) number of tillers planf' of wheat was shown in 16 treatment while the lowest number (2.41) from T8 treatment.
29
Table 2. Number of tillers planf' of wheat at different days under different intercropping systems along with grasspea / lentil
Treatments Tillers (no. plant) of wheat at different days after sowing
30 45 60 75 90 At maturity
T, 1.77 2.00 2.30 2.40 2.40 2.97
2.00 2.13 2.21 2.57 2.57 2.85
T5 2.00 2.07 2.23 2.46 2.58 3.07
T6 1.90 2.13 2.39 2.50 2.80 4.20
T7 1.90 2.5 2.60 2.61 2.85 2.85
T8 1.57 1.77 2.10 2.10 2.19 2.41
T9 1.30 2.07 2.51 3.27 3.30 3.31
T,0 1.70 2.17 2.21 2.37 2.47 2.49
1.83 1.95 2.69 2.81 2.88 2.95
1.53 2.07 2.10 2.43 2.61 3.03
LSD0.05 0.29 0.39 0.47 0.39 0.33 0.28
CV (%) 11.22 13.22 14.40 11.37 9.88 6.54
1, = Sole wheat
= wheat Paired Row (WPR) T5 = WPR + 1 row grass pea T6 = WPR +2 rows grass pea T7 = WPR + I row lentil
Ts = WPR + 2 rows lentil
= I: I row ratio of wheat and grass pea T,o 3: 1 row ratio of wheat and grass pea
T11 =1: 1 row ratio of wheat and lentil T12 = 3: 1 row ratio of wheat and lentil
ka
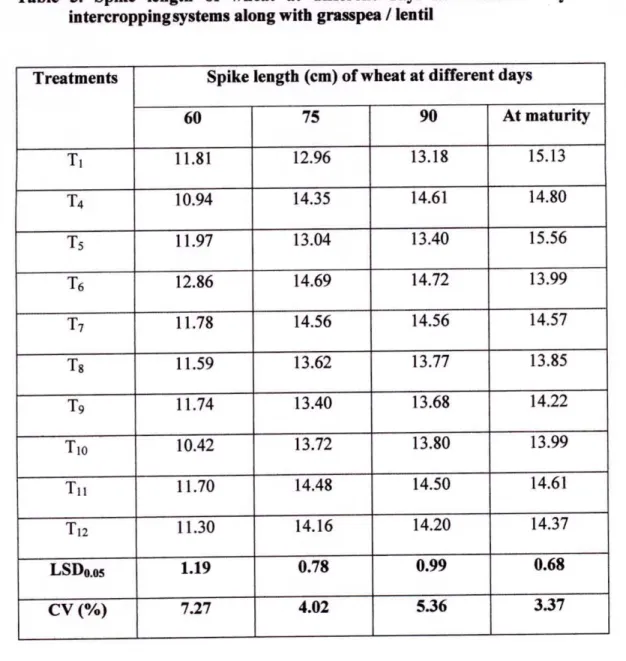
4.1.2 Yield attributes of wheat 4.1.2.1 Length of spike (cm)
The length of spike of wheat varied significantly due to different sowing patterns (Table 3).
The longest spike of wheat (12.86 cm and 14.69 cm) was recorded with T6 treatment and the minimum (10.42 and 12.96 cm) from T10 and T1 treatment at 60 and 75 DAS, respectively.
At 90 DAS, the highest (14.72 cm) length of spike of wheat was obtained from T6 treatment. The lowest length of spike of wheat (13.18 cm) was obtained from T1 treatment which was statistically similar with T5 and T9 treatments. At maturity, the highest length of spike of wheat (15.56 cm) was obtained from T5 treatment followed by T1 treatment. The lowest length of spike of wheat was obtained from T8 treatment (13.85 cm) which was statistically similar with T6 and T10 treatments. (Ihanbari and Lee (2002) and Nargis et al. (2004) reported significant effect of intercropping on the length of spike of wheat.
31