PREDICTING GAME ADDICTION USING MACHINE LEARNING
BY
Md.Sarwar Alam ID: 221-25-096
This Report Presented in Partial Fulfillment of the Requirements for The Degree of Master of Science in Computer Science and Engineering
Supervised By
Md. Abbas Ali Khan
Assistant Professor Department of CSE
Daffodil International University
DAFFODIL INTERNATIONAL UNIVERSITY
DHAKA, BANGLADESH January 2023
i
ACKNOWLEDGEMENT
First, I express my heartiest thanks and gratefulness to almighty Allah for His divine blessing makes us possible to complete the final thesis successfully.
I am really very grateful and wish our profound indebtedness to Md. Abbas Ali Khan, Assistant Professor, Department of CSE Daffodil International University, Dhaka. Deep knowledge and keen interest of our supervisor in the field of “Data Science and Machine Learning” to carry out this thesis. His scholarly guidance, patience, constructive criticism, motivation, constant and energetic supervision, continual encouragement, valuable advice, reading many inferior drafts and correcting them at all stages have made it possible to complete this thesis.
I would like to express my heartiest gratitude to Professor Dr. Touhid Bhuiyan, Professor &
Head, Department of CSE, for his motivation and appreciation. I am also very thankful to other faculty members and the staff of CSE department of Daffodil International University.
I would like to thank your entire course mate in Daffodil International University, who took part in this discussion while completing the course work.
Finally, I am very thankful to my parents and friends who I am always motivated and criticize my work in a manner to improve my work. At least I thank all of them from the core of my heart.
ABSTRACT
The main purpose of the paper is to determine how online game affects different aspects of Bangladeshi university-going students’ life. To find out the ratio or addiction rate of gaming on these young generation or students used data science. Mainly, using the machine learning algorithms tried to find out the addiction rate or ratio. The main research questions are how much time they spent playing online or offline based games, how much money they spent on them and what influences them to play online or offline games. In other countries, they have already started working on this side and tried to take necessary steps for the addicted young generation. But, in our country there was previous work on this side and the rate was too high during and after the Covid-19 pandemic. Though the rate was high, no one considered this issue as a serious issue, nor took any steps to solve this issue. Thus, the rate increased day by day and created a huge impact on the young generation. To solve the issue and to show to actual data or report this work was started and created an impactful result which will help others to take the proper steps for decreasing game addiction. To complete this work here total five steps were followed which are: Filtering, Clearing, Processing, Sorting and Testing. This is also a psychological case so took help from the site to find out the gaming addiction level or parameter. Data collection was done through online and social platform-based questionnaire form. A total of 365 participants provided the data. The primary findings of the study were that most of the participants play 2-4 hours daily, but they don’t want to spend money buying paid games. Another interesting finding was that although participants were casual gamers, they were willing to play the game. The significance of this work is also important. Though this is the work in this country and the success rate was great so anyone can use the machine learning algorithms to check out the addiction level and for future study or research-based works. Also, the government and other non-govt. organizations can use algorithms to detect the addiction level in the young generation.
TABLE OF CONTENTS
CONTENTS
PAGE
Board of examiners i
Declaration ii
Acknowledgements iii
Abstract iv
CHAPTER
CHAPTER 1: INTRODUCTION 1-5
1.1 Introduction 1.2 Motivation 1.3 Objectives
1.4 Methodology 1.5 Rationale of the Study
1.6 Research Question 1.7 Expected Output
1.8 Project Management and Finance 1.9 Report Layout
01 02 02 03 03 03 04 04 04
CHAPTER 2: BACKGROUND STUDY 6-10
2.1 Terminologies 2.2 Related Works 2.3 Comparative Analysis and Summary 2.4 Scope of the Problem 2.5 Challenges
06 06 08 09 10
CHAPTER 3: RESEARCH METHODOLOGY 11-22
3.1 Research Subject and Instrumentation 3.2 Data Collection Procedure 3.3 Statistical Analysis
3.4 Proposed Methodology 3.5 Implementation Requirements
11 11 12 13 14
CHAPTER 4: EXPERIMENTAL RESULTS AND DISCUSSION 23-29
4.1 Experimental Setup
4.2 Experimental Results & Analysis 4.3 Discussion
23 25 29
CHAPTER 5: IMPACT ON SOCIETY, ENVIRONMENT AND SUSTAINABILITY
30-30
5.1 Impact on Society
5.2 Impact on Environment 5.3 Ethical Aspects
5.4 Sustainability Plan
30 30 30 30
CHAPTER 6: SUMMARY, CONCLUSION, AND
IMPLICATION FOR FUTURE RESEARCH
31-32
6.1 Summary of the Study 6.2 Conclusions
6.3 Recommendation
6.4 Implication for Further Study
31 31 31 32
REFERENCES 33-35
PLAGIARISM REPORT 36-37
LIST OF FIGURES
FIGURES PAGE NO.
Figure 3.1: Statistical analysis. 13
Figure 3.2: Proposed Methodology. 14
Figure 4.1: Processing of experimental procedure 23
Figure 4.2: Jupiter notebook opening. 24
Figure 4.3: Calling the library. 24
Figure 4.4: Csv file reading. 24
Figure 4.5: Showing the result 24
Figure 4.6: Confusion Matrix of Decision tree 26
Figure 4.7: Confusion Matrix of Logistics Regression 27
Figure 4.8: Confusion Matrix of K-Nearest Neighbors Figure 4.9: Confusion Matrix of Support Vector Machine Figure 4.10: Confusion Matrix of Naive Bayes
27 28 28
LIST OF TABLES
TABLE PAGE NO
Table 2.1: Different Machine Learning Algorithms. 09
Table 3.1: Game Addicted Dataset for analysis. 12
Table 4.1: Experimental Results 25
CHAPTER 1 INTRODUCTION
1.1 Introduction
Firstly, early adolescence is usually when game addiction starts. Spending most or all of one's free time playing video games, losing productivity at work or in school, choosing to play video games oversleep, socializing, or other activities, lying or keeping one's use of video games a secret, and avoiding or ceasing participation in other activities to spend more time playing video games are early indicators or warning signs of video game addiction. Although some people may experience the signs of video game addiction quickly, for the majority, the process is sneakier. A rapid onset may occur after years of playing social video games, and it may be caused by either more game exposure or a stressful life event.
Secondly, Games have become an essential part of our daily lives because I am so busy that we play games while we have some time for ourselves. Especially in this Covid situation (COVID- 19) when people get a lot of leisure time in between work and games are given a lot of prominence, due to which various games have become a cause of addiction in our daily life. These game addictions have had such a negative impact on my social life that we need to know if they are game addicts. I can use a game addiction scale to get rid of game addiction. So, I collected some information from students and staff of schools, colleges, universities and tried to find out if they are really addicted to machine learning.
Lastly, the application of data science to forecast and prevent game addiction is probably going to increase in the future. The accuracy and predictive capacity of models used for addiction prediction will probably increase as more information is gathered about players' in-game behavior and demographics. Additionally, there may be a greater need for study on game addiction prediction and prevention because of the popularity and accessibility of video games. New methods and strategies could be created as this field of study develops to better anticipate and prevent game addiction. The discipline of machine learning and artificial intelligence (AI) is quickly developing, therefore the models that can be used to generate predictions will likely become increasingly advanced.
1.2 Motivation
The main motivation behind this work is helping mankind and remain addicted free from any kind of addictive things. The prominence of games and the amount of time people spend playing them are factors that are raising concerns about video game addiction because these factors can have a significant impact on people's physical and mental health, as well as their relationships and general well-being. Data on player demographics and in-game behavior can be used to predict gaming addiction using data science techniques. This can assist in identifying those who are susceptible to addiction so that interventions can be set up to assist them. Additionally, it may be possible to design games in a way that lessens the risk of addiction while still delivering an interesting and entertaining experience by recognizing the components that contribute to game addiction.
Additionally, identifying those at high risk and supplying them with.
1.3 Objectives
• The main purpose of this work is to find out the gaming addicts.
• Identify the factors that contribute to game addiction using data analysis techniques.
• Develop a predictive model that can accurately identify individuals who are at high risk of game addiction.
• Understand the relationship between game addiction and other behavioral and demographic characteristics, such as age, gender, income, and mental health.
• Use the predictive model to identify individuals who may benefit from early intervention or prevention efforts.
• Evaluate the effectiveness of existing treatment programs for game addiction and identify areas for improvement.
• Develop a better understanding of the social and economic consequences of game addiction.
• Provide insights and recommendations to game developers, educators, healthcare professionals, and policymakers on how to address game addiction.
• Contribute to the overall body of knowledge on game addiction and digital addiction as a phenomenon.
• Consider the ethical implication of data collection and its use in prediction and make sure data is handled properly and in compliance with privacy regulations.
1.4 Methodology
• I have provided a literature review, where we gave a summary of various related algorithms.
• I have constructed a survey questionnaire to collect data.
• I have constructed a dataset of symptoms of depression and associated facts.
• I have reduced the accuracy by applying different algorithms at different times.
• I have made the expected output.
1.5 Rationale of the Study
In this section, I will discuss Data preprocessing, Attributes Selection, Classification of algorithm, Related Work and Challenges that I had faced about this research. I will also present the overall research summary. In the data preprocessing sector, I will discuss the steps I followed for processing data. In the attribute selection section, I will discuss the attribute which I had used in my research. In the classification of algorithms section, I will discuss the algorithms that I applied in data processing. In the related work section, I will discuss other research papers and their respective works. I will discuss their methods and accuracy which are related to our work. In the challenges section, I will discuss the challenges that we’d faced throughout the time of making this paper.
1.6 Research Questions
The data collection was carried out by a self-administered structured pre-tested questionnaire.
Questionnaires were distributed to the students in various medium or platforms. The questionnaire was in four parts: Socio-demographic data, problem-related data, addiction measurement and the psychological change for game addiction. Variables in the socio-demographic data included gender, age, does gaming become the most important activity for you?, are you started playing games more and more?, feeling a "high" or "buzz" or other experience when gaming, unpleasant emotion when not playing, tendency to return to excessive playing after period1 of abstinence or control, getting into interpersonal conflicts due to gaming, having problems caused by excessive gaming, where do you live in?, in which occupation are your parents involved ?, how much time
do you spend every day playing games?. Problem related data included the game playing time of each individual or person.
1.7 Expected Output
• From this work my expectation is to:
• Find out the gaming addicted and non-addicted persons,
• Addiction scale of the gamers or game addicted persons,
• Addiction rate (how much they are addicted to gaming).
• Time consumption due to gaming.
• Physical and mental condition changing due to gaming etc.
1.8 Project Management and Finance
First, we created a google form, followed the gaming scale there, and made some questions according to the advice of a psychologist. We tried to collect the answers to those questions from the gamers. In this way, we created a data set. We must find out how much gaming addiction they have by applying machine learning language.
In this case there is no financial support needed. The main Support for this work is the help of the people during data collections.
1.9 Research Layout
In my report I have total 6 chapters
• In Chapter 1 we mention our whole research work’s outline and divide this chapter into multiple subchapters. For example, introduction, motivation, rational of the study, research question and expected output of our project.
• In Chapter 2 we have discussed the previous work on Game addiction, the scope of the problem and challenges in this work.
• In Chapter 3 we will talk about our work procedure, methods, and techniques to analysis it by Time Series analysis and linear regression.
• In Chapter 4 we will discuss the Experimental Results and Discussion of our build model.
• In Chapter 5 we will talk about the Impact of Society, Environment, Ethical Aspects and Sustainability plan of our work.
• In Chapter 6 we have discussed the Summary, Conclusion and Further Study of the work.
CHAPTER 2
BACKGROUND STUDY
2.1 Terminologies
In this section, I will discuss Data preprocessing, Attributes Selection, Classification of algorithm, Related Work and Challenges that I had faced about this research. I will also present the overall research summary. In the data preprocessing sector, I will discuss the steps I followed for processing data. In the attribute selection section, I will discuss the attribute which I had used in our research. In the classification of algorithms section, I will discuss the algorithms that I applied in data processing. In the related work section, I will discuss other research papers and their respective works. I will discuss their methods and accuracy which are related to my work. In the challenges section, I will discuss the challenges that I faced throughout the time of making this paper.
2.2 Related Works
Internet technology has developed and is now one of the ways that people can communicate with one another. Nowadays, online entertainment is one of the most well-known uses of the internet.
A sample was an online game. The popularity of online business games is growing because of this.
as a person. Playing online games frequently might improve user involvement, which might encourage more people to sign up for the game's community. Users may engage in specialized roles (role-playing), social engagement, and information exchange within this community. People who interact with others can design their own virtual universe. This was a brand-new development in the world of gamers. However, prior research has not been sufficient to answer the question of why people tend to. [1]. While game addiction is more common than other types of addiction, it is essentially identical to them. Classified in the group of psychological addictions that, if unchecked, can lead to mental and emotional issues. Addiction to video games among youngsters' harmful effects Include simply waste money, making students more eager to attend class only to play games, skipping class occasionally, forgetting to eat, and skipping class altogether might result in eye problems from spending too much time in front of monitors. smartphones in 2020, Karunanayake et al. Teenagers who enjoy playing video games induce the neurotransmitter
dopamine to rise, resulting in a pleasant feeling (Wang Chao-Feng Lin, 2018). Since humans have low dopamine levels from birth, they will always [2]. On occasion, playing digital games on a computer screen or mobile device may be regarded as just .one of the various leisure activities available. But regrettably, some players could lose themselves in their digital games. An addiction is the compulsive use of video games by a person that results in a strong dependence and interferes with their daily lives. Gaming becomes out of the player's hands. He or she prioritizes gaming more and more over other pursuits and keeps playing even when unfavorable effects emerge. Due to the accessibility and portability of modern media, many teenagers are observed spending numerous hours playing computer or internet games on their desktop, laptop, tablet, or mobile device.[3] The popularity of video games has skyrocketed recently, and it is now a billion-dollar industry. This quick growth has been supported through in-game microtransactions, which when combined with other sources of income represent a sizable cash stream for the gaming industry (King and Velabro, 2020). With the help of these finances, game designers have been able to create and market extremely complex game experiences that encourage regular play and long sessions of gameplay. This all-encompassing, time-unlimited experience is inevitably linked to harm, and it seems to affect both adults and teenagers (King and Velabro, 2018). Gaming disorder (GD) was recognized in the eleventh edition of the International Classification of Diseases after the DSM-5 identified "online gaming disorder" as a possible disease that merited additional study (American Psychiatric Association, 2013).[4] Although INTERNET ADDICTION is not currently a DSM IV diagnosis, DSM IV has been used to define it.requisites for fixation and addiction. Young, who first used the term "Internet Addiction Disorder" and listed diagnostic standards, is often used as a starting point by studies. In their analyses of Internet addiction, researchers like young substitute the word "drug" with "Internet," coming to the same conclusion that Internet addiction also exhibits similar symptoms including tolerance, withdrawal, yearning, and negative life outcomes. Based on comparisons to gambling addiction and compulsive shopping, which both lack a physiological dependence, research by Walker would classify Internet addiction as an obsessive and compulsive activity. However, little is understood about internet addiction in general.[5] This essay introduces the computer game Co-Op World as a tool for child psychotherapy. The game features a human player and a virtual AI-based player, enabling recurring interactions for asking for assistance from one another. The therapist can then focus on the reciprocity elements that emerged from playing the game, either in real-time by talking about various factors for offering or rejecting to help, or
offline through a variety of supportive resources (e.g., reports). The fact that our game gives the therapist a-priori control over the behavior of the virtual player, in contrast to traditional computer games or traditional therapy, allows for a variety of targeted reciprocity-related interactions between the patient and the virtual player, which is a crucially novel aspect of the system. This capacity for providing.[6]. The current study unequivocally identifies a few key driving forces behind mobile game addiction and interpersonal interactions among Bangladeshi university students. To begin with, this research shows that loneliness
promotes game addiction on mobile devices. Second, the results of this study showed that 65% of students choose mobile gaming as their preferred form of amusement. Unfortunately, there are numerous drawbacks to playing mobile games, therefore entertainment should not be restricted to them. Authorities need to act quickly to take this into account and set up a fun environment that will pique the children’s interest. Thirdly, the absence of any physical indoor or outdoor games promotes addiction growth. Participating in sports or other extracurricular activities may lessen loneliness and, as a result, lower the risk of addiction. Many extracurricular clubs are available at each university;[7]
2.3 Comparative Analysis and Summery
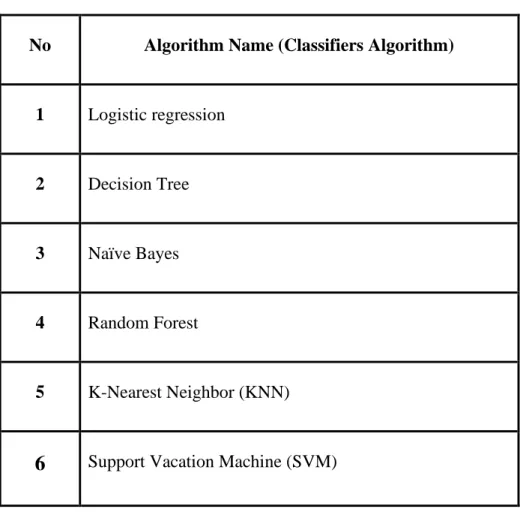
If try to analyze a dataset or build any predictive model, it is totally impossible to do. If it can be possible by any chance, surely there will be a lot of faults. So, I can do that task easily by applying machine learning algorithms. Machine Learning method or classification algorithm can produce desired results and can be done by computation early. Data which is used for machine learning are basically of two types. These are: unlabeled data use for unsupervised learning and labeled data use for supervised learning.
The various supervised learning and unsupervised learning of Machine learning algorithms are given in the Table below. Supervised learning algorithms are more useful than the unsupervised learning algorithms for their processing. The accuracy rate can be easily calculated by using supervised learning algorithms.
Table 2.1: Different Machine Learning Algorithms.
No Algorithm Name (Classifiers Algorithm)
1 Logistic regression
2 Decision Tree
3 Naïve Bayes
4 Random Forest
5 K-Nearest Neighbor (KNN)
6
Support Vacation Machine (SVM)2.4 Scope of the Problem
This section describes data preprocessing, attribute selection, algorithm classification, related work, and challenges faced in this study. It also provides a general overview of the research. In the data preprocessing area, proceed with the steps followed for data processing. The Attribute Selection section describes the attributes used in every study. The Classification of Algorithms section describes the algorithms applied to data processing. The Related Works section reviews other research papers and their respective works. I describe methods and precision as they relate to my work. The Challenges section describes the challenges faced during the creation of this document.
2.5 Challenges
I faced a lot of challenges during this research work as search work. The main challenge is collecting the proper datasets with proper inputs. For this issue, I have to select several persons or individuals so that they’re able to understand the input process & further work. After collection, while working on filtering and processing, I faced another issue to find out the proper datasets for testing. Also, during the testing step I faced some issues & errors with programming languages and libraries.
CHAPTER 3
RESEARCH METHODOLOGY
3.1 Research Subject and Instrumentation
In recent years, machine learning algorithms, data mining, and deep learning techniques are immensely acceptable and in vogue for any kind of prediction, recognition, and detection. I will try to apply several machine-learning algorithms to my collected dataset to see which algorithms will fulfill my satisfaction level and perform the best. I applied several machine learning algorithms which are: k-nearest neighbor (KNN), naïve Bayes, Support Vector machine (SVM) Linear, random forest, Decision Tree. Recently ‘Python’ is one of the most famous and used programming languages which is mostly used for research purposes by researchers. So, I used
‘Python’ for the programming language part and for data mining tools or platforms, I used the
‘Jupyter notebook’, with that ‘Microsoft Excel’ as the dataset. The method of creating a model of classes from a collection of records containing class levels is known as classification. The aim of the Decision Tree Algorithm is to figure out how the attributes-vector behaves in a variety of situations. The classes for the newly created instances are also determined using the training instances.
3.2 Data Collection Procedure
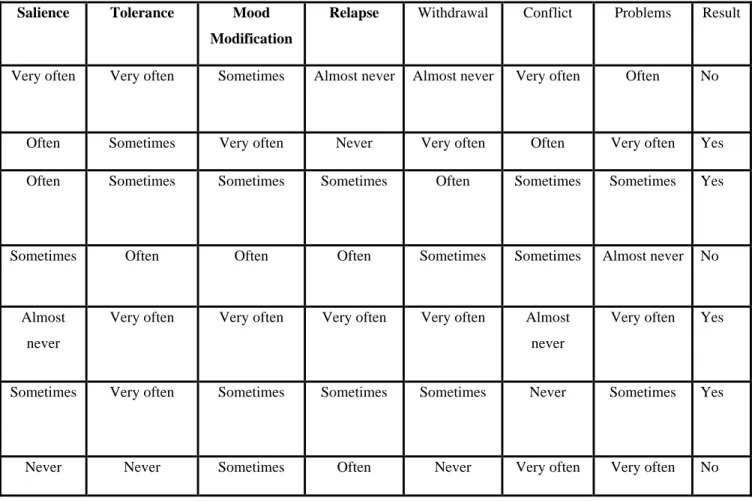
The dataset consists of a huge number of features or factors which are directly or indirectly connected with game addiction. I failed to collect the necessary data to make a complete dataset for the first time because it is not as much easier as I thought. Because if anyone searched on search engine like google, Bing they can find out some datasets which are common or very popular. But to find out the datasets of gamers or game addicted people or students is not that much available.
That’s why I think I need to create my own datasets which are collected from online and social platform-based questionnaires, google forms, and a paper with a list of questions. Hopefully, I was successful in collecting 338 people’s data based on 12 factors which are basically daily activities of a person while they are playing games online or offline. After collecting all the data, the main challenging part came to my mind that is data leveling for the game addicted people and non-game addicted people. I consulted with some psychologists to help me in this situation and find patterns
Table 3.1: Game Addicted Dataset for analysis.
Salience Tolerance Mood Modification
Relapse Withdrawal Conflict Problems Result
Very often Very often Sometimes Almost never Almost never Very often Often No
Often Sometimes Very often Never Very often Often Very often Yes
Often Sometimes Sometimes Sometimes Often Sometimes Sometimes Yes
Sometimes Often Often Often Sometimes Sometimes Almost never No
Almost never
Very often Very often Very often Very often Almost never
Very often Yes
Sometimes Very often Sometimes Sometimes Sometimes Never Sometimes Yes
Never Never Sometimes Often Never Very often Very often No
to sort out the issue. Also, searched on and found a psychological website which worked with this type of issue. Finally, with the help of the psychologists and online support, combining their several decisions into final leveling outputs with emphasis on the opinion of the majority. Among those data, there are game 294 information and 87 non-game addicted people's information. All the data I have collected from an online survey and social media platforms is based on my family.
3.3 Selective Algorithms
Applying algorithms is an important issue in data mining and machine learning techniques when I do any research work because the accuracy of the expected outcome depends on applying algorithms. When I have turned to the point to select algorithms, at first, I find out the most valuable algorithms and then I have selected five algorithms.
These are:
1. Logistic regression 2. Random Forest 3. Decision tree 4. Naïve Bayes
5. Support Vector Machine 6. K-nearest Neighbor 3.4 Statistical Analysis
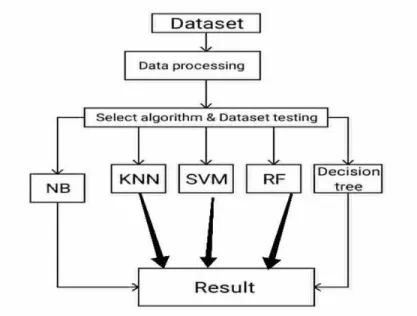
In my system dataset, I have collected 200 people’s data for early prediction of heart attack. I selected 70% dataset to train and 30% dataset to test. In system work I have used five algorithms to have a higher accuracy level. I have tested the performance of those algorithms.
Fig: 3.1 Statistical Analysis.
3.5 Proposed Methodology
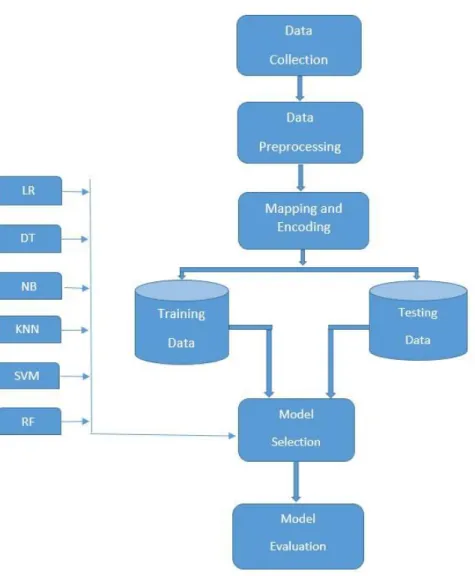
I am going to discuss our research methodology in the following section. In My work, I use six supervised machine learning classifiers and Time Series Analysis. The six supervised models are linear regression, logistic regression, LR, DT, NB RF, KNN, and SVM to classify the increasing ret of Game Addiction.
Fig: 3.2 Proposed Methodology.
3.5.1 Data Preprocessing
I cannot use raw text data to feed our classifier model. Because sometimes raw text data have some characters or symbols which are not essential and suitable for our classifier model Since I have applied machine learning algorithms for analysis and prediction in my work. In this case, I have applied classified algorithms for prediction. To complete the processing of data I used five steps which are: Filtering, Clearing, Processing, Sorting and Testing. Firstly, to filter the data set choose the important data sets. Then for the ‘never’ and ‘almost’ option we set the value as ‘no’ and other options remains as ‘yes’, thus we completed the clearing process. In the processing part, choose the topmost ‘yes’ option-based rows as accepted values. In sorting part, I carry on with the positive valued rows and for ‘yes’ option declared ‘1’ and for ‘no’ and ‘other’ options declared ‘0’. Thus completed the testing process with the help of python programming and its data science-based libraries. After that, I applied logistic regression LR, DT, RF, KNN, and SVM algorithms.
3.5.2 Model Selection for classification problems
To Classification problem here I apply some classifier algorithms such as Simple Logistic regression (LR), Decision Tree Classifier (DT), Random Forest Classifier (RF), K-Nearest Neighbors (KNN), Support Vector Machine (SVM), Naive Bayes Classifier (NB).
3.5.2.1 Simple Logistic regression
Logistic regression is the fitting relapse investigation to lead when the reliant variable is dichotomous (binary). Like all relapse examinations, calculated relapse is a prescient investigation.
Calculated relapse is utilized to depict information and make sense of the connection between a reliant parallel variable and at least one ostensible, ordinal, stretch, or proportion-level free factor.
Logistic regression generates high accuracy output for classification problem. In our work it performs very well and score best accuracy which is 92%.
3.5.2.2 Decision Tree Classifier (DT)
A decision tree j48 model is that model which runs a few comparison questions to divide the dataset into different smaller sets based on a given question. So, the dataset can be processed step by step. And it keeps repeating the task with different sets of questions for different levels of the available necessary subsets. It continues until it can be covered by all available attributes in the
dataset. I can build different types of decision trees based on our research-based questions and our decision rules and based on the nature of the data set as its district value or continuous value.
Decision tree 48 is a very popular and most used algorithm. It is used for a unified variable associated with the building dataset. Decision tree is used to solve both regression and classification problems. DT also works with continuous and categorical I/O (input/output) variables. Working approach of this algorithm is to make a tree. DT is a tree where every internal node of the tree represents the attribute values, and the leaf node represents the decision. Decision Tree generates high accuracy output for classification problem. In our work it performs very well and score best accuracy which is 94%.
3.5.2.3 Random Forest Classifier (RF)
Random forest is a scalable, easy-to-use machine learning algorithm that delivers, much of the time, a fantastic result even without hyper-parameter tuning. Because of its simplicity and diversity, it is now one of the most used algorithms. Among existing algorithms, accuracy is unsurpassed. It operates on huge datasets of data effectively. Without Variable Deletion, it can accommodate thousands of input variables. It gives estimates of what variables in the classification are relevant. As the forest development proceeds, it produces an intrinsic impartial estimation of generalization error. It has an efficient method of calculating incomplete data which preserves precision in the absence of a significant proportion of the data. It has methods for balancing errors in unbalanced data sets of class population. Created forests can be saved from other data for future use. Prototypes that provide data about the relationship between the variables and the classification are computed. It calculates proximities between pairs of cases that can be used to cluster, find outliers, or provide interesting views of the data (by scaling). It is possible to apply the functionality of the above to unlabeled files, resulting in unsupervised clustering, data views, and outlier detection. It provides an experimental technique to track vector interactions. Further knowledge about how they are computed is helpful for recognizing and using the different choices.
Two data artifacts created by random forests rely on most of the options. Roughly one-third of the instances are left out of the dataset as the training set for the current tree is drawn by sampling with substitution. This out-of-bag data is used to achieve an unbiased running calculation of the classification error when adding trees to the area. It is often used to produce variable-importance forecasts. All the data is run down the tree after each tree is constructed, and proximity are
computed for each pair of cases. If the same terminal node is occupied in two instances, its proximity is increased by one. Approximations are normalized at the end of the run by dividing by the number of trees. In replacing lost data, finding outliers, and generating illuminating low- dimensional data views, proximities are used.
Random forests are a machine learning algorithm that is used to solve regression and classification problems. These algorithms split the dataset into many parts and make many decision trees from datasets. It makes the decision or predicts the output based on the decision tree outcome which has the maximum probability of occurrences. For our dataset, it predicted the outcome 99% accurately 3.5.2.4 K-Nearest Neighbors (KNN)
In the controlled adapting category of calculations, KNN is included. Casually, this means that we are given a marked dataset consisting of expectations (x, y) being prepared and will want to capture the relation between x and y. And more formally, with the objective that given a secret perception x, h(x) will certainly, predict the associated yield y, I can possibly take in a power h:X-Y. Likewise, the K-NN classifier is a non- parametric measure of learning dependent on occasion. Non- parametric means that the utilitarian form of h does not allow any unambiguous presumptions, keeping away from the risks of mis-modeling the simple dispersion of the results. For example, suppose our data is exceptionally non-Gaussian, but the learning model I use embraces a Gaussian form. All things considering, our estimate would make the prediction low to a great degree. Case- based learning means that a model is not specifically taken up in our estimation. Instead, it preserves the events of planning that are therefore used for the forecast stage as "learning". Solidly, this means that the measurement would use the planning opportunities to release an answer only when a question is made to our database. The K-closest neighbor measure essentially comes down to forming a greater portion of the vote between the K most comparative occurrences to a given
"concealed" interpretation in the arrangement environment. Similitude is defined by a measure of separation between two focal points of information. The Euclidean separation given by d(x,x')=(x1-x'1)2+(x2-x'2)2+...+(xn-x'n)2 is a prominent decision. Provided a positive integer K, an inconspicuous perception x and a similarity metric d, from equation 1, the K-NN classifier carries out the two following phases: it goes through the whole dataset recording d between x and each perception of planning. In the preparation data that is closest to x the package, I will name
the K focuses. Notice that K is usually unusual to counteract tie circumstances. It basically ascertains the isolation of another information point to all other preparing information focuses. It chooses the K-closest focus of data at that point, where K can be any number. Now, how to choose vector K and what its implications are on this classifier are likely to be considered. The K in K- NN is a hyper parameter that you, as a developer, must select with the final goal to get the most optimal fit for the knowledge index, all things considered, like most machine learning calculations.
Naturally, K should consider regulating the state of the limit of options that I discussed previously.
At the point where K is small, I restrict the area of a given forecast and push our classifier to the general conveyance to be "more visually impaired" The most adaptable suit, which will have low tendency and high fluctuation, provides a little encouragement for K. Graphically, it'll be additional jagged, our choice limit. On the other hand, in each forecast, a higher K midpoint has more voters and thus exceptions are better. K's larger estimates would have smoother option limits, suggesting a reduction in shift but an increased predisposition. The group quantity, K, must be solved beforehand. Its downside is that it does not yield an identical outcome with every run, since the next bunch relies on it. I never know the genuine bunch, utilizing similar information, supposing that it is input in an alternate request it might deliver a diverse group if the quantity of information is few. As far we know, datasets are very much arranged for the KNN display building.
Since KNN is a non-parametric calculation, I won't acquire parameters for the model but still restore a vector containing elements of characterizations of the test set.
Nowadays depression, anxiety, and stress have become very common words among students. Most of the scholar’s area unit suffering a minimum of a minimum level of depression in their life. I did our survey among 500 students from different places in Bangladesh. From our data, I found that at least 95% of students are suffering from depression. Most students aged twenty to twenty-four area units laid low with depression. Teenage students are on the second level of suffering from mental health issues. The psychological problem of students impacts their family, classmates, and friends. When a student suffers from a mental health issue, it impacts the environment of their family as well as their educational institutions and society.
K-nearest neighbor is the most used classification algorithm. It is also used in regression problems.
It works by calculating the distance between dependent variables (our expected result) and one or more independent variables (our features). For calculating the distance, it uses the Euclidean
distance formula. In this algorithm, it creates a group by using similar data points which means which data point has a closer distance from the expected outcome. Based on the value of k (neighbors’ numbers) it decides how much data it took to create a group. Here we use the value of k as 3. This algorithm cannot predict the outcome, it memorizes the created group and compares the test data with those groups and generates an outcome. For this reason, it takes time to show the expected outcome. That’s why this is also known as a non-parametric and lazy algorithm. But our dataset performs well with an accuracy of 91%.
3.5.2.5 Support Vector Machine (SVM)
One of the most popular Supervised Learning algorithms, which is used for classification and regression issues, is Support Vector Machine or SVM. It is, however, mainly used in Machine Learning for classification problems. The SVM algorithm's goal is to create the most effective line or call boundary which will segregate n-dimensional area into teams specified within the future;
we are able to handily place the new information within the right cluster. This boundary of the proper judgment is named a hyperplane. the acute points/vectors that facilitate the construction of the hyperplane square measure chosen by SVM. Such extreme cases square measure is remarked as support vectors, and the rule is therefore remarked because of the Support Vector Machine. The key issue in mind here is that these squares measure all science calculations tuned as simply as potential to offer you the foremost elaborate response potential. Due to how they choose the decision limit that maximizes the distance from the closest data points, SVMs vary from other classification algorithms. In the SVM algorithm system there is a set of data with N attributes.
Support Vector Machine (SVM) classifier is to find a suitable hyper plane in N-Dimensional space that clearly classifies the dataset that has a maximum margin between data points. Where it organizes the two main class’s hyper-plane and line to separate available sets of points and it is considered a supervised machine learning algorithm which can be used for classification systems.
It is a machine learning algorithm that is mostly used to solve regression and classification problems. But it is commonly used in classification problems. In the SVM algorithm, the data was plotted in a hyperplane with n-D space (where n is the feature number). Here I use a two- dimensional surface plane where the line separates the space into two different sections. One class is on one side and another class is on the other side of the space. These algorithms solve my classification problem with a medium 87% accuracy.
3.5.2.6 Naive Bayes Classifier (NB)
Naïve Bayes (NB) algorithm works by following the given theorem:
P(A|B) = P(B|A) P(A)/P(B) (1)
Naive Bayes is a classification algorithm that is also known as a simple probabilistic classifier.
Basically, this classifier is a set of classification algorithms that works based on Bayes' Theorem. This classifier is not a single algorithm; this is a set of familiar classification algorithms where that share a common principle. In our research work, we used a Multinomial Naive Bayes classifier. Because Multinomial Naive Bayes performs very for text document data. Our work is related to text documents.
This algorithm came with the highest accuracy for our dataset. This algorithm perfectly predicted our classes. The accuracy is 90%.
3.4.3 Model Evaluation
Only based on training and testing accuracy I cannot evaluate our model. We need to consider some reports to evaluate our model. First, to get accurate results from our model need to apply cross validation. After that I need to make a classification report to evaluate our model. The short description will be discussed in the below subsections.
3.5.4 K-Fold Cross Validation
Cross-validation is a validation technique that helps us to evaluate the accurate accuracy of our model.
Because when I divide our dataset into train and test data, every time it divides our data randomly. For this reason, sometimes test data consists of data that is not in train data. That's why sometimes I get less accuracy from our model. k-Fold cross-validation helps us to solve this problem. In this technique, there is a parameter(k) which is the number of folds that a dataset is divided into. Cross-validation randomly divides the dataset into k times and checks how well the model performs when it faces any randomly picked unseen test data. In my research work, I set the value of k as 5. Therefore, I use a 5- Fold cross-validation process in my research work.
3.5.5 Classification Report
Only based on the cross validation score I cannot tell that this model is best for this dataset. Besides this I need to evaluate some parameters which are used to make classification reports. These parameters are given below:
Confusion Matrix
It is a performance measure table which is mostly used to represent the performance of a machine learning model based on a set of test output data [15]. It checks the performance by calculating four terms such as, True Positive (TP), True Negative (TN), False Positive (FP) and False Negative (FN). I will briefly describe this in the experiment and result segment.
Precision Score
Precision is a ratio of True Positive result and total Positive predictions. This is also known as PPV or positive predictive value.
Precision = TP / (TP + FP) (2)
Recall Score
It is the quotient of True positive result and the total number of actual predictions. Recall is known as a true positive rate or sensitivity.
Recall = TP / (TP + FN) (3)
F1 Sore
It is also known as F1-measure. Basically, this is called the Fβ-score. Fβ-score is the combination of harmonic mean of precision score and recall score. When β = 1, this is called an F1-score.
𝛽 − 𝑠𝑐𝑜𝑟𝑒 = (1 + 𝛽2). 𝑝𝑟𝑒𝑐𝑖𝑠𝑖𝑜𝑛. 𝑟𝑒𝑐𝑎𝑙𝑙 𝛽2. 𝑝𝑟𝑒𝑐𝑖𝑠𝑖𝑜𝑛 + 𝑟𝑒𝑐𝑎𝑙𝑙
(4)
3.6 Implementation Requirements
During the implementation of the datasets of this work I must have to follow some requirements which are given below: All the datasets are well structured Testing system or platform is updated and configured with my system & datasets All the algorithms & its libraries are imported on the system All the testing parameters are set to find out the result
Hardware and Software:
• Intel Core i7 8th gen integrated with 24GB ram
• 1 TB Hard Disk
• Google Collab with 12GB GPU and 350GB ram
• High Speed Internet Connection Advance Libraries and Tools:
• Windows 11
• Python 3.10
• Pandas
• NumPy
• Regular Expression (RE Library)
• NLTK
• Matplotlib
• Scikit-Learn
CHAPTER 4
EX PERIMENTAL RESULTS AND DISCUSSION
4.1 Experimental Setup
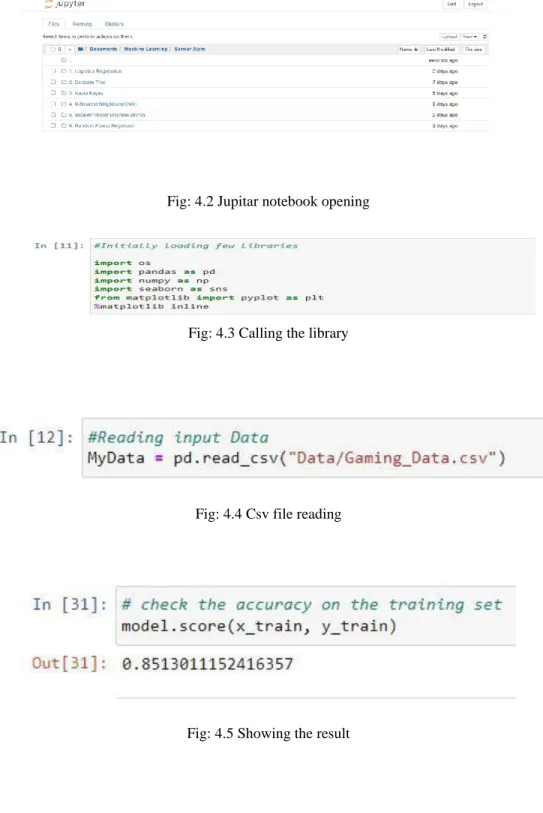
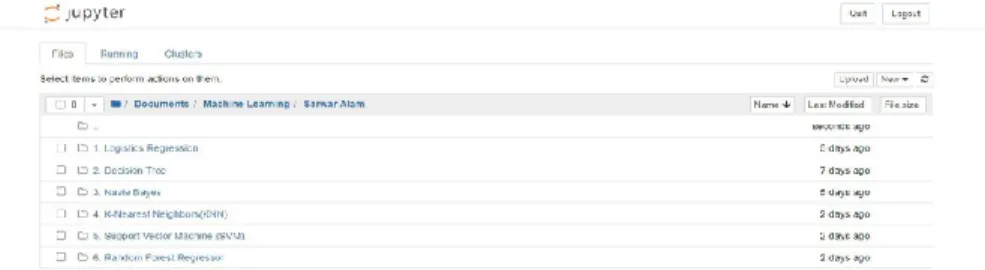
To complete this thesis, I just need the simulation-based setup which was done by Jupyter Notebook. I used the latest version of this platform, to start the platform I started it through my browser or internet explorer. Then I called the library functions and completed the reading process of my datasets using the platform. After the reading process the platform showed up the results &
errors of the datasets which are attached to the next chapter.
Figure: 4.1 Processing of experiment procedure
In this paper I have used both manually and Google form data that consist of 11 significant features.
So, I have done my work with a data mining process and five well known machine learning algorithms. I thought that it is possible to apply algorithms for the purpose of depression and associated facts. In my research work, first I have divided my work stage in some steps. I have collected a dataset based on some questions related to symptoms of depression. Then select the algorithms and observe the performances of the algorithms and find out which one is better.
Fig: 4.2 Jupitar notebook opening
Fig: 4.3 Calling the library
Fig: 4.4 Csv file reading
Fig: 4.5 Showing the result
4.2 Experimental Results and Analysis
The following couple of tables show the results of Precision, Recall and F1 Score of different algorithms.
Table: 4.1 Experimental Results
Techniques/method Accuracy Precision Recall F1-Score
Logistic Regression 85%
91% 87% 94%
98% 93% 96%
Random Forest 89%
91% 87% 84%
88% 93% 86%
Decision Tree 94%
85% 89% 93%
89% 91% 95%
K-Nearest Neighbors (KNN) 91%
88% 95% 88%
96% 86% 90%
Support Vector Machine 87%
91% 96% 95%
96% 93% 96%
Naive Bayes 90%
96% 76% 87%
86% 96% 92%
Above all tables the third row represents the weighted worth. Based on accuracy the support vector machine algorithm has the highest accuracy but also its F1 Score and Recall and Precision is greater than any other selected algorithm. So, I can say that the testing algorithms using Random Forest show the highest accuracy during the testing process or period.
Confusion Matrix
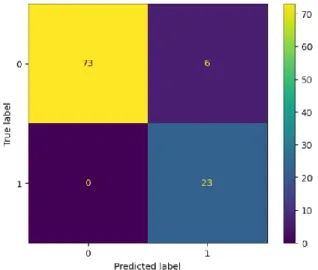
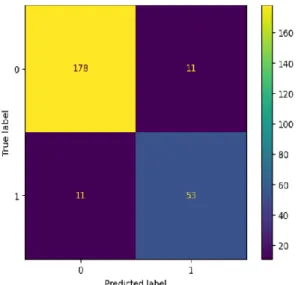
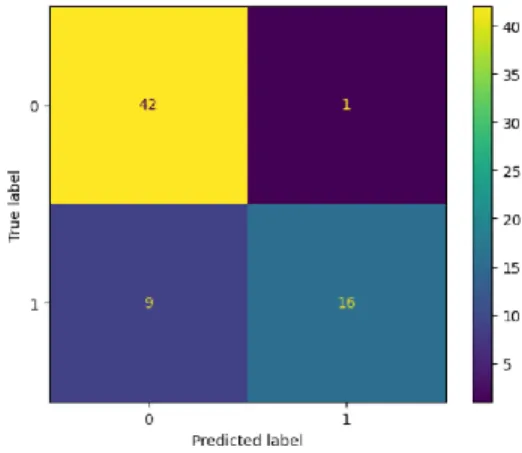
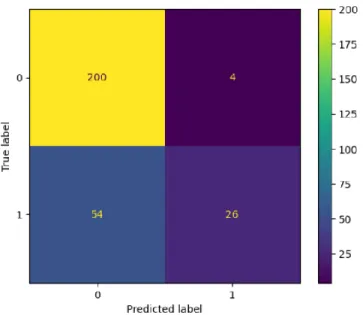
It is a performance measure table which is mostly used to represent the performance of a machine learning model based on a set of test output data [15]. It checks the performance by calculating four terms such as, True Positive (TP), True Negative (TN), False Positive (FP) and False Negative (FN). I will briefly describe this in the experiment and result segment. Figure from 4.6 to 4.10 are shows the confusion matrix of Decision tree, Logistic regression , K- Nearest Neighbors, Support Vector Machine& Naive Bayas repetitively
Figure 4.6: Confusion Matrix of Decision Tree
Figure 4.7: Confusion Matrix of Logistics Regression
Figure 4.8: Confusion Matrix of K- Nearest Neighbors
Figure 4.9: Confusion Matrix of Support Vector Machine
Figure 4.10: Confusion Matrix of Naive Bayas
An N x N matrix called a confusion matrix is used to assess the effectiveness of a classification model, where N is the total number of target classes. In the matrix, the actual goal values are contrasted with those that the machine learning model anticipated. High TP and TN rates and low FP and FN rates are indicators of a strong model. It’s usually preferable to utilize the confusion matrix as your machine learning model's assessment criterion when working with an unbalanced dataset. A confusion matrix is a table that lists how many guesses a classifier made correctly and incorrectly. It is employed to evaluate a classification model's effectiveness. It can be used to assess a classification's effectiveness.
4.3 Discussion
Working on this research, there were some findings, outcomes & significant points. Data collection was one of the problematic issues for this research work. But after completing the testing while the system shows the highest output rate that added an extra value with this thesis. This was one of the significant points of this research. Also, data processing was one of the toughest works for me but completely managed to process all the datasets. Another important outcome of this research is working with both engineering and psychological fields under the same research work. And, in addition this one is the first-time game addiction-based work in Bangladesh which can play an important role to decrease the addiction level. We play games when we have some downtime because I am so busy, and they have become a necessary part of our everyday lives. Particularly in this COVID-19 scenario, when individuals have a lot of free time in between jobs and games are given a lot of attention, different games have turned into a source of addiction in our daily lives. My social life has been negatively impacted by these gaming addictions; thus, we need to determine whether they are game addicts. To overcome my gaming addiction, I can use a scale.
To determine whether students and personnel at schools, colleges, and universities are addicted, I gathered some information from them.
CHAPTER 5
IMPACT ON SOCIETY, ENVIRONMENT AND SUSTAINABILITY
5.1 Impact on Society
This work will help society in various ways like parents will be more aware of their children, they can easily measure the addiction level and take necessary steps to heal their game addicted child.
Also, this will decrease the game addiction level from the society thus the young generation get more time for various types of work for example: physical exercise, social or volunteering work, self-development, skill development etc. Which not only helps the young generation but also society and country in the long run.
5.2 Impact on Environment
When the young generation will not spend more time playing games, the rate of production of gaming instruments will decrease. Which also helps to reduce the carbon emission rate. In addition, it will not create more pressure on electricity thus the electricity shortage will be low. Young generation when actively participate in social or volunteering works, they will work for projects like tree plantation which will increase the number of trees, oxygen.
5.3 Ethical Aspects
When the young generation will not remain closer to their gaming console, computer their brain will remain fresh, filled with positive energy. Thus, unethical works, misunderstanding issues, misbehavior or other injustice related works will not occur anymore in the society. Which also decreases the rate of crime, misdeeds of any society or country.
5.4 Sustainability Plan
This work will sustain if gaming exists. Mainly the game makers focused on humans’ psychology and design the games. So, every time they will make a new game and at least a generation will fall into that trap. And to remove the addiction each time this work will help them to measure the addiction level.
CHAPTER 6
SUMMARY, CONCLUSION, RECOMMENDATION, AND IMPLICATION FOR FUTURE RESEARCH
6.1 Summary of the Study
In a nutshell, this project describes the gaming habits of the young generation of our country and the result shows whether they are game addicted or not. To complete the process, I need datasets which were collected from various social platforms that are only gamers and spent most of their time gaming. Then, on that data, I used some operations in such kind of steps to make the data good for testing purposes. To make the data appropriate for testing, I must use machine learning algorithms and make a system m which can be able to make decisions. Also, to make decisions or to give a system the capability of decision making I must take the help of psychological knowledge also by which the parameter was set up.
6.2 Conclusion
From this project I mainly learnt about the psychological changes due to game addiction, how to measure the addiction level, El, and how to get rid of this issue. Also, I learnt about how to collect d for research-based work, how to implement data science practically, how to separate datasets, how to choose the important datasets, how to categorize data for the test purpose, how to use machine learning algorithms, how to test the datasets and how to find out the decisions from the testing process. In addition, this thesis work gave me a clear idea about indigence & how to use data science in real life problems & how to find out a solution.
6.3 Recommendation
In a thesis on Game addiction prediction using data science, some recommendations that could be made include:
• Further research on the factors that contribute to game addiction: By identifying specific aspects of game design, play patterns and player demographics that are associated with addiction, it will be possible to develop more accurate models for predicting and preventing addiction.
• Use of big data and machine learning techniques: With the increasing amount of data available on players' in-game behavior and demographics, big data and machine learning techniques can be used to analyze and make predictions on addiction.
• Development of intervention and prevention strategies: Based on the results of the research, recommendations could be made for intervention and prevention strategies for individuals at risk of addiction, such as providing support and resources to help them manage their play time and reduce the risk of addiction.
• Collaboration with game developers: To have a broader impact, the research should include collaboration with game developers to design games that are less likely to lead to addiction. Also, games that are developed to be non-addictive could be used as a
preventive measure.
• Finally, it is important to note that game addiction is a complex and multi-factorial problem that requires a multi-disciplinary approach, therefore it's important to keep in mind that these recommendations should not be considered as the only solutions.
6.4 Implication for Further Research
In previous works, game addiction level finding is not much difficult, but now a days the strategy is changed so the addiction level is also changed. From this work, can find out the new strategies of the game developers and the addiction level. The previous works showed me a way to start the research work and the testing criteria. I added the new methodologies with the help of psychological knowledge and new testing algorithms to complete my research. And I hope, in future this research will help other people to start their journey & to find out the complex strategies made by game developers. Also, they can easily find out the addiction level by changing or adding new algorithms in their work
REFERENCES
[1] Choi, Dongseong, and Jinwoo Kim. “Why People Continue to Play Online Games: In Search of Critical Design Factors to Increase Customer Loyalty to Online Contents.” CyberPsychology and Behavior Volume 7,2004: 11-24.
[2] Creswell, John W., 2014, Research Design, Qualitative, Quantitative, and Mixed Methods Approaches, Sage Publication Ltd.
[3] Ho, Cheng Hsun, and Ting Yun Wu. “Factors Affecting Intent to Purchase Virtual Goods in online games.”
International Journal of Electronic Business Management, Vol 10, 2012: 204-2012.
[4] Hsu, Chin Lung, and Hsi Peng Lu. “Why do people play on-line games? An extended TAM with social influences and flow experience.” Information & Management 41 Elsevier, 2004: 853-868.
[5] Hsu, Chin-Lung, and Hsi-Peng Lu. “Consumer behavior in online game communities: A motivational factor perspective.” Science Direct Computers in Human Behavior, 2007: 1642-1659.
[6] ISO9241. Ergonomics of human system interaction - Part 210: Human-centered design for interactive systems (formerly known as 13407). Switzerland: International Organization for Standardization (ISO), 2009.
[7] Paragian, Yasser. TECHINASIA. 13 March 2014. https://id.techinasia.com/dalam-5-tahun-terakhir-jumlah- pengguna-internet-indonesia-naik-430-persen-grafik/ (accessed September 25, 2015).
[8] Spohn, Dave. Internet Game Timeline. 9 October 2015. http://internetgames.about.com/od/gamingne ws/a/timeline.htm (Accessed October 9, 2015).
[9] Wu, Chao Sen, and Li Fen Tsai. “The Research on Relationship among Online Game Endorsement, Adolescent Involvement and Game Purchase Intention.” International Journal of Management, Economic, and Social Sciences, 2013: 205-206.
[10] Wu, Jiming, and De Liu. “The Effects of Trust and Enjoyment on Intention to Play Online Games.” Journal Electronic Commerce Research Vol 8 No 2, 2007: 128-140.
[11] Yee, Nick. “Motivation for Play in Online Games.” Cyber Psychology and Behavior, 2006: 772-775.
[12] Zhang, Fan, and David Kaufman. “Older Adults' Social Interactions in Massively Multiplayer Online Role- Playing Games (MMORPGs).” SAGE Games and Culture, 2015: 1-20.
[13] M. R. Esposito et al., “An investigation into Video Game Addiction in Pre-Adolescents and Adolescents: A Cross-Sectional Study,” Medicina, vol. 56, no. 5, p. 221, May 2020, doi: 10.3390/medicina56050221.
[14] E. Novrialdy, “Kecanduan Game Online pada Remaja: Dampak dan Pencegahannya,” Buletin Psikologi, vol. 27, no. 2, p. 148, Dec. 2019, doi: 10.22146/buletinpsikologi.47402.
[15] C. J. Ferguson, Ed., Video Game Influences on Aggression, Cognition, and Attention. Cham: Springer International Publishing, 2018 [Online]. Available: https://link.springer.com/book/10.1007%2F978-3-319-95495-0 [16] M. Ghaffari, M. A. Morowatisharifabad, Y. Mehrabi, S. Zare, J. Askari, and S. Alizadeh, “What Are the Hemodialysis Patients’ Style in Coping with Stress? A Directed Content Analysis,” International Journal of Community Based Nursing and Midwifery, vol. 7, no. 4, pp. 309–318, Oct. 2019, doi:
10.30476/IJCBNM.2019.81324.0. [Online]. Available: https://www.ncbi.nlm.nih.gov/pmc/articles/PMC6779919/.
[Accessed: Sep. 04, 2020]
[17] S. Karaca, A. Karakoc, O. Can Gurkan, N. Onan, and G. Unsal Barlas, “Investigation of the Online Game Addiction Level, Sociodemographic Characteristics and Social Anxiety as Risk Factors for Online Game Addiction in Middle School Students,” Community Mental Health Journal, vol. 56, no. 5, pp. 830–838, Jan. 2020, doi:
10.1007/s10597-019-00544-z.
[18] F. D. Keya, M. M. Rahman, M. T. Nur, and M. K. Pasa, “Parenting and child’s (five years to eighteen years) digital game addiction: A qualitative study in North-Western part of Bangladesh,” Computers in Human Behavior Reports, vol. 2, Aug. 2020, doi: 10.1016/j.chbr.2020.100031. [Online]. Available:
https://eds.a.ebscohost.com/eds/detail/detail?vid=0&sid=423c8a4c-c044-4646-ac9e-c7586b456463%40sdc-v- sessmgr02&bdata=JkF1dGhUeXBlPWlwLHNoaWImc2l0ZT1lZHMtbGl2ZSZzY29wZT1zaXRl#AN=S245195882 0300312&db=edselp. [Accessed: Feb. 17, 2021]
[19] S. Karaca, A. Karakoc, O. Can Gurkan, N. Onan, and G. Unsal Barlas, “Investigation of the Online Game Addiction Level, Sociodemographic Characteristics and Social Anxiety as Risk Factors for Online Game Addiction in Middle School Students,” Community Mental Health Journal, vol. 56, no. 5, pp. 830–838, Jan. 2020, doi:
10.1007/s10597-019-00544-z.
[20] D. D. K. S. Karunanayake, R. A. A. R. Perera, and N. D. U. Vimukthi, “Impact of Mobile Phone Game Addiction on Sri Lankan Teenagers: An Exploratory Study,” Asian Journal of Education and Social Studies, pp. 61–72, Dec.
2020, doi: 10.9734/ajess/2020/v13i430343.
[21] F. D. Keya, M. M. Rahman, M. T. Nur, and M. K. Pasa, “Parenting and child’s (five years to eighteen years) digital game addiction: A qualitative study in North-Western part of Bangladesh,” Computers in Human Behavior Reports, vol. 2, Aug. 2020, doi: 10.1016/j.chbr.2020.100031. [Online]. Available:
https://eds.a.ebscohost.com/eds/detail/detail?vid=0&sid=423c8a4c-c044-4646-ac9e-c7586b456463%40sdc-v- sessmgr02&bdata=JkF1dGhUeXBlPWlwLHNoaWImc2l0ZT1lZHMtbGl2ZSZzY29wZT1zaXRl#AN=S245195882 0300312&db=edselp. [Accessed: Feb. 17, 2021]
[21] E. J. Lee, A. K. Chang, and Y. C. Chung, “Socioecological Factors Affecting Fluid Restriction Adherence Among Korean Patients Receiving Hemodialysis: A Qualitative Study,” Journal of Transcultural Nursing, vol. 32, no. 3, pp.
239–247, May 2020, doi: 10.1177/1043659620919162.
[22] Z. W. Y. Lee, C. M. K. Cheung, and T. K. H. Chan, “Understanding massively multiplayer online role‐playing game addiction: A hedonic management perspective,” Information Systems Journal, Jun. 2020, doi:
10.1111/isj.12292.
[24] L. McMichael et al., “Parents of Adolescents Perspectives of Physical Activity, Gaming and Virtual Reality:
Qualitative Study,” JMIR Serious Games, vol. 8, no. 3, p. e14920, Aug. 2020, doi: 10.2196/14920.
[25] Z. Rezaei, A. Jalali, R. Jalali, and B. Khaledi-Paveh, “Psychological problems as the major cause of fatigue in clients undergoing hemodialysis: A qualitative study,” International Journal of Nursing Sciences, vol. 5, no. 3, pp.
262–267, Jul. 2018, doi: 10.1016/j.ijnss.2018.07.001.
[26] E. Unsal Avdal, İ. Ayvaz, B. N. Özgursoy Uran, J. G. Yildirim, F. Sofulu, and G. Pamuk, “Opinions of hemodialysis and peritoneum patients regarding depression and psychological problems which they experience: A