This project entitled "Finding the optimum light intensity to obtain maximum egg production in the poultry industry", submitted by MD Nwoshad Alam Chowdhury and MD ABDULLAH AL MASUD to the Department of Computer Science and Engineering, Daffodil International University, has been accepted as satisfactory for partial fulfillment of the requirements for the degree of B.Sc. Department of Computer Science and Engineering Faculty of Natural Sciences and Information Technology Påskelilje International University. We are truly grateful and wish our deep indebtedness to Dr. Fizar Ahmed, Assistant Professor, Department of CSE Daffodil International University, Dhaka.
With population growth, the poultry industry is also growing to increase egg production. Therefore, maximum egg production in the poultry sector will be beneficial for both sellers and consumers. There are some important factors such as feed consumption, water intake, light intensity, disease, environmental factors, parasite infestation and numerous management measures that can affect egg production.
So this work is focused on the influence of light intensity to obtain maximum egg production. Therefore, we observed egg production in layers of birds for four weeks in a light-controlled house and collected the value of light intensity for an average duration of 6-8 hours each day. We also increased and decreased the light intensity after 3-4 days, respectively, to monitor egg production at different light intensities.
So, our data set contains light intensities along with dates and times and for observation we developed a web application and through the web application we recorded egg production per day with respect to a specific date and we also observed that when light intensity remains 5-15 lux the egg production is higher than light intensity 15-30 lux.
Introduction
- Introduction
- Rational of the Study
- Research Questions
- Expected Outcome
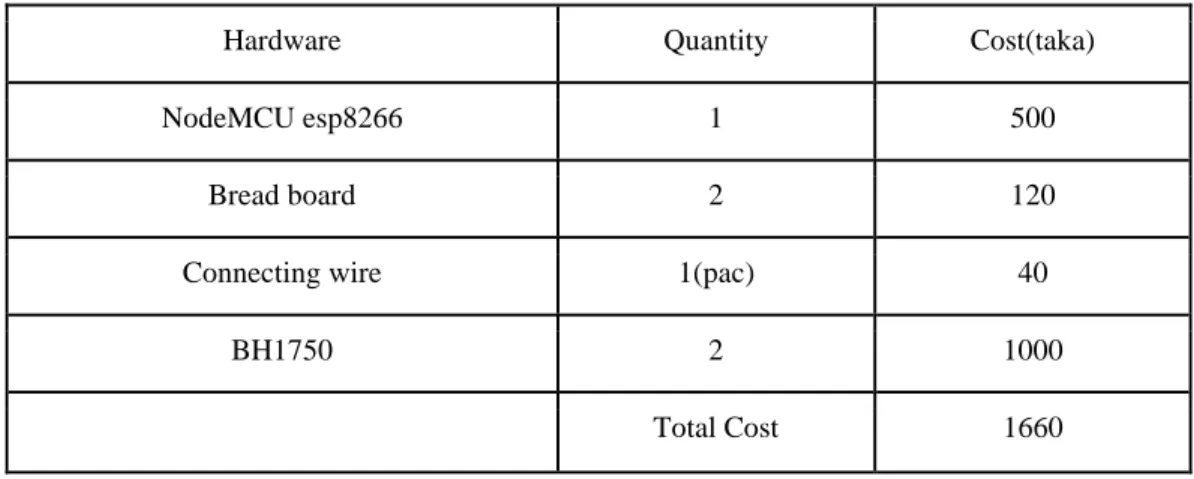
- Project Management and Finance
So we need to find out the optimal value of light intensity in poultry farms. So we were motivated to find out how to achieve optimal light intensity for maximum egg production by observing the layers. There are so many disadvantages we have faced while collecting data because we have had so many difficulties to set up the sensors and to maintain the light intensity.
Our main motive was to find optimal light intensity in the poultry industry to get maximum egg production. By applying surveillance based regression, we can predict the value of light intensity for maximum egg production that is approximately optimum. Through this project, a seller can benefit from using the application and a seller will also be able to sort out the optimum light intensity for his poultry farm to get maximum egg production.
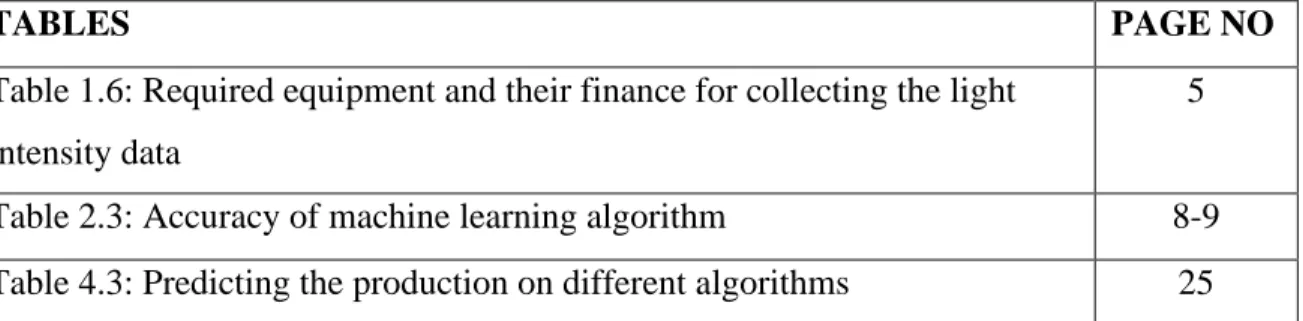
To collect the light intensity values we needed some equipment such as light intensity sensors, NodeMCU esp8266 to operate the sensors and communicate with the database. As shown in Table 1, the BH1750 is a light intensity sensor that can measure the light intensity in lux, and the range it can measure is between 0 and 57000 lux.
Background
- Terminologies
- Related Works
- Comparative Analysis and Summary
- Scope of Problems
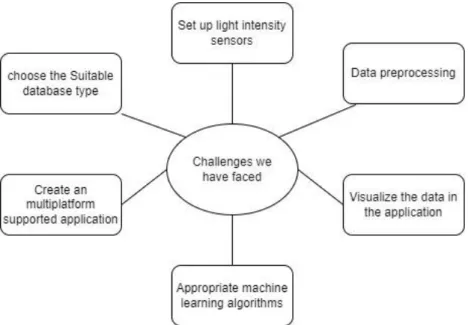
- Challenges
Male turkeys raised in 100 lux light had lower semen volume than those raised under 6.5 lux [16]. Similarly, chicks reared under 150 lux light had lower body weights compared to those reared under 5 lux [17]. We observed about 7-8 hours for each day and initially we kept the light intensity around 10-20 lux.
For the range of light intensity 10-20 lux, we observed that the average egg production was between 235-250. The reduced the value of light intensity in the last stage and it was between 5-7 lux. For the range of light intensity between 5-7 lux, we noticed that the average production increased between 260-275, which was our expected outcome.
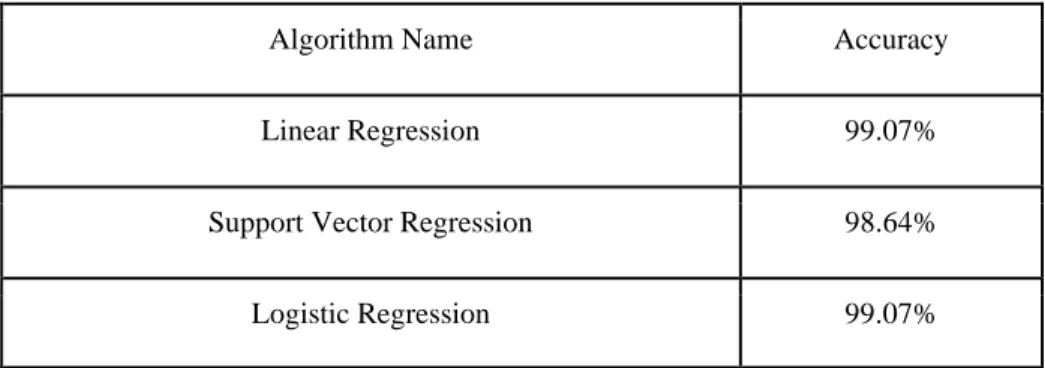
Then move on to the machine learning approach and we tried classification algorithms and for features we used the value of lux, egg production and duration which we checked and for level we categorized our outcome like good, bad and average and we applied various classification algorithms such as SVC (Support Vector Classifier), Random Forest Classifier, KNN Classifier and Decision Tree. Then we tried regression analysis by removing the category and took features as average light intensity value with its duration and labeled as our production. Then we used various regression algorithms, such as linear regression, logistic regression, SVR (Support Vector Regression) and random forest regression, and the accuracy of our algorithm is between 98-99% (shown in Table 2), which is better than classification analysis .
We also predicted different light intensities between 5-30 lux for different algorithms and approximately every time Linear Regression and Random Forest Regression provide us the number of productions approximately similar to our data set. We couldn't figure out the perfect strategy while starting our research work, so we made a plan and divided each individual topic into sub-category and what helps us to do this research work faster. We faced a big problem while preprocessing the data because for the first time we chose mySQL as our database but maintaining such a large amount of data in mySQL creates more complexity for us and firebase helps us reduce this complexity even though it is a non-sequential database as well as free of hosting.
While we were ready to create our application using Netbeans, we have faced more and more complexity because for each device it works properly and programming and designing in Netbeans costs more time, so Node js provides us a solution though PWA ( Progressive Web App) . In our application, data visualization was the most difficult part because we have used d3.js for data visualization in our application and also there had to be changes in our dataset, but through d3 documentation and updating the changes of in our data we have overcome this problem. Applying machine learning algorithms was a big challenge for us, because first we tried classification analysis where the accuracy was not good either.
Research Methodology
- Research Subject and Instrumentation
- Data Collection Procedure
- Statical Analysis
- Applied Mechanism
- Implementation Requirements
- Experimental Setup
- Experimental Result and Analysis
- Result Discussion
We need to convert the time into numeric form which is in string format to calculate the duration. After converting the hours and minutes into numerical form, we have subtracted the end time from the start time and thus obtained the duration of the light intensity value, the recording time. In this research we not only applied supervised machine learning approaches but also created a PWA (Progressive Web Application).
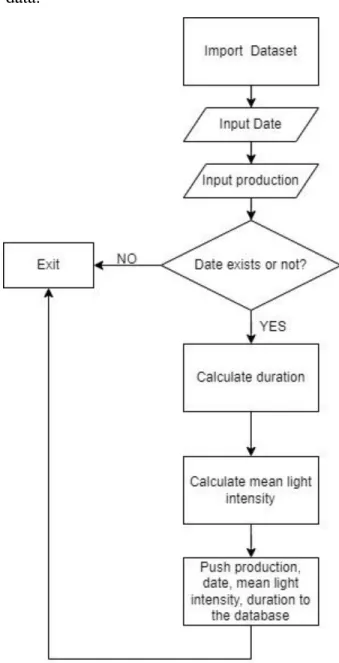
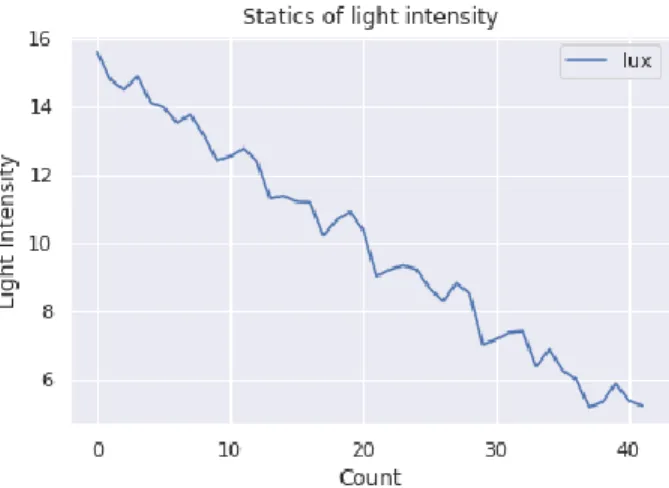
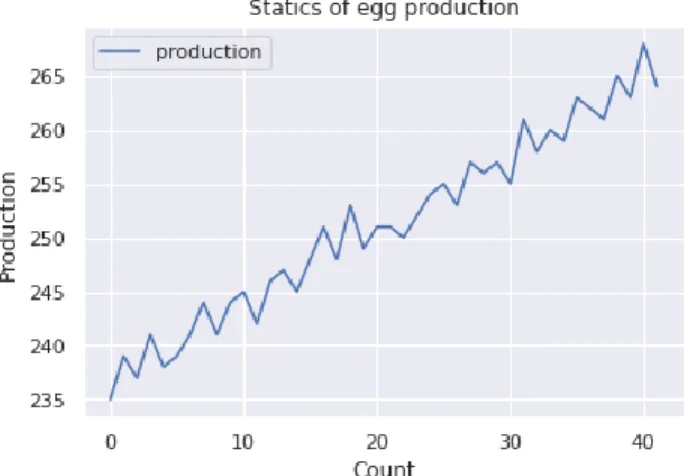
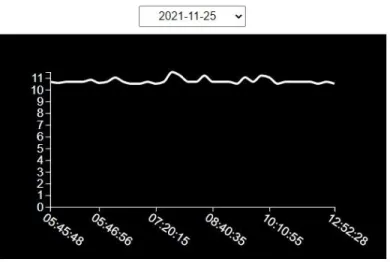
As we collect the data set to monitor it in real time, we have visualized the light intensity value with respect to time. For machine learning approaches we have changed our data structure and the example is given in figure 3.2.2. For preprocessing the data for machine learning and further analysis we need to do the following steps as figure 3.3.2.
We have also taken the date to check if the date exists or not. After obtaining the average values of light intensity for each date along with egg production, we have visualized them graphically to analyze them as shown in figures 3.3.3 and 3.3.4. NTP client library is used to get date and time from ntp server protocol and using BH1750 library we got data from light intensity sensors.
To create our application we chose node js framework which is based on JavaScript and used for back-end development. We chose react js library for our application and d3 js library to visualize our data. By using react js together with d3 js we achieved real time visualization when data changes.
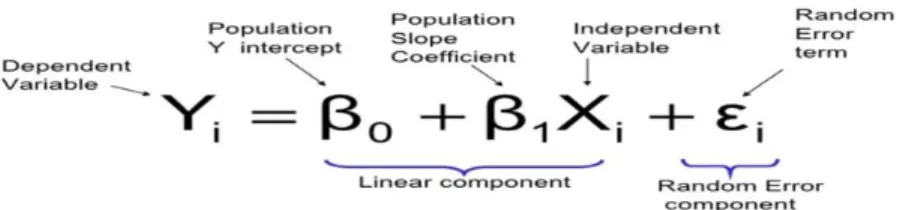
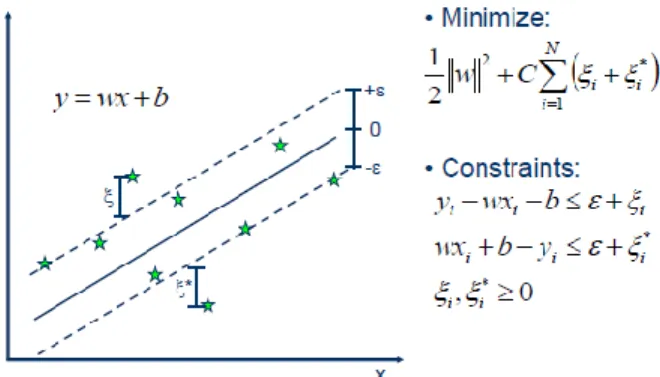
We created a model using machine learning techniques to predict maximum egg production. There are three broad areas of machine learning and among them we chose the supervised learning approach because of its compatibility. We applied linear regression, logistic regression, support vector regression, and random forest regression models.
There is no squared value in our data set, so we have calculated the accuracy using the mean absolute error which formula is given in figure 3.4.7. Soon our data increased and our accuracy increased a little and the result is that we have to reform our data.
Impact on Society, Environment and Sustainability
Impact on Society
Ethical Aspects
Sustainability Plan
Summary, Conclusion Recommendation and Implication for Future Research
Summary of the Study
Conclusion
Implication for Future Study
Abdulla Effect of photoperiod amino acid and tryptophan supplementation on pineal gland hormone (melatonin) and its relationship to performance in local strain. The effect of different light intensities on egg production of white single-comb hens. Feddes Effects of light intensity and photo-age scheduling on sexual maturity, carcass traits, ovary morphology and first-egg parameters in the rearing broiler chicken.
Cecil Effect of light intensity during the breeder period on sperm production of low-weight and normal-weight breeder turkeys. Classen Growth, body composition and plasma androgen concentration of male chicks exposed to different regimes of photoperiods and light intensity. Mench The effect of light intensity on behaviour, eye and leg health and immune function in broilers Poult.
Berckmans Modeling the dynamic activity of broilers in response to stepwise changes in light intensity Appl.