This project titled "Performance Analysis of VoIP Network Using QoS Parameters" submitted by Md.Nazmul Hussain, Md.Liakat Ali and Belayet Hossain to the Department of Electronics and Telecommunication Engineering, Daffodil International University , was accepted as satisfactory for the partial fulfillment of the requirements for the degree of B.Sc. This Project entitled “Title”, submitted by *Name1* and *Name2* to the Department of Electronics and Telecommunications Engineering, Daffodil International University, has been accepted as satisfactory in partial fulfillment of the requirements for the degree of B.Sc.
Reasons for VoIP Deployment
Lower Cost to Consumers
Increased Functionality
Incoming phone calls can be automatically forwarded to the VoIP phone, regardless of where the phone is connected on the network.
Flexibility
For example, in a DSL network it is a DSLAM; in a cable network, a CMTS. The Access Concentrator can also include the Access Gateway functionality, for example a next generation DLC that combines DSLAM capability with direct POTS termination. It shows the trends for the various QoS parameters for the duration of the call.

VOIP PRINCIPLE AND PROTOCOLS 6-17
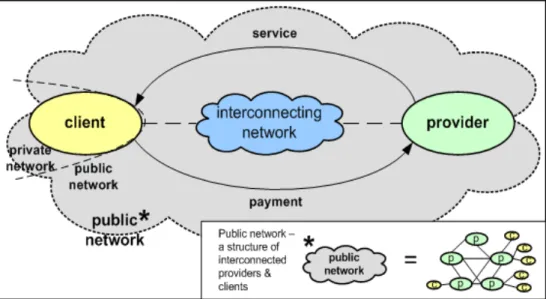
Overall Architecture Public Network
Consequently, a public network could be said to be a collection of interconnected clients and providers. It is part of the client's (may also be part of the provider's) network, which is managed by the client and is not freely accessible from the public network.
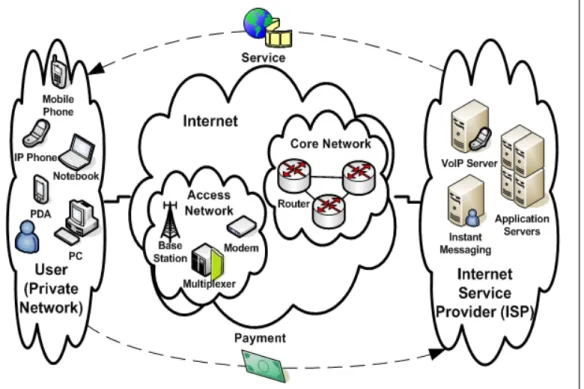
VoIP Next-Generation Network Architecture
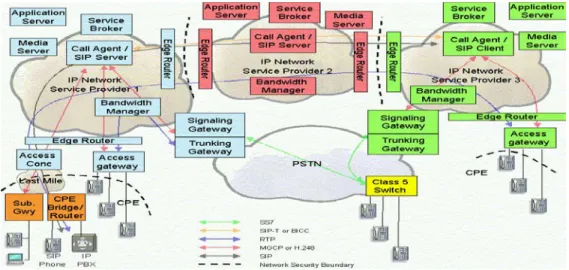
Many different services can be offered on a public IP network – WWW, Instant Messaging, email, VoIP, etc. Service Provider 3 provides local access as an LEC, but only supports POTS (plain old telephone service) phones that have an Access Use Gateway.
Network Components
- Call Agent/SIP Server/SIP Client
- Service Broker
- Application Server
- Media Server
- Signaling Gateway
- Trunking Gateway
- Access Gateway
- Access Concentrator
- Bandwidth Manager
- Edge Router
- Subscriber Gateway
- Bridge/Router
- IP Phone/PBX
The Call Agent/SIP Server/SIP Client resides in the service provider's network and provides call logic and call control functions, typically maintaining call status for each call in the network. The Signaling Gateway resides in the service provider's network and acts as a gateway between the call agent signaling and the SS7-based PSTN. The Trunking Gateway resides in the service provider's network and acts as a gateway between the provider's IP network and the TDM (Time Division Multiplexing) based PSTN.
The access concentrator resides in the service provider's network and terminates the WAN connections used over the "last mile" at the service provider's end. The bandwidth manager resides in the service provider's network and is responsible for providing the required QoS from the network. An edge router is located in the service provider's network and routes IP traffic to the carrier's backbone network.
Protocols
- H.323
- IP Multimedia Subsystem (IMS)
- Media Gateway Control Protocol (MGCP)
- Session Initiation Protocol (SIP)
- Real-time Transport Protocol (RTP)
- Session Description Protocol (SDP)
- Skinny protocol
- Skype protocol
MGCP uses the Session Description Protocol (SDP) to specify and negotiate the media streams to be sent in a calling session and the Real-time Transport Protocol (RTP) to frame the media streams. The Call Volume graph displays a summary of the calls that occurred during the period selected in the calendar. Each individual QoS value graph in the graph can be clicked to view details of the calls that contributed to that QoS value.
You can click on each individual quality trend chart in the chart to view details about the total number of calls for the selected time period. You can click on each individual chart in the graph to view details about the total number of calls for the selected time period. To the right of the call trend graph, the details of the call and the participants in the call are displayed.
ISSUES IN A VOIP NETWORK 18-27
Choice of Signaling Protocol
The choice of protocol to use in a service provider's network depends on the range of services offered and the equipment available to provide those services.
Security
Denial of Service
Theft of Service
Invasion of Privacy
Quality of Service
Reliability / Availability
Lawful Interception
Call details – a tap in which details of calls made and received by a subscriber are passed to law enforcement agency. Referred to as pen and trap register and trail in USA). Call Content – a tap in which the actual content of a call is passed to a law enforcement agency. The suspect must not discover the faucet, so the tap must occur within the network and not at the subscriber's gateway.
Also, the faucet may not be detected by any changes in timing, feature availability, or functionality. It is the responsibility of the telecommunications carrier that initiates or terminates the calls to ensure lawful interception.
Emergency and Operator Services
Call Routing and Number Plans
Firewall and NAT traversal
Billing and Reconciliation
Network Interconnection
Migration Path
OSS Support
Bandwidth Utilization
Fax, Modem and TTY support
Auto-configuration
Helps to find out the traffic details (Bandwidth Utilization) of the network managed by VQManager in a specific time interval as set in the calendar. In Sniffer interface, it is the first user interface that opens in the call tab which shows the details of the active calls taking place in the network. This option is found in the top left of the UI just below the line of tabs.
Information such as the Initiator of the call, call start time, Duration, Status Code and MOS of the call are displayed in the table by default. This list can be sorted by ascending or descending order of the call initialization time and other column fields. Click on the lens icon found to the right of the list's header.
PERFORMANCE MEASUREMENT OF VOIP
QoS Parameters
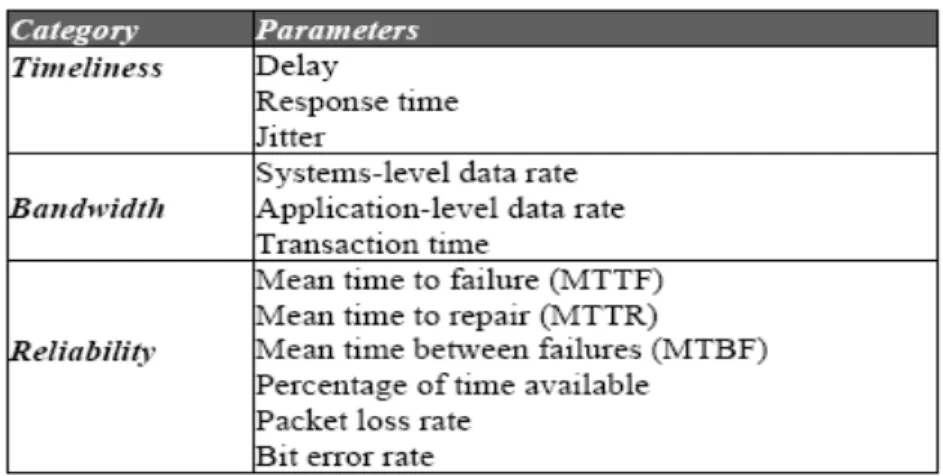
When providing QoS for VoIP, researchers have come up with some QoS parameters to consider. In general, the focus of this paper is on network QoS based on the QoS framework as proposed by [8]. This simply means that the analysis that has been performed is aimed at assessing the network environment in which VoIP communication takes place.
There are several QoS parameters identified to be implemented in this study. In our analysis, three QoS parameters were selected, namely delay, jitter and packet loss rate. It should be noted that these QoS parameters have also been adopted in a number of previous studies and [27].
VoIP Quality Metrics
- Latency
- Jitter
- Packet loss
The main reason for this choice is that the study focuses on the performance of VoIP communication over different network conditions and environments, and thus the time and reliability will be the main concerns for evaluation. The results of studies conducted by also showed that high delay and high delay variability (jitter) were experienced by a large number of Internet paths leading to poor VoIP performance. Packet loss due to congestion is the loss of packets along the data path, which severely degrades voice quality.
Packet loss occurs frequently in data networks, but many applications are designed to provide reliable delivery by using network protocols that request a retransmission of lost packets (e.g., TCP [7]). Voice traffic can tolerate less than a 3 percent packet loss before callers feel noticeable gaps in conversation. At the same time, data applications are also prioritized and assured of their share of network resources.
Monitoring VoIP Vital Parameters
- Call Volume Graph
- Voice Quality Graph
- Configure QoS
- Call Quality Trend
- Call By Status
- Traffic Monitor Graph
- Active Calls Summary
- Calls Report
- Call Details
- CDR Interface - Call Details
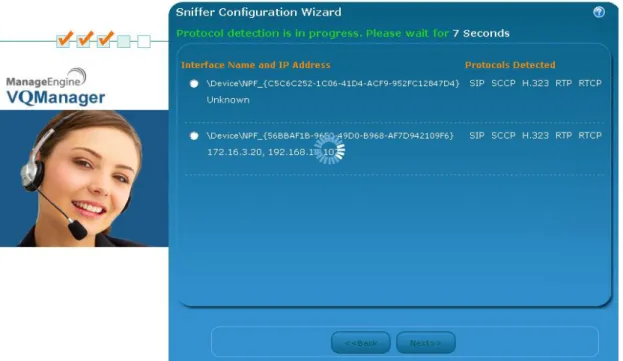
Here we can see that the selected ports of the protocols and the options supported by the software. When these associated numbers are clicked, you can see the details of the respective calls. When the linked percentage for the parameter is clicked, you can see the information summary for the respective calls.
To view the additional columns, click on the column selector icon present at the top right of the 'Active Calls' table. Clicking on any initiator of a call in any of the call lists will bring you to the details of that particular call. This UI shows a graphical display of the call QoS trends, participating endpoint details, CODEC details and a pictorial representation of the packets exchanged during the call.
When you click the View Trend link found under the participant name, you can view individual QoS trend graphs for each participant during the call. A call flow ladder diagram provides a pictorial representation of the packets exchanged during the initiation, progression, and termination of a call.

VoIP R-Factor and MOS
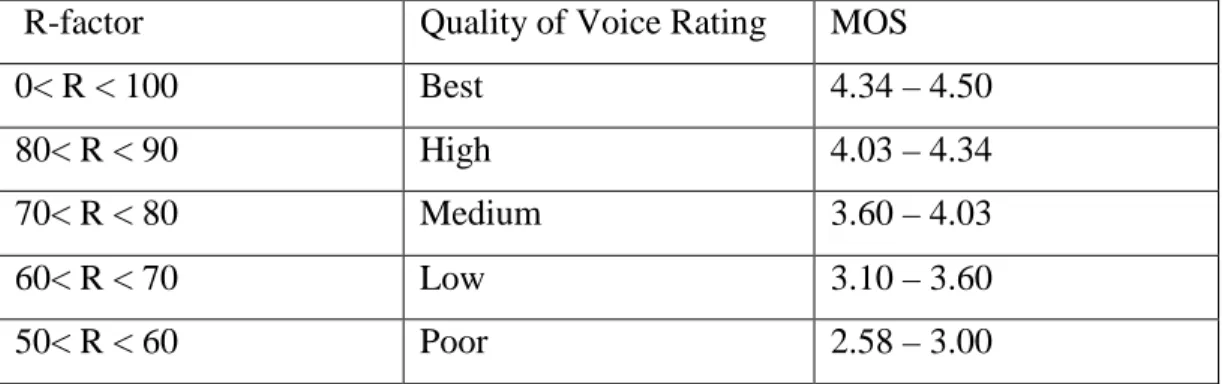
MOS: A value is derived from the R-Factor per ITU-T Recommendation G.10 which measures VoIP call quality. Packets may be lost in the network or dropped by the playout buffer due to large delay jitter. The ITU-T E-Model [6] is an analytical model of voice quality that can be used to estimate the relative voice quality between two connections.
E-Model can be used to calculate the R factor which is a simple measure of sound quality ranging from a best case of 100 to a worst case of 0. Relationship of R factor values to MOS and categorization typical R factor values are presented in Tab.1. Packets that do not arrive in time for playback may be considered lost; therefore this effect is sometimes called loss of nervousness.
The E-model, a computational model for use in transmission planning
- Calculation of the transmission rating factor
- Quality measures derived from the transmission rating factor
If the induced jitter value exceeds the size of the dejitter buffer, the VoIP packets will not arrive in time for playback and the quality of the playback signal will decrease. Further, detailed guidance on the correct use of the E-model - as described in this ITU-T Recommendation - is given in ITU-T Recommendation G.108 [36]. The E-model is based on the equipment depreciation method of previous transmission classification models.
The result of each calculation with the E-model in a first step is a transmission value factor R, which combines all transmission parameters relevant to the connection under consideration. The transmission value factor R can be in the range of 0 to 100, where R = 0 represents extremely poor quality and R = 100 represents very high quality. The Mean Opinion Score (MOS) in the scale 1-5 can be obtained from the R factor using the formulas:.
Defining Threshold Values
Summary Report for deployment of a VoIP Network
This paper provides an overview of the approaches used to assess the quality of services in the realization of VoIP voice applications for the implementation of a quality network. We also theoretically learned the basic mechanism for calculating VoIP Quality of Service using the ITU E model. SNMP : Simple Network Management Protocol SRTP : Secure Real-time Transport Protocol SIP : Session Initiation Protocol.
8] Markopoulou A.P., Tobagi, F.A., en Karam, M.J., “Assessing the Quality of Voice communications over Internet Backbones”, IEEE/ACM Transactions on Networking, Vol.11, nr. Onderzoek naar vertragingspatronen van gewogen spraakverkeer van eind- to-End Users on the VoIP Network”, Int. 28]Miloucheva, I., Nassri, A., en Anzaloni, A., “Automated Analysis of Network QoS Parameters for Voice over IP Applications”, D41 – 2e Inter-Domain Performance and Simulation Workshop (IPS 2004).
CONCLUSION 55
VOIP PRINCIPLE AND PROTOCOLS