Viscosity coefficients A and B were determined from viscosity data based on Jones Dole. The effects of electrolytes on the structure of water and aqueous solutions of carbohydrates were interpreted in terms of apparent molar volumes, viscosities and coefficients of viscosity (A and . - B) and thermodynamic parameters (itG", AH, \S").

List of the symbols and abbreviations
Electrolytes
It regulates the acidity (pH) of the blood and helps regulate the level of oxygen in the blood. Chloride is the most important anion found in the fluid outside the cells and in the blood.
Carbohydrates
Carbohydrate catabolism and Glucose: Carbohydrates provide energy for the brain in the form of glucose. They are therefore acetals, formed from two monosaccharides by the water in the presence of an acid or by enzymes yielding two monosaccharides [4].
OH HOHO
Sucrose
Maltose
Electrolyte-Carbohydrate interaction
The expansion of the water molecule upon freezing allows ice to float on liquid water. The structural changes in the solvent can be crucial for the study of the role of water in the biological system.

The phenomena of solute-solvent interaction
It has also been shown to depend on the distance of closest approach of the ions in the ion pairs. This indicates that several of the cations are solvated or interact strongly with the solvent molecules.
Physical Properties and chemical constitutions
Purely constitutive properties: The property, which depends entirely on the arrangement of the atoms in the molecule and not on their number, is called a purely constitutive property. For example, optical activity is the property of the asymmetry of the molecule and occurs in all compounds with an overall asymmetry.
Density
The density of the liquid can be determined either by weighing a known volume of the liquid in a density bottle or picnometer or by the buoyancy method based on "Archimedes' principle". In our present study, the densities of the pure components and the mixture were determined by weighing a specific volume of the respective liquid in a density bottle.
Density and temperature
Theoretical background Chapter II substance to the weight of an equal volume of water at the same temperature (d'04). The absolute density of a given substance at a temperature of t°C is equal to the relative density multiplied by the density of water at that temperature.
Molarity
Molar volume of solutions
The positive deviation in the volume, i.e. the expansion of the volume is explained by the breakdown of the association mode through H-bonding of the associated fluids. Negative deviation in molar volume, i.e. Volume shrinkage has been thought by many observers to result from i) compound formation via association, ii) reduction of the intermolecular distance between interacting molecules, iii) interstitial accommodation of smaller species in the network structure of larger species, and (iv) ) change in the larger structure of one of the substances forming the mixture.
Apparent/ partial molar volume
The concentration dependence of the apparent molar volume of electrolytes has been described by the Masson equation [70], the Redlich-Mayer equation [73] and the Owen-Brinkley equation [72]. For dilute solutions, the limiting law for the concentration dependence of the apparent molar volume of electrolytes is given by the equation.
Viscosity
Theoretical Background Chapter II, where 0 indicates the volume fraction of the dissolved particles and flo is the viscosity of the solvent. In the concentrated solution region (up to 1OM), several features of the viscosity of electrolyte solutions have been noted.
Viscosity and temperature
Here ri represents the ratio of the viscosity of the solution at a given concentration relative to that at saturation at the same temperature and C represents the ratio of the mole fraction of the solute at given concentration to that at saturation at the same temperature, A "and B" are experimentally determined constants. Theoretical background Chapter II It has been proposed that before a molecule can participate in fluid flow, it must acquire sufficient energy 'B' to push aside the molecules that surround it. At elevated temperatures, the kinetic energy of the molecules increases at the expense of intermolecular forces, which progressively decrease.
Therefore, the molecules of a liquid at high temperature offer less resistance to the flow and therefore less viscosity. Viscosity also depends on pressure, molecular weight or mass of the molecule, molecular size and especially chain length, the size of intermolecular forces, such as association in pure liquids.
Viscosity as a rate process
As the temperature increases, the number of such molecules increases in proportion to the Boltzmann factor e T as in Equation 2.41. Where AG' is the free energy of activation per mole for viscous flow, Vm is the molar volume for pure liquids or solutions, and h, N, R, and T have their own meanings. The activation process to which AG# refers cannot be precisely described, but it generally corresponds to transitions of the system into some relatively favorable configuration from which it can then readily transition to the end state of the molecular process.
In normal liquids, the activation step can e.g. be the creation in the body of liquid of a vacant space or holes in which an adjacent molecule can move. AH# and AS# respectively the activation enthalpy per mol for viscous flow and AS" is the activation entropy.
Different thermodynamic parameters
- Free energy of activation (AG) for viscous flow
- Enthalpy of activation (AH") for viscous flow
- Entropy of activation (ASN) for viscous flow
Assuming that AH" and AS# are nearly independent in the temperature range studied, a plot of i lVm / Nh against lIT will give a straight line with slope = AH' AS#. In view of the high activation energy for the flow of associated fluids, it is a striking fact that the activation free energy shows no such abnormality. The explanation is that AG# corresponds to (SM-I" - TAS) and that the high value of the activation enthalpy AH# is compensated by the large positive value of AS #, so AG# remains normal.
If, as suggested above, the bound liquid unit is a single molecule and the formation of the activated state involves a number of hydrogen bonds, it is clear that the entropy of the activated state will be significantly greater than that of the initial state. the state. In other words, the activation entropy of ASO for flow should be relatively large positive, consistent with the experimental fact that AG' is normal regardless of the volume of AH# for associated fluids.
General Techniques
Materials
Preparation and Purification of Solvent
Apparatus
Conductance measurements
Density measurements
The partial molar volumes of the solute and solvent can be obtained from the density measurement using the following equation. The viscometer was then clamped vertically in the thermostatic water bath so that the top mark of the top bulb was well below the water level. With the aid of a pipette filler attached to the narrower limb of the viscometer, water was drawn above the upper mark of
Since the exact viscosity and density of water at different temperatures are known (from the literature), the calibration constant A of the viscometer for different temperatures was obtained using the equation,. By adding the values of the calibration constant, density, and flow time of the experimental solution, the viscosity of this solution was determined using Equation 3.40.
Coefficient A and B determinations
The water from the bulb was then allowed to fall into the capillary and the time of the drop between the two marks was recorded using a stopwatch reading to 0.01 second. To check the reproducibility of the run time, the reading at each temperature was repeated three or four times, keeping the temperature at the same value.
Thermodynamic parametes
3.12) NhRT R
Volumetric properties of electrolyte solutions
The density p of binary carbohydrate systems (water, +glucose, -01 . Results and discussion Chapter IV +sucrose and +maltose) are shown in Table 4.1-4.3 at different temperatures. Concentration dependence of 4 v of selected electrolytes in aqueous, aqueous glucose, aqueous sucrose and aqueous maltose solutions (1% (w/v), 5% (w/v) and 10% (w/v)) on temperatures different ones are presented respectively in the figure. Its value increases with increasing electrolyte concentration suggesting that solvent-solvent interactions increase with increasing electrolyte molarity in solution.
The çb values for electrolytes reflect the true volume of the solute and the volume change that occurs from the solute-solvent interactions. The overlap of cospheres of carbohydrate gives negative change in volume due to the relaxation of the electrostricted water molecules from its cosphere to bulk.
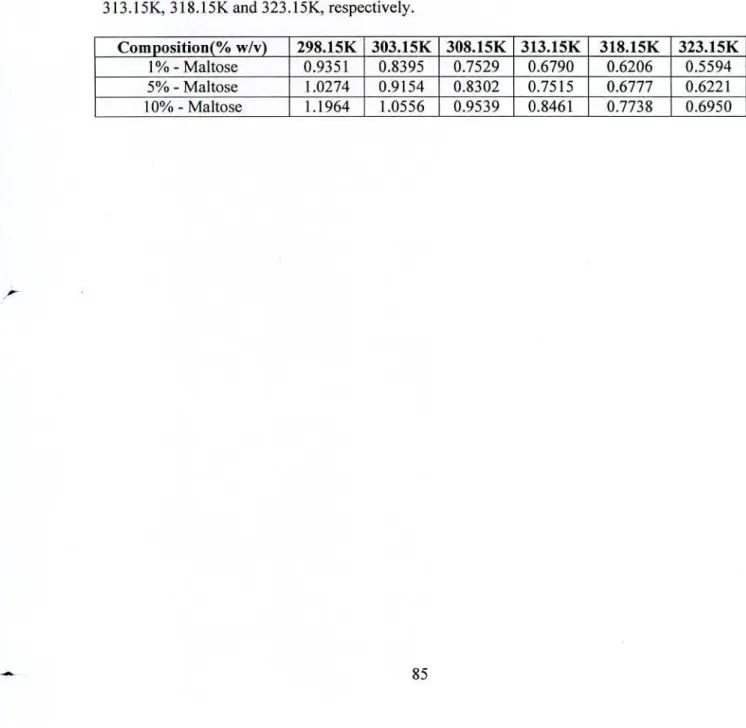
Viscometric properties of electrolyte solutions
There is a significant decrease in the viscosity with the increase in temperature for all studied electrolytes in water and carbohydrate solution systems (shown in Figures 4.82-4.87). To calculate the B-coefficient values, the viscosity data were analyzed in terms of the semi-empirical Jones-Dole equation [106]. Usually, the positive value of the B coefficient corresponds to the structure-making behavior of solutes.
In most cases, the B coefficient for NaCI and KCI at higher carbohydrate composition (5% and 10% carbohydrate) solution system is negative at all temperatures. In most of the cases, the higher positive A values for aqueous and carbohydrate solution of NaCl were observed than KCI.
Thermodynamic properties of binary and ternary solutions
IFIR
Apparent molar volumes (4) were found to be positive for NaCl and KCl in aqueous solution, while negative at 5%. A relatively lower apparent molar volume, 4 , of electrolytes was found in aqueous glucose solutions, aqueous sucrose solutions, and aqueous maltose solutions than in aqueous solutions. The KCI in water, glucose, sucrose and maltose solutions were .. i.] negative, indicating a tendency to break down the structure. v) Carbohydrate viscosity increases with increasing % (w/v) carbohydrate composition.
For NaCl in aqueous and aqueous carbohydrate solution (1% (w/v)), the values of dB are negative, which corresponds to structure-forming behavior. Water and carbohydrate solutions, the values of dB .. are positive, which dT . corresponds to structural break behavior. viii). Y Structural aspects of ion-solvent interaction in aqueous solutions: a proposed picture of water structure" Disc.