IEEE
zyxwvutsrqponmlkjihgfedcbaZYXWVUTSRQPONMLKJIHGFEDCBA
TRANSACTIONS ON BIOMEDICAL ENGINEERING. VOL. 36. NO.zyxwvutsrqponmlkjihgfedcbaZYXWVUTSRQPONMLKJIHGFEDCBA
2 . FEBRUARYzyxwvutsrqponmlkjihgfedcbaZYXWVUTSRQPONMLKJIHGFEDCBA
I Y X Y I83A
Mathematical Model of Cerebral Blood Flow
Chemical Regulation-Part
I: Diffusion
Processes
MAURO URSINO. PATRIZIA DI GIAMMARCO. A N D ENZO BELARDINELLI
Absfracf-This paper proposes a mathematical model \I hich de- scribes the production and diffusion of vasoactive chemical factors in- volved in oxygen-dependent cerebral blood flow (CRF) regulation in the rat.
Partial differential equations describing the relations between input and output variables have been replaced with simpler ordinary differ- ential equations by using mathematical approximations of the hyper- bolic functions in the Laplace transform domain.
This model is composed of two submodels. In the first, oxygen trans- port from capillary blood to cerebral tissue is analyzed to link changes in mean tissue oxygen pressure with C B F a n d arterial oxygen concen- tration changes. The second submodel presents equations describing the production of vasoactive metabolites by cerebral parenchyma, due to a lack of oxygen, a n d their diffusion towards pial perivascular space. These equations have been used to simulate the time dynamics of
mean tissue
zyxwvutsrqponmlkjihgfedcbaZYXWVUTSRQPONMLKJIHGFEDCBA
P,,,, perivascular adenosine concentration, a n d perivas-cular pH to changes in CBF. The present simulation points out that the time dela) introduced by diffusion processes is negligible if com- pared with the other time constants of the system under study.
In a subsequent work the same equations will be included in a model of the cerebral vascular bed to clarify the metabolite role in CBF reg- ulation.
INTRODUCTION
HE earliest doctrine concerning mechanisms regulat-
T
ing cerebral blood flow was proposed by Monro and Kellie in the 18th century [ l ] . Since then many studies have appeared on this subject, but the exact feedback mechanism involved in cerebral regulation has not yet been completely understood. Both myogenic and neuro- genic, as well as chemical mechanisms have been pro- posed to explain the active changes in cerebral vessel di- ameter and the consequent regulation of cerebrovascular resistance (CVR) and cerebral blood flow (CBF).In particular, the chemical theory of blood-flow regu- lation suggests that the caliber of resistive vessels (i.e., small arteries and arterioles) is actively controlled by the concentration of vasoactive substances in the perivascular space. This mechanism is probably involved in the regu- latory response of cerebral circulation when the equilib- rium between the blood-flow oxygen supply and tissue metibolic nced is altered (i.e., during autoregulation, changes in blood oxygen content, the reactive hyperemia
Manuscript received October
zyxwvutsrqponmlkjihgfedcbaZYXWVUTSRQPONMLKJIHGFEDCBA
23. 1987: revised August 12. 1988.The authors are with the Department of Electronics, Informatics. and
IEEE Log Number 882.5092.
System Science. University of Bologna. 1-40136 Bologna, Italy.
following cerebral ischemia, and during functional vaso- dilation). In all these conditions, the aim of the mecha- nism is to achieve tissue homeostasis, i.e., changes in cerebrovascular resistance and blood flow are the means by which factors important in tissue metabolism are con- trolled.
In recent years, evidence has appeared which suggests that changes in blood and tissue oxygen pressure consti- tute a relevant stimulus, able to activate mechanisms reg- ulating blood flow and peripheral vascular resistance. It is known that CBF is greatly increased by a reduction in arterial O2 pressure, while an increase in arterial oxygen content causes significant, although less pronounced, va- soconstriction and a reduction in CBF [2], [3]. Fairchild
et al. [4], in an experimental investigation on the hindlimb of a dog, demonstrated that lack of oxygen plays a major role in the hyperemic response to long-lasting is- chemia.
Two different mechanisms have been proposed to ex- plain the effect of oxygen on vessel diameter and periph- eral vascular resistance:
a direct mechanism, according to which a low
zyxwvutsrqponmlkjihgfedcbaZYXWVUTSRQPONMLKJIHGFEDCBA
Po? value would directly affect the contractile activity ofsmooth muscle, thus causing muscle relaxation and va- sodilation,
an indirect mechunism, mediated by the release of vasoactive substances from hypoxic tissue.
Both mechanisms are probably involved in the active response of peripheral blood vessels to oxygen changes. Nevertheless, some recent experimental findings [2], [5] demonstrate that, at least for pial arteries and arterioles, vasodilation is mainly the result of a tissue hypoxia rather than the consequence of a direct oxygen effect on vascular smooth muscle tension. It is generally assumed that dur- ing any situation of insufficient oxygen supply to tissue, vasoactive metabolites accumulate in neural parenchyma. These metabolites subsequently diffuse toward perivas- cular space where they cause vascular smooth muscle re- laxation, thus contributing to raising CBF.
Several substances normally involved in cerebral me- tabolism have recently been proposed as possible media- tors between tissue oxygen need and CBF ( K + , COz, H',
CaL +, osmolality, prostaglandins, and adenosine) [3],
[6], [7]. The most important of these substances seem, at present. to be adenosine and H + . It has been experimen-
184
zyxwvutsrqponmlkjihgfedcbaZYXWVUTSRQPONMLKJIHGFEDCBA
IEEE TRANSACTIONS ON BIOMEDICAL ENGINEERING, VOL. 36, NO. 2, FEBRUARY 1989tally demonstrated that a significant reduction in cerebral pH and a significant increase in cerebral adenosine con- centration take place when oxygen delivery to tissue is insufficient; this is due to the decrease in the oxidative phosphorylation rate and simultaneous accumulation of
lactic acid
zyxwvutsrqponmlkjihgfedcbaZYXWVUTSRQPONMLKJIHGFEDCBA
[8]-[ 141. Moreover, experimental evidence re-veals that an increase in H + and adenosine perivascular concentration have a strong vasodilating effect for both
pial arteries
zyxwvutsrqponmlkjihgfedcbaZYXWVUTSRQPONMLKJIHGFEDCBA
[ 151-[20] and intracerebral arterioles [21].In order to elucidate the relevance of chemical factors in the control of cerebral circulation, we have developed an original mathematical model of chemical, oxygen-de- pendent CBF regulation in the rat which is based on the
release of adenosine and
zyxwvutsrqponmlkjihgfedcbaZYXWVUTSRQPONMLKJIHGFEDCBA
H+
from cerebral tissue. The rathas been chosen as it is the most frequently used animal in physiological experiments; indeed a great number of original results that have appeared in recent years on ce- rebral chemical regulation refer to this animal.
Some mathematical models of local blood-flow regu- lation where the chemical and the myogenic mechanisms are described in detail have been presented in recent years with reference to organs other than the brain, such as the leg’s skeletal muscle [22], [23] or the kidney [24]. A few mathematical models describing autoregulation in the brain have also been published [25], [26]. However, in these last models, changes in the caliber of blood vessels and cerebrovascular resistance are described only empir- ically, independently of the mechanism responsible for these changes.
In the present paper, we present mathematical equa- tions which describe oxygen diffusion from capillary to tissue, the accumulation of vasoactive metabolites in ce- rebral parenchyma, and their diffusion towards perivas- cular space. In a subsequent paper, the reactivity of the cerebral vascular bed to vasoactive metabolites will be analyzed.
We think that mathematical simulation may be very useful to synthesize the large number of different experi- mental results on this subject in recent years, and to gain a deeper knowledge of the mechanisms involved in cere- bral regulation.
OXYGEN TRANSPORT TO TISSUE
We assumed that oxygen diffuses from blood to tissue only through the capillary wall: in other words, the small amount of oxygen that begins to diffuse at the arteriolar level [27], [28], [29] has been neglected. Since the aim of the submodel is not to describe exactly the spatial dis- tribution of tissue oxygen pressure around a cylindrical
capillary, but to reproduce the time pattern of average
zyxwvutsrqponmlkjihgfedcbaZYXWVUTSRQPONMLKJIHGFEDCBA
P , tissue in response to a change in blood oxygen supply, the classical cylindrical configuration of capillary ex- change (Krogh’s cylinder) has been substituted with the simpler configuration of parallel plane layers. The cylin- drical symmetry of Krogh’s model is based on the as- sumption that blood flow in the capillaries is parallel and unidirectional. However, the capillary structure in the brain is probably more complex than that [7]. For in-
stance, if a section plane is used, the capillaries show ran- dom distribution of orientation [30]. In general, the cap- illary geometry is too complex to formulate an exact mathematical model for it throughout the tissue. Parallel plane layers offer the advantage of mathematical simplic- ity, and furthermore, the order of magnitude of the delay introduced by diffusion processes can be estimated quite accurately using these layers. Fig. 1 shows two of these capillary plane layers. It is assumed that each of the two exchanges oxygen with surrounding tissue from both sur- faces. It is also schematized that the whole cerebral par- enchyma is crossed by similar plane layers, with a dis- tance 2d from each other.
The oxygen exchange from blood to tissue is properly described by a system of partial differential equations. These have been approximated with a system of ordinary differential equations in order to have a model with a finite number of state variables.
From the mass balance in a single capillary layer, the
following equation can be written:
zyxwvutsrqponmlkjihgfedcbaZYXWVUTSRQPONMLKJIHGFEDCBA
q c ( f ) c b ( x ,
zyxwvutsrqponmlkjihgfedcbaZYXWVUTSRQPONMLKJIHGFEDCBA
t , - qc(f) c b ( x + dr, t ,( 1 )
where q, (
zyxwvutsrqponmlkjihgfedcbaZYXWVUTSRQPONMLKJIHGFEDCBA
t ) denotes blood flow in a single capillary layer,cb ( x , t ) and P b ( x , t ) are oxygen blood concentration and
pressure at the generic capillary section of coordinate x
(see Fig. l ) , and c,(x, t ) and P,,(x, t ) are oxygen con- centration and pressure in the tissue adjoining the capil- lary wall. The other symbols may be defined as follows:
Ko2 = Krogh’s oxygen diffusion coefficient in the cap- illary wall (ml/min/cm/atm),
h, = capillary thickness,
dS = infinitesimal capillary exchange surface,
dV = infinitesimal capillary volume.
In the present work, oxygen concentration and pressure are related as follows:
Pex = atis& P b = a b c b . ( 2 )
1 / a b and 1 /utiss = oxygen solubility coefficient in blood and cerebral tissue, respectively. 1 /ab must be consid-
ered as an apparent solubility coefficient [31] as it takes oxygen transport by hemoglobin into account. However, the relationship between blood oxygen pressure and blood oxygen concentration is more complex than (2) since it is expressed by the nonlinear oxyhemoglobin dissociation curve. A more accurate description of this curve may rep- resent a subsequent improvement of the present model.
Finally, from (1) and (2) we have
q c ( f ) c b ( x , f, - qc(f) c b ( x + dx, t >
1
a c b ( x 7 t ,
+
d S -2
- Cb(X, t ) - c,,(x, t )[ ; : s = dV-
at
( 3 )
URSINO
zyxwvutsrqponmlkjihgfedcbaZYXWVUTSRQPONMLKJIHGFEDCBA
e! a l . : MODEL OF CEREBRAL BLOOD FLOW REGULATION-IzyxwvutsrqponmlkjihgfedcbaZYXWVUTSRQPONMLKJIHGFEDCBA
I85zyxwvutsrqponmlkjihgfedcbaZYXWVUTSRQPONMLKJIHGFEDCBA
/
zyxwvutsrqponmlkjihgfedcbaZYXWVUTSRQPONMLKJIHGFEDCBA
II
I I
I
I
I I
I
I
/
- - + - - -
/
,/
zyxwvutsrqponmlkjihgfedcbaZYXWVUTSRQPONMLKJIHGFEDCBA
-z- - L
d
zyxwvutsrqponmlkjihgfedcbaZYXWVUTSRQPONMLKJIHGFEDCBA
0'Fig. 1. Geometrical configuration (parallel plane layers) used to describe oxygen exchange between capillary and tissue.
If (3) is integrated between the arterial and venous cap- illary sides (x = 0 and x = L, respectively) and the con- tribution of all capillary layers which supply cerebral tis- sue unit weight is added, we have
in which
q / W = blood flow per cerebral tissue unit weight,
zyxwvutsrqponmlkjihgfedcbaZYXWVUTSRQPONMLKJIHGFEDCBA
c, = cb ( 0 , t ) = oxygen concentration in arterial blood,
c1, = cb ( L , t ) = oxygen concentration in venous blood,
VI
/
W = capillary blood volume per cerebral tissue unitS / W = surface of capillary exchange per cerebral tis-
- 1
cb = jk c b ( x , t ) dr
zyxwvutsrqponmlkjihgfedcbaZYXWVUTSRQPONMLKJIHGFEDCBA
= mean oxygen concentration in- 1
c, =
zyxwvutsrqponmlkjihgfedcbaZYXWVUTSRQPONMLKJIHGFEDCBA
L
ji
c,(x, t ) dr = mean oxygen concentrationin the tissue adjoining capillary wall.
Equation (3 ') describes the mean oxygen exchange through the capillary wall as a function of time. The de- pendence of oxygen venous concentration c, on mean ox- ygen blood concentration ?(, has been assumed as follows:
It is remarkable that, owing to relationship (4), (3') be- comes nonlinear since the input variable q / W is multi-
plied by the state variable Cb.
Equations (3') and (4) describe oxygen transport through the capillary wall. Subsequently, oxygen diffuses from the capillary wall towards the surrounding tissue. According to the previous simplifications, the dependence of tissue oxygen concentration on the coordinate x has been neglected; in other words, the model refers only to the mean values of the different quantities along this co- ordinate.
The oxygen diffusion across tissue is described by the two following partial differential equations:
weight,
sue unit weight,
capillary blood,
c, = h?b h
<
1. (4)in which
at distance
z
from capillary plane layer,-
c ( z , t ) = mean oxygen concentration in cerebral tissue
+ ( z ,
t ) = oxygen flow per tissue unit surface,Ob, = oxygen diffusion coefficient in cerebral tissue
K,?(z,
t ) = tissue oxygen consumption per unit vol-From the previous equations we obtain
( /s
1,
ume in unit time.
Equation ( 5 ) is linear and, therefore, can be studied in the Laplace transform domain. In the following, all Laplace transforms refer to changes of different quantities with re- spect to a hypothetical basal equilibrium condition. The boundary conditions of ( 5 ) have been assumed as follows:
a c ( d , s )
az
- 0~ -
11) at
z
= d ( 7 )where C(z, s ) denotes the Laplace transform of tissue ox- ygen concentration changes at a distance
z
from the cap- illary layer and ?b ( s ) is the Laplace transform of capillary blood oxygen concentration changes. Equation (6) de- scribes oxygen diffusion through the capillary wall. Equa- tion (7) is a consequence of the hypothesized symmetry of capillary layers (Fig. 1).By solving ( 5 ) in the Laplace transform domain, taking into account (6) and ( 7 ) , we have
Po, =
zyxwvutsrqponmlkjihgfedcbaZYXWVUTSRQPONMLKJIHGFEDCBA
v,
Do* ab -
c b ( s )
- -
c,(s) = ?(O, s) = hc atiss
V2 tanh a Doz
( s
+
K,) --+ -
s a hc
I86 IEEE TRANSACTIONS ON BIOMEDICAL ENGINEERING, VOL. 36. NO.
zyxwvutsrqponmlkjihgfedcbaZYXWVUTSRQPONMLKJIHGFEDCBA
2, FEBRUARY 1989in which
zyxwvutsrqponmlkjihgfedcbaZYXWVUTSRQPONMLKJIHGFEDCBA
c,zyxwvutsrqponmlkjihgfedcbaZYXWVUTSRQPONMLKJIHGFEDCBA
( s ) is the Laplace transform of oxygen con-centration changes in tissue adjoining the capillary wall,
whose antitransform is used in ( 3 ' ) , and
zyxwvutsrqponmlkjihgfedcbaZYXWVUTSRQPONMLKJIHGFEDCBA
S / V 2 is the cap-zyxwvutsrqponmlkjihgfedcbaZYXWVUTSRQPONMLKJIHGFEDCBA
-
illary exchange surface per cerebral tissue unit volume.
zyxwvutsrqponmlkjihgfedcbaZYXWVUTSRQPONMLKJIHGFEDCBA
Po, is the Laplace transform of the average
zyxwvutsrqponmlkjihgfedcbaZYXWVUTSRQPONMLKJIHGFEDCBA
Po,
tissue changes, that is, the output variable of the present sub-model.
The oxygen exchange from blood to tissue is thus com- pletely described by ( 3 ' ) and the antitransforms of (8) and (9). The parameter values are reported in Table I, in which subscript n is used to denote a quantity in basal equilib- rium condition, and the term (CMR,) = ( q / W )
,,
(c, -ct,) denotes the normal oxygen consumption rate per unit
weight of cerebral tissue. The value of parameter K , has
been computed by assuming a normal equilibrium mean tissue Po2 of 32 mmHg, deduced from curves reported by
Thews [ 3 11. Most parameters refer to the rat. For the other parameters in Table I (diffusion coefficients, solubility coefficients, specific weight), changes from one animal to another do not seem to be relevant.
Equations (8) and (9) include the meromorphic function tanh a / a . This function has been approximated with a rational function in order to achieve a model with a finite number of state variables. The approximation has been achieved by using the continued fraction expansion [ 3 7 ] , truncated after a finite number of elements, i.e.,
(10)
1
- - -
tanh a
CY CY2
1 +
CY2
3+-
zyxwvutsrqponmlkjihgfedcbaZYXWVUTSRQPONMLKJIHGFEDCBA
5
+
* * *The number of elements in the continued fraction (10) has been chosen so as to reproduce the tissue Po2 time pattern
in response to a step change in cerebral blood flow, with- out significant errors. In particular, if we take tanh C Y / C Y
= 1, this is equivalent to assuming that there is instanta- neous oxygen diffusion across cerebral tissue. On the con- trary, if one takes
(11)
tanh a 3 3
- = - -
CY ~ + C Y ' - - s + K , ..,
3 + - " d'
ob,
the dynamics of tissue Po, is delayed as a consequence of
the period necessary for oxygen to diffuse across the ce- rebral tissue. The addition of further terms in (10) does not cause significant changes in the model response. Con- sequently, (1 1) has been taken in the present work.
With the parameter values reported in Table I, and using (1 l), it is demonstrable that the two transfer functions (8) and (9) can be further simplified without any significant alteration in the model dynamics, as follows:
a) capillary wall permeability, Doz / h c , can be assumed
as infinite,
b) the pole in (11) has a time constant ( T ~ =
d 2 / ( 3 D b ,
+
K, d 2 ) = 0.12s), negligible if compared with the time delays of the system under study.With the previous simplifications, and using ( 3 ' ) and the antitransforms of (8), (9), and ( l l ) , we finally reached
TABLE I
PARAMETER VALUES FOR THE OXYGEN DIFFUSION
= 1.3 * IO-* cmZ/s
= 1 . 6 . 1 0 - 5 c m Z / s
= 1 pm
= 1.5 ml,/mlblood/atm
= 0.024 ml,/ml,,,,/atm = 0.076 mla/g/min
= 1.04 g/cm3
= 1.84
. lo-'
= 1.415 . mm
= 75 ml/min/100 g
= 26 pm
= 1.32 s - '
= 0.16 ml,/mlblood
= 0 . 0 6 mle/mlblmd
= 0.8219
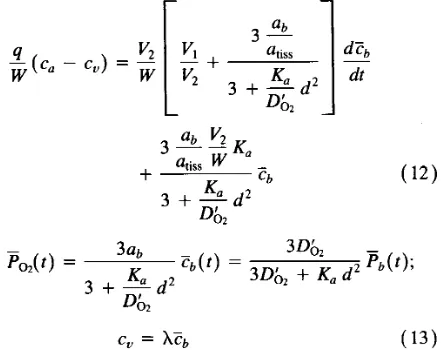
the following ordinary differential equations in time do- main:
r
zyxwvutsrqponmlkjihgfedcbaZYXWVUTSRQPONMLKJIHGFEDCBA
1L
ab 3 -
atiss 3 + y d 2 Ka
Do2
3 0 6 ,
3ab
z
( tp
( t ) ;= 3 0 6 ,
+
K , d 2F,(t) =
3 + y d 2 K a
U 0 2
c, = X c b ( 1 3 )
in which
p b
= a b c b is the average oxygen pressure in cap- illary blood. The term 3 0 & / ( 3 D &+
K, d 2 )=
0.84takes into account the mean drop in oxygen pressure from capillary blood to tissue.
As is evident from these equations, the oxygen supply 4
model, i.e., the variable whose changes are reflected in blood and tissue oxygen pressure changes, thus triggering the action of chemical regulatory mechanisms. The nor- mal value of venous oxygen concentration, cVn, has been computed from data of normal CBF, ( q / W ) , , and nor-
mal oxygen consumption rate, ( CMROz),,, per tissue unit weight reported in Table I. Finaily, a value of X has been obtained by imposing the normal equilibrium condition to (12), in which the values of all the other parameters are known.
Fig. 2 shows the time pattern of mean tissue Po2, com- puted using (12) and (13), in response to a step change in CBF from normal to one-half its value. The time constant of this response (about 1.6-1.7 s ) is in agreement with that reported in a recent experimental work on the rat [ 3 8 ] .
[image:4.613.326.548.268.443.2]URSINO
zyxwvutsrqponmlkjihgfedcbaZYXWVUTSRQPONMLKJIHGFEDCBA
PI U / . : MODEL OF CEREBRAL BLOOD FLOW REGULATION-I I87zyxwvutsrqponmlkjihgfedcbaZYXWVUTSRQPONMLKJIHGFEDCBA
’I
’ 0
zyxwvutsrqponmlkjihgfedcbaZYXWVUTSRQPONMLKJIHGFEDCBA
L
0
zyxwvutsrqponmlkjihgfedcbaZYXWVUTSRQPONMLKJIHGFEDCBA
1 2zyxwvutsrqponmlkjihgfedcbaZYXWVUTSRQPONMLKJIHGFEDCBA
3 4 5t (sec)
Fig. 2 . Time pattern of mean cerebral tissue oxygen pressure in response to a step change in CBF from its normal to half its value. PRODUCTION AND DIFFUSION OF METABOLITES
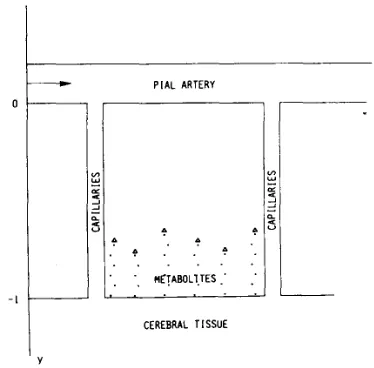
As described in the previous paragraph, several metab- olites accumulate in cerebral parenchyma as a conse- quence of tissue hypoxia. These metabolites subsequently diffuse towards perivascular space where they provoke vasodilation and contribute to raising CBF. In Fig. 3 , the geometrical configuration used in the present model to de- scribe diffusion of metabolites is shown. According to Wei and Kontos [39], this configuration is equivalent to the schematization of the brain as a plane source of vasodi- lating substances, positioned opposite the pial arteries at a distance 1.
Diffusion of metabolites towards the vessel wall is de- scribed by the following partial differential equation, equivalent to ( 5 ) :
in which
tance
zyxwvutsrqponmlkjihgfedcbaZYXWVUTSRQPONMLKJIHGFEDCBA
- y from a pial artery,c, = concentration of the generic metabolite
zyxwvutsrqponmlkjihgfedcbaZYXWVUTSRQPONMLKJIHGFEDCBA
m at a dis-D m = metabolite diffusion coefficient,
K,c, = amount of metabolite reabsorbed or degraded per unit volume in unit time.
In the following, all the Laplace transforms refer to changes of different quantities with respect to the normal equilibrium condition.
It is assumed that at the instant
r
= 0, the system is in normal equilibrium condition. Moreover, the following boundary conditions, in Laplace transform domain, have been used:= - G m F O 2 ( s ) (15)
zyxwvutsrqponmlkjihgfedcbaZYXWVUTSRQPONMLKJIHGFEDCBA
-1, s)
ay a t y = -1 -D,
= o
ac,(o,
zyxwvutsrqponmlkjihgfedcbaZYXWVUTSRQPONMLKJIHGFEDCBA
s)ay a t y = 0
-D,
9
PIAL ARTERYCEREBRAL TISSUE
Fig. 3. Geometrical configuration used to describe diffusion of metabolites from cerebral parenchyma to pial artery perivascular space.
in which c,(
zyxwvutsrqponmlkjihgfedcbaZYXWVUTSRQPONMLKJIHGFEDCBA
y , s) denotes the Laplace transform of me-tabolite concentration changes, at a distance - y from tis- sue plane layer, and Po,(s) is the Laplace transform of average tissue oxygen pressure changes, obtainable from the previous submodel. According to (15), the amount of
the generic metabolite m , crossing the unit surface of ce- rebral parenchyma in unit time, depends on oxygen lack. Moreover, it is assumed that the metabolic rate of cerebral tissue does not change during simulation and that ade- quate oxygen delivery is always expressed by the condi- tion: P & ( s ) = 0. The boundary condition (16) schema- tizes the effect of the blood-brain barrier, which does not allow reabsorption into the blood flow of either adenosine [16], [40] or H + [34].
Equation (14), with the boundary conditions (15) and
(16), gives the following expression for perivascular me- tabolite concentration:
G m Po*(s
C , ( O , s) = -
sinh
P
l ( s
+
K , ) -in which
I
The meromorphic transfer function (17) has been approx- imated by a rational function using the Taylor series of sinh
P I P
limited to a finite number of elements. If two terms of the series are taken, one has [image:5.618.343.530.67.251.2]I88
zyxwvutsrqponmlkjihgfedcbaZYXWVUTSRQPONMLKJIHGFEDCBA
IEEE TRANSACTIONS ON BIOMEDICAL ENGINEERING. VOL. 36. NO. 2. FEBRUARY 1989 The second pole of (18) takes metabolic diffusion processinto account. Unfortunately, it is very difficult to assign
a correct and univocal value to the parameter
zyxwvutsrqponmlkjihgfedcbaZYXWVUTSRQPONMLKJIHGFEDCBA
D m / f 2 be-cause of the complex geometrical arrangement of the pial arterial bed and a lack of data in literature on metabolite diffusron coefficients. Nevertheless, if one assumes that the distance between cerebral tissue and the arteriolar wall does not exceed 15 pm [39] and that the diffusion coeffi- cient of generic metabolite is comparable to that of CO2
(Dco2 2:
zyxwvutsrqponmlkjihgfedcbaZYXWVUTSRQPONMLKJIHGFEDCBA
0.3-
zyxwvutsrqponmlkjihgfedcbaZYXWVUTSRQPONMLKJIHGFEDCBA
cm2/sec), the result is: 6Dm/12 LzyxwvutsrqponmlkjihgfedcbaZYXWVUTSRQPONMLKJIHGFEDCBA
8 s-'. This means that the time delay introduced by the metabolite diffusion process is of a few tenths of a second (time constant less than 0.125 s ) according to what was also deduced by Wei and Kontos [39]. Since the accu- mulation of both adenosine and H+ occurs with a time delay much greater than that introduced by the second pole, its effect on the model dynamics has been neglected. Consequently, the following ordinary differential equa- tion in time domain has been reached:
in which
6 e m Dm f(60,
+
KmZ2)' G, =The ordinary differential (19) has been used to simulate the dynamics of adenosine and H + perivascular concen-
tration in several conditions associated with an alteration in oxygen delivery to tissue.
Adenosine: 60 s of total cerebral ischemia in the rat cause a five-fold increase in brain adenosine concentration
[lo]. If ischemia is protracted for a longer time [16] the
adenosine concentration continues to increase until, in
zyxwvutsrqponmlkjihgfedcbaZYXWVUTSRQPONMLKJIHGFEDCBA
5-10 min, it settles at a value 13-14 higher than normal. These results are clearly reproduced by the model if the gain Gad, and the constant Kad of (19), relative to adeno- sine, are given the values
Kad = 0.01 s-'
These parameters have been kept constant during tissue hypoxia. On the contrary, during tissue hyperoxia and for adenosine concentration values less than normal, the gain of the process must be considered dependent on concen- tration values. We assumed
cad Cadn
if ?jo2
> Pan
and cad<
Cad,, then Gad = Gado -Otherwise Gad = Gado. ( 2 0 )
Equation (20) is justified since, during hyperoxia, a large amount of adenosine is rephosphorylated. However, when
0 20 40 60
t (sec)
Fig. 4. Time pattern of rat's perivascular adenosine concentration during
zyxwvutsrqponmlkjihgfedcbaZYXWVUTSRQPONMLKJIHGFEDCBA
60 s of total ischemia. Curve resulting from the present model (contin- uous line) and experimental results reported in Winn et al. [lo] (symbol
*).
the adenosine concentration is too - low
,
the rephosphory- lation rate [equal to Gad(P, - P,,,)] must slow down. In this way, an adenosine dynamics, with an inferior sat-uration level at cad =
zyxwvutsrqponmlkjihgfedcbaZYXWVUTSRQPONMLKJIHGFEDCBA
0,
is obtained. The normal adeno-sine concentration value in the rat's brain has been given
[lo] as follows:
nmoles
g
cad, = 0.9
-.
A comparison between the model's and the experimental rat's adenosine concentration [ 101 in 60 s of total cerebral ischemia, is reported in Fig. 4 . Moreover, the increase in adenosine concentration which occurs with the model during several minutes of total cerebral ischemia is shown in Fig. 5 .
pH: In order to simulate some recent experimental re-
sults on cerebral tissue acidosis [6], [12], the parameters of (19) have been given the values
KH+ = 0.001 s-'
moles
GH+ = GH+o = 8.7 * lo-'' 1 s m d g ' As with the adenosine, we have assumed that
CH +
ifPo,
>
P,, and cH+<
cH+, then GH+ = GH+o-CH+n
-
otherwise GH+ = GH+o. (21 )
Normal cerebral pH is [6]
pH, = 7.35.
[image:6.616.341.513.66.261.2]URSINO
zyxwvutsrqponmlkjihgfedcbaZYXWVUTSRQPONMLKJIHGFEDCBA
efzyxwvutsrqponmlkjihgfedcbaZYXWVUTSRQPONMLKJIHGFEDCBA
a l . : MODEL OF CEREBRAL BLOOD FLOW REGULATION-IzyxwvutsrqponmlkjihgfedcbaZYXWVUTSRQPONMLKJIHGFEDCBA
I89TABLE I1
PARAMETER VALUES FOR THE METABOLITE DYNAMICS
nmoles nmoles
Kad =
zyxwvutsrqponmlkjihgfedcbaZYXWVUTSRQPONMLKJIHGFEDCBA
zyxwvutsrqponmlkjihgfedcbaZYXWVUTSRQPONMLKJIHGFEDCBA
0.01 s-l Gad,, = 4.04.
lo-’ cad” = 0.9 -g . s . mmHg l?
nmoles pH,, = 7 . 3 5
zyxwvutsrqponmlkjihgfedcbaZYXWVUTSRQPONMLKJIHGFEDCBA
K”* = 0.001 S K I G,+, = 8 . 7 . lo-’’
1 . s
.
mmHg3
zyxwvutsrqponmlkjihgfedcbaZYXWVUTSRQPONMLKJIHGFEDCBA
v
- - - - _ _ _ _ _ - - _ _ _ _ _ _ _ _ _ _ _ _ _ _ _ _zyxwvutsrqponmlkjihgfedcbaZYXWVUTSRQPONMLKJIHGFEDCBA
0 I I I I I
0 1 2 3 4 5
Fig. 5 . Time pattern of rat’s perivascular adenosine concentration during 5 min of total cerebral ischemia.
I I 1 I I
t ( m i n )
in the dog, during 30 min of total cerebral ischemia, is presented in Fig. 6(a) and (b). With the parameter values reported above, the present model may also reproduce a measured pH time pattern consequent on a long lasting arterial hypoxia [ 121.
DISCUSSION
The mathematical model proposed in the present work allows the dynamics of cerebral metabolite perivascular concentration to be simulated in any condition associated with an alteration in oxygen delivery to tissue. Only the main substances (adenosine and Hf ) which are known to play a significant role in oxygen-dependent CBF control have been included in the model. For instance, the potas- sium ion action, which seems to be effective in only a few situations [12], [6] and for only a short time [29], has not been included in this model. However, mathematical equations similar to those developed in the present work can also be used to simulate the dynamics of other chem- ical agents involved in regulating cerebral circulation.
The main conclusion of the present simulation is that, with respect both to oxygen transport from blood to tissue and to perivascular metabolite concentration changes, the time delay introduced by diffusion processes is negligible if compared with other time constants of the system under study. This is a consequence of the very small distance between the cerebral capillaries [31], [41] and between the brain tissue and pial arterioles [39], [7], which has
0 5 10 15 20 25 30
t ( m i n )
(a)
7.0
zyxwvutsrqponmlkjihgfedcbaZYXWVUTSRQPONMLKJIHGFEDCBA
6.8
I T(HIN)
6.6
1 ; I
o
d
30(b)
Fig. 6. Time pattern of cerebral pH during 30 min of total cerebral is- chemia. Curve resulting from the present model (a) and experimental results obtained by Heuser [I31 on the dog (b).
been reported in literature. This result strongly supports the hypothesis that chemical factors play a significant role in the control of cerebral circulation. In fact, one of the major arguments against chemical regulation of CBF is that the speed of observed regulatory response would be inconsistent with the time delay necessary for diffusion and action.
[image:7.618.100.512.65.467.2] [image:7.618.360.514.157.471.2]I90
zyxwvutsrqponmlkjihgfedcbaZYXWVUTSRQPONMLKJIHGFEDCBA
IEEE TRANSACTIONS ON BIOMEDICAL ENGINEERING, VOL. 36, NO. 2. FEBRUARY 1989 in cerebral tissue. However, it is probable that pH is in-volved in the active response of cerebral vessels in the medium period, when the action of other, more rapid mechanisms has become exhausted or has been revealed insufficient to ensure an adequate level of CBF. This con- clusion is in agreement with experimental results reported by Zwetnow [42] and [43]. The author states that cerebral pH changes are almost negligible if the reduced arterial pressure is contained within the limits of autoregulation. By contrast, pH alterations become significant if arterial pressure is diminished below the lower limit of auto- regulation as well as during reactive response to cerebral ischemia.
The present equations, together with an original math- ematical model of cerebral vascular reactivity, will be used in a subsequent work to simulate the overall feed- back mechanism responsible for chemical oxygen-depen- dent CBF regulation.
REFERENCES
[ I ] N. Lundberg, “The saga of the Monro-Kellie doctrine,” in
zyxwvutsrqponmlkjihgfedcbaZYXWVUTSRQPONMLKJIHGFEDCBA
Intra-cranial Pressure, Vol. V , S. Ishii, H . Nagai, and M. Brock, Eds. Berlin: Springer-Verlag, 1983, pp. 68-76.
[2] H. A. Kontos, E. P. Wei, A. J . Raper, W. I. Rosenblum, R. M. Navari, and J. L. Patterson, “Role of tissue hypoxia in local regu- lation of cerebral microcirculation,” Amer. J. Physiol., vol. 234, pp.
[3] D. D. Heistad and H. A. Kontos, “Cerebral circulation,” in Hand-
book of Physiology: Peripheral Circulation and Organ Blood Flow, Vol. I l l , J. T. Shepard and F. 1:i. Abboud, Eds. Bethesda, MA: American Physiological Society, 1983, pp. 137-182.
[4] H. M. Fairchild, J . Ross, and A. C. Guyton, “Failure of recovery from reactive hyperemia in the absence of oxygen,” Amer. J . Phys-
[5] H. A. Kontos and E. P. Wei, “Oxygen dependent mechanisms in cerebral autoregulation,” Ann. Biomed. Eng., vol. 13, pp. 329-334, 1985.
161 E. Betz and D. Heuser, “Actions and interactions of cations and an- ions on pial arteries,” in Advances in Neurology, J . Cervos-Navarro et al., Eds. New York: Raven, 1978, pp. 71-76.
[7] G. Mchedlishvili, Arterial Behavior and Blood Circulation in the
Brain. New York: Plenum, 1986.
[8] R. Rubio, R. M. Berne, E. L. Bockman, and R. R. Curnish, “Re- lationship between adenosine concentration and oxygen supply in rat brain,” Amer. J. Physiol., vol. 228, pp. 1896-1902, 1975.
[9] C. H . Nordstrom, S. Rehncrona, B. K. Siesjo, and E. Westerberg, “Adenosine in rat cerebral cortex: Its determination, normal values, and correlations to AMP and cyclic AMP during shortlasting is-
chemia,” Acta Physiol. Scand., vol.
zyxwvutsrqponmlkjihgfedcbaZYXWVUTSRQPONMLKJIHGFEDCBA
101, pp. 63-71, 1977.[IO] H. R. Winn, R. Rubio, and R. M. Beme, “Brain adenosine produc- tion in the rat during 60 seconds of ischemia,” Circ. Res., vol. 45,
[ I l l H. R . Winn, J. E. Welsh, R. Rubio, and R. M. Berne, “Brain aden- osine production in rat during sustained alteration in systemic blood pressure,” Amer. J. Physiol., vol. 239, pp. H636-H641, 1980.
[ 121 J. Astrup, D. Heuser, N. A. Lassen, B. Nilsson, K. Norberg, and B. K. Siesjo, “Evidence against H t and K+ as main factors for the con- trol of cerebral blood flow: A microelectrode study,” in Cerebral
Vascular Smooth Muscle and its Control. Amsterdam: Elsevier,
1978,pp. 313-337.
1131 D. Heuser, “The significance of cortical extracellular H + , K’ and
CaZt activities for regulation of local cerebral blood flow under con- ditions of enhanced neuronal activity,” in Cerebral Vascular Smooth
Muscle and i f s Control. Amsterdam: Elsevier, 1978, pp. 339-348.
(141 E. Leniger-Follert, R. Urbanics and D. W. Lubbers, “Behavior of extracellular H t and K + activities during functional hyperemia of mi- crocirculation in the brain cortex,” in Advances in Neurology, vol.
20, J. Cervos-Navarro et a l . , Eds. New York: Raven, 1978, pp.
zyxwvutsrqponmlkjihgfedcbaZYXWVUTSRQPONMLKJIHGFEDCBA
1151 W. Kuschinsky, M. Wahl, 0. Bosse, and K. Thurau, “Perivascular H582-H591, 1978.
iol., vol. 210, pp. 490-492, 1966.
pp. 486-492, 1979.
97-101.
potassium and pH as determinants of local pial arterial diameter in cats,’’ Circ. Res., vol. 31, pp. 240-247, 1972.
R. M. Berne, R. Rubio, and R. R. Curnish, “Release of adenosine from ischemic brain, effect on cerebral vascular resistance and incor- poration into cerebral adenine nucleotides,” Circ. Res., vol. 35, pp.
M. Wahl and W. Kuschinsky, “The dilatatory action of adenosine on pial arteries of cats and its inhibition by theophylline,” Pflugers Arch.,
H. A. Kontos, A. J . Raper, and J . L. Patterson, “Analysis of va- soactivity of local pH, P,,, and bicarbonate on pial vessels,” Stroke,
E. Betz, “The significance of cortical extracellular pH for the regu- lation of blood flow in the cerebral cortex,” in Progress in Brain
Research: Cerebral Circularion, W. Luyendijk, Ed. Amsterdam: Elsevier, 1968.
H. R. Winn, S. Morii, and R. M. Berne, “The role of adenosine in autoregulation of cerebral blood flow,” Ann. Biomed. Eng., vol. 13,
R. G. Dacey and B. R. Duling, “A study of rat intracerebral arter- ioles: Methods, morphology and reactivity,” Amer. J . Physiol., vol.
P. Borgstrom, P. 0. Grande, and S . Mellander, “A mathematical description of the myogenic response in the microcirculation,” Acta
Physiol. Scand., vol. 116, pp. 363-376, 1982.
P. Borgstrom and S. Gestrelius, ‘‘Integrated myogenic and metabolic control of vascular tone in skeletal muscle during autoregulation of blood flow,” Microvasc. Res., vol. 33, pp. 353-376, 1987. A. H. @en and K. Aukland, “A mathematical analysis of the my- ogenic hypothesis with special reference to autoregulation of renal blood flow,” Circ. Res., vol. 52, pp. 241-252, 1983.
M. Zagzoule and J. Mark-Vergnes, “A global mathematical model of the cerebral circulation in man,’’ J. Biomech., vol. 19, pp. 1015-
1022, 1986.
0. Hoffmann, “Biomathematics of intracranial CSF and haemody- namics. Simulation and analysis with the aid of a mathematical model,” Acra Neurochir. suppl. 40, pp. 117-130, 1987.
A. C . Guyton, C . E. Jones, and T . G. Coleman, Circulatory Physi-
ology: Cardiac Output and its Regulation. Philadelphia: Saunders,
J. Cervos-Navarro and J . I. Rozas, “The arteriole as a site of meta- bolic exchange,” in Advances in Neurology, Vol. 2 0 , J . Cervos-Na- varro et al., Eds.
H. Sparks, “Effect of local metabolic factors on vascular smooth
muscle,” in Handbook of Physiology: Vascular Smooth Muscle, Vol.
zyxwvutsrqponmlkjihgfedcbaZYXWVUTSRQPONMLKJIHGFEDCBA
11, D. F. Bohr, A. P. Somlyo, and H. V. Sparks, Eds. Bethesda, MA: American Physiological Society, 1980, pp. 475-513. T. Bar, “Morphometric evaluation of capillaries in different laminae of rat cerebral cortex by automatic image analysis: Changes during development and aging,” in Advances in Neurology, Vol. 2 0 , J . Cer- vos-Navarro et al., Eds.
G. Thews, “Gaseous diffusion in the lungs and tissues,” in Physical
Bases of Circulatory Transport: Regulation and Exchange, E. B.
Reeve and A. C. Guyton, Eds. Philadelphia: Saunders, 1967, pp. 327-341.
T. J. Pedley, The Fluid Mechanics ofLarge Blood Vessels. London: Cambridge University, 1980.
B. Nilsson and B. K. Siesjo, “A venous outflow method for mea- surement of rapid changes of the cerebral blood flow and oxygen con- sumption in the rat,” Stroke, vol. 14, pp. 797-802, 1983. R. B. Livingston, “Liquid0 cerebro-spinale,” in Fisiologia e Bio-
fisica Medica, T. C. Ruch and J. F. Fulton, Eds. Roma: Societi Editrice Universo, 1964, pp. 943-956.
W . E. Hoffman, R . F . Albrecht, and D. J . Miletich, “The role of adenosine in CBF increases during hypoxia in young versus aged rats,” Stroke, vol. 15, pp. 124-133, 1984.
H. R. Bailey, “Oxygen exchange between capillary and tissue: Some equations describing countercurrent and nonlinear transport,” in
Physical Bases of Circulatory Transport: Regulation and Exchange,
E. B. Reeve and A. C. Guyton, Eds. Philadelphia: Saunders, 1967,
W . B. Jones and W. J. Thron, Continued Fractions: Analitic Theory
and Application. London: Addison, 1980.
J . M. Fein, R. Eastman, and C. Moore, “Oxidative metabolism in cerebral ischemia; part 1 : Measurement of oxygen extraction slopes of grey and white matter in vivo,” Stroke, vol. 8 , pp. 472-479, 1977. E. P. Wei and H. A. Kontos, “Responses of cerebral arterioles to 262-271, 1974.
vol. 362, pp. 55-59, 1976.
vol. 8, pp. 358-360, 1977.
pp. 321-328, 1985.
243, pp. H598-H606, 1982.
1973, pp. 323-352.
New York: Raven, 1978, p. 17.
New York: Raven, 1978, pp. 1-9.
URSINO
zyxwvutsrqponmlkjihgfedcbaZYXWVUTSRQPONMLKJIHGFEDCBA
erzyxwvutsrqponmlkjihgfedcbaZYXWVUTSRQPONMLKJIHGFEDCBA
u l . : MODEL OF CEREBRAL BLOOD FLOW REGULATION-IzyxwvutsrqponmlkjihgfedcbaZYXWVUTSRQPONMLKJIHGFEDCBA
191increased venous pressure,” Amer.
zyxwvutsrqponmlkjihgfedcbaZYXWVUTSRQPONMLKJIHGFEDCBA
1. Physiol., vol. 243, pp. H442-H447. 1982.
[40] R. Rubio, R. M . Berne, and H. R. Winn. “Production, metabolism,
and possible functions of adenosine in brain tissue in
zyxwvutsrqponmlkjihgfedcbaZYXWVUTSRQPONMLKJIHGFEDCBA
situ,” in Ce-rebral Vascular Smooth Muscle and its Control. Amsterdam: Elsev-
ier, 1978, pp. 355-378.
(411 Y . Y. Koslyakov and
zyxwvutsrqponmlkjihgfedcbaZYXWVUTSRQPONMLKJIHGFEDCBA
K . P. Ivanov, ‘‘O? transport in cerebral mi-croregions (mathematical simulation),” J . Biomech. Eng., vol. 108,
I421 N. N . Zwetnow, A. Kjallquist, and B. K. Siesjo. “Cerebral blood flow during intracranial hypertension related to tissue hypoxia and to acidosis in cerebral extracellular fluids,” in Progress in Brain Re-
search: Cerebral Circulation, W. Luyendijk, Ed. Amsterdam: El-
sevier, 1968, pp. 87-92.
[43] N. N. Zwetnow, “Effects of increased cerebrospinal fluid pressure on the blood flow and on the energy metabolism of the brain,’’ Acfa
Physiol. Scand., suppl. 339, pp. 1-31, 1970.
pp. 28-32, 1986.
Patrizia Di Giammarco received the Dr.lng. de- gree in electronic engineering from the University of Bologna, Bologna, Italy, in 1986.
Since 1986 she has been with the Department of Electronics, Informatics, and System Science of the University of Bologna where she is now a Ph.D. student in bioengineering. Her main rc- search interests are focused on modeling and anal- ysis of the cardiovascular control mechanisms.
Enzo Belardinelli was born in Italv on January 12, 1930.
He joined the University of Bologna, Bologna,
Italy, in 1956 as a Researcher and Assistant Pro- fessor of Electronics and Computer Science From 1967 to 1982 he was Full Professor of Automatic Control and, since 1983, he has been Full Profes- sor of Bioengineenng in the Department of Elec- tronics, Informatics, and System Science At the beginning of the 1970’s he founded a Center ot Biomedical Research and the School of Bioengi- neering in the University of Bologna. Bologna, Italy Presently, he I S Di- rector of the National Project on Cardiovascular System He has developed new methods for analysis of biological systems, applying concepts of sys tem and control theory to them His scientific interest is particularly to- cused on analysis and modeling of the cardiovascular system as a whole, arterial dynamics, and the cerebrovascular system.
Mauro Ursino was born in Bologna, Italy, on Oc- tober 17, 1958. He received the Dr Ing degree in electronic engineering from the University of Bo- logna, Bologna, Italy, in 1983 and the Ph.D de- gree in bioengineering in 1987.
![Fig. al. [lo] (symbol *). rat's s of total ischemia. uous line) 60 Curve resulting and from experimental the results present reported in model Winn et (contin- zyxwvutsrqponmlkjihgfedcbaZYXWVUTSRQPONMLKJIHGFEDCBA4](https://thumb-ap.123doks.com/thumbv2/123dok/575257.156296/6.616.341.513.66.261/ischemia-curve-resulting-experimental-results-present-reported-zyxwvutsrqponmlkjihgfedcbazyxwvutsrqponmlkjihgfedcba.webp)

