The Industrial and Systems Engineering Department, National University of Singapore (NUS) is proud to organize The 3rd International Conference on Logistics and Maritime Systems. The objective of this conference is to provide a forum for exchanging ideas on the latest developments in the field of logistics and maritime systems among participants from universities and related industries, and to seek opportunities for collaboration among the participants. The conference will share and disseminate information on the most recent and relevant research, theories and practices in the Logistics and Maritime Systems in the following areas:
Performance measures and efficiency analysis in logistics systems
Optimization modeling and simulation analysis of logistics systems
Design of transportation networks
Multi-modal transportation systems
Transport planning in freight carrier networks
Vehicle routing and fleet management
Applications in specific transportation systems like air, sea, road and rail transport
Environmental issues of transportation
Ship routing and fleet scheduling
Layout and configuration of container terminals
New concepts in automated container terminal design
Empty container management
Scheduling of container handling and transportation operations
Stowage plans for container vessels
Landside interface at container terminals
Multimodal transportation design and optimization for containers
Onshore transportation of containers
Real-time control of logistics activities in container terminals
Organizer and Committes
Organizer
Department of Industrial & Systems Engineering, National University of Singapore
Committees
Conference Co-Chairs
Loon Ching Tang, Head of Department, National University of Singapore Kap-Hwan Kim, Pusan National University, Korea
International Advisory Committee
Michael G. H. Bell, University of Sydney, Australia Rommert Dekker, Erasmus University, Netherlands Hans-Otto Günther, TU Berlin, Germany
Erhan Kozan, Queensland University of Technology, Australia YouFang Huang, Shanghai Maritime University, China
Chung-Yee Lee, Hong Kong University of Science and Technology, China Loon Ching Tang, National University of Singapore, Singapore
Kap-Hwan Kim, Pusan National University, Korea
Organizing Co-Chair
Ek Peng Chew, National University of Singapore, Singapore Loo Hay Lee, National University of Singapore, Singapore
Program Committee
Christian Bierwirth, Martin-Luther-University Halle-Wittenberg, Germany Jürgen Böse, TU Hamburg-Harburg, Germany
Ek Peng Chew, National University of Singapore, Singapore Sang Hei Choi, Korea Maritime Institute, Korea
Marielle Christiansen, Norwegian University of Science and Technology, Norway Karl. F. Doerner, University of Linz, Austria
Kjetil Fagerholt, Norwegian University of Science and Technology, Norway Jan C. Fransoo, TU Eindhoven, Netherlands
Michel Gendreau, Ecole Polytechnique de Montreal, Canada Anne Goodchild, University of Washington, USA
Martin Grunow, TU Munich, Germany
Hans-Dietrich Haasis, University of Bremen, Germany Axel Hahn, University of Oldenburg, Germany
Richard Hartl, University of Vienna, Austria
Sönke Hartmann, Hamburg School of Business Administration, Germany Ying-Chin Ho, National Central University, Taiwan
Bong Hee Hong, Pusan National University, Korea Dennis Huisman, Erasmus University, Netherlands Akio Imai, Kobe University, Japan
Petros A. Ioannou, University of Southern California, USA Werner Jammernegg, WU Vienna, Austria
Osman Kulak, Pamukkale University, Turkey Gilbert Laporte, HEC Montreal, Cananda Walter Lang, University of Bremen, Germany Chulung Lee, Korea University, Korea
Chung-Yee Lee, Hong Kong University of Science and Technology, China Der-Horng Lee, National University of Singapore, Singapore
Loo Hay Lee, National University of Singapore, Singapore
Tae Sik Lee, Korea Advanced Institute of Science and Technology, Korea Yusin Lee, National Cheng Kung University, Taiwan
Jun Der Leu, National Central University, Taiwan Janny Leung, Chinese University of Hong Kong, China Stephen C.H. Leung, City University Hong Kong, China Dikai Liu, University of Technology Sydney, Australia K.L. Mak, University of Hong Kong, China
Dirk C. Mattfeld, TU Braunschweig, Germany
Frank Meisel, Martin-Luther-University Halle-Wittenberg, Germany Qiang Meng, National University of Singapore, Singapore
Maria Flavia Monaco, University of Calabria, Italy Ilkyeong Moon, Seoul National University, Korea
James R. Morrison, Korea Advanced Institute of Science and Technology, Korea Ceyda Oguz, Koc University, Turkey
Erwin Pesch, University of Siegen, Germany
Matthew E.H. Petering, University of Wisconsin, Madison, USA Kwang Ryel Ryu, Pusan National University, Korea
Bernd Scholz-Reiter, University of Bremen, Germany Jörn Schönberger, University of Bremen, Germany Dongping Song, University of Plymouth, UK Dong-Wook Song, Heriot-Watt University, UK Leena Suhl, University of Paderborn, Germany
Kok Choon Tan, National University of Singapore, Singapore Iris F.A. Vis, University of Groningen, Netherlands
Stefan Voss, University of Hamburg, Germany Bart Wiegmans, TU Delft, Netherlands
1
A Simulation Model of Blood Supply Chain at Indonesian Regional Red-Cross
Adityia Wibisono Suwardie, Bertha Maya Sopha*, Muhammad Kusumawan Herliansyah
Industrial Engineering Programme, Department of Mechanical and Industrial Engineering, Gadjah Mada University
*corresponding author: [email protected] ABSTRACT
Although managing blood supply chain is a challenging task due to its complexity, it still needs to be carried out because its shortage can put life at risk. This study aims to develop a simulation model as an evaluation tool to assess appropriate inventory policies. Regional red-cross at Yogyakara is taken as a case study. The conceptual model was built based on empirical data collected through direct observation and interviews. The model was then implemented in discrete-event simulation and was able to reproduce the actual demand, shortage and expired data. Four scenarios were developed ranging from production, sequencing, and inventory policies. Simulation results indicate that the policy on production composition would lead to the best improvement, corresponding to the reductions of both average expired (85%) and average shortages (3%) in comparison to the base model, followed by 90% reduction of LP product at storage, applying FIFO to only TC product, and the categorization of processing machine, respectively.
Keywords: simulation model, blood supply chain, regional red-cross, Indonesia
1 INTRODUCTION
Blood supply has played an important role in humanitarian because its shortage can put life at risk. Demand for bloods generally exceeds blood supply (Heinrich, 2012), in which this is also the case for Indonesia. Currently, donors are about 1.5% out of Indonesian population which is below the minimum required number of donors of 2.5% of the population according to WHO. A mismatch between supply and demand has, hence, been a persistent problem in blood supply chain. Lack of integrated management among regional red-cross exacerbates the implementation cross-subsidies. Managing blood supply chain is a complex issue due to uncertainty in supply and demand, the presence of several variants of blood types, perishability issue, and the requirements of special handling in collecting, testing, storage and distribution. Moreover, blood is a very costly product so that its wastage is highly undesirable.
Despite its significance in humanitarian, very few studies, unfortunately, have been carried out in this area particularly in Indonesian red-cross. This present study therefore contributes to evaluate the blood supply chain performance of regional red-cross in Indonesia. This study aims to develop a simulation model as an evaluation tool to assess appropriate inventory policies. Regional red-cross at Yogyakara is taken as a case study.
Several studies related to blood management have been conducted, ranging from the operational level to the strategic level, for example the development of blood forecasting models (Cohen et al., 1976), the evaluation of optimum inventory level (Akhdemila, 2009) and safety stock level with multiproduct characteristics (Jung et al., 2008), the material classification using operation research tools (Belien et al., 2012), and the development of a simulation model to manage blood inventory (Katsaliaki et al., 2007). Furthermore, a
2
based system for managing blood supply and demand from procurement to distribution were also developed (Boonyanusith et al., 2010; Agustin et al., 2004). The present study contributes empirically to the development of a simulation model specific for the red-cross operation in Indonesia for evaluating various policies toward a better performance, while, scientifically, the study demonstrates that the application of discrete-event simulation which are coupled with empirical research enables the model to be more realistic.
The present paper is structured as follows: Section 2 describes the current system of blood supply chain at Indonesian regional red-cross, followed by a description of the simulation model in Section 3 and simulation results in Section 4, before closing with a conclusion in Section 5.
2 BLOOD SUPPLY CHAIN AT INDONESIAN REGIONAL RED-CROSS
Regional Indonesian red-cross at Yogyakarta, which serves about 40 hospitals across city of Yogyakarta and surroundings area, is a provincial branch of central Indonesian red-cross. Opreations in regional red-cross includes supply planning (e.g., collecting blood from donors) demand planning (e.g., forecasting blood demand), blood production, storage, blood distribution to hospitals, as well as, monitoring and evaluation of the data availability of blood among other regional red-cross institutions.
The blood supply is done by observing the pattern of blood supply based on the types and patterns of blood donors. Supply chain for blood constitutes of blood suppliers involving mobile blood collector units, scheduled donors, and occasional donors. The number of blood collected cannot however be predicted because there is no guarantee whether the donors could meet the requirements and criteria for donation. The blood supply is therefore stochastic.
The blood demand is usually estimated using three approaches. First, it is estimated from the amount of number of beds in the hospital for acute cases; second, from historical weekly and monthly blood demands; third, using multiplier of 6.7 blood bags for each number of bed for acute cases each year. The consumers of regional red-cross are hospitals which are categorized into two types; blood bank hospitals (BDRS) and non-blood bank hospitals (Non-BDRS). Regional red-cross at Yogyakarta serve 5 hospitals as a blood bank hospitals (BDRS) which has its own shortage and processing blood, and about 35 hospitals as a non-blood bank hospitals (Non-BDRS). Blood demand can be in the forms of Packed Red Cells (PRC), Whole Blood (WB), Blood Platelets/Thrombocyte (TC), Washed Erythrocyte (WE) and Liquid Plasma (LP) depending on hospital requisitions, whereas the blood supply are human blood which are classified as type A, B, AB and O.
Regional red-cross operates the transformation of human blood to blood products which are ready to use by patients. Before the transformation, bloods need to be quarantined and delivered to testing units. Blood which deserves to further process is not contracted by hepatitis and HIV. This quarantine process takes 30 minutes. The percentage of rejected blood is as much as 17% based on data in 2012. After going through the testing units, the blood is stored in 2 transits cabinets which of each has a capacity of 400 blood bags. The blood bags are stored and picked in random which means that there is no sequencing rule applies. The transit time in this process is about 30 minutes.
Bloods are then transformed to blood products using 6 refrigerate centrifuge machines, each of which has a capacity of 6 blood bags. The production process takes 30 minutes and available in 24 hours to anticipate emergency requisition. The composition of product types to be produced is determined by experience and intuition based on the perceived demand patterns of the products in which the highest to the lowest demand order is PRC, WB, and TC consecutively. Each process of each product generates LP. There is no attempt to use and analyze the available supply and demand data to determine the optimum product composition.
3
Blood products which meet the specification go to storage while those which are not are considered as wastes. Blood product stored in the storage cabinets which capacity is 400 blood bags and categorized by type of products. Each type of product also has life storage, if such period exceeds then the product were obsolete and discarded which is considered a loss because the product cannot be used to meet demand. Lifetime for PRC, WB, WE is for 35 days, TC for 5 days, and LP for approximately 1 year. Safety stock for each product is 5 blood bags. The storage unit applies FIFO policy in which the oldest blood is taken first. Demands are fulfilled through the registration process which usually takes about 30 minutes. Demands from Non-BDRS has however to undergo cross-matching test (serology test) before registration process. This results in 2-hour demand processing. Demand is fulfilled when supply matches demand or substitute blood products following mismatching rule is available. The last operation relates to order delivery to hospitals.
3 THE SIMULATION MODEL
This section describes the aforementioned blood supply chain at regional red-cross which is translated to a simulation model. The model is designed to support the evaluation of various policies, i.e., production, sequencing, and inventory policies, toward a better performance with respect to shortage and expiration. Simulation was chosen due to the complexity of the complex stochastic multi-product system which made it intractable by analytic techniques (Cohen et al., 1976). Discrete-event simulation (DES) was selected as simulation tool due to the capability of handling complex stochastic elements which are dominant in the blood supply chain, and can analyze the bottleneck on a system that causes delays (Banks et al., 2001). Furthermore, DES has also been widely used in the design of health-related policies, e.g., Jacobson et al. (2006). The simulation model was implemented in Promodel 4.2 software.
2.1 Model
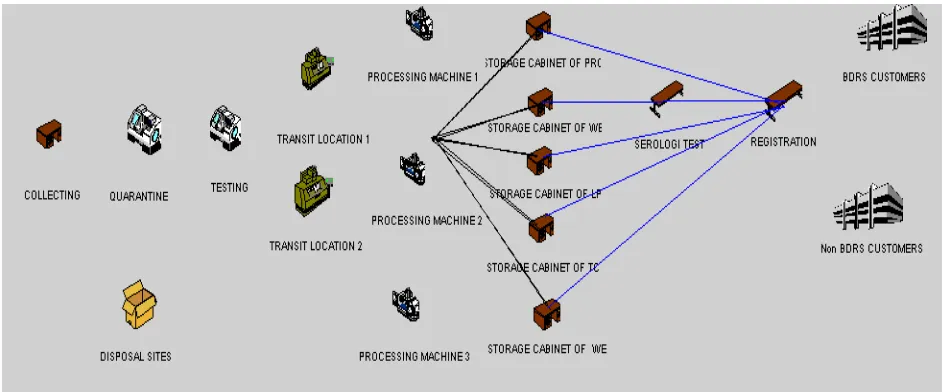
The model built based on empirical data collected through direct observation and interviews. Flows of material and information are included in the system as essential parts of the supply chain. Figure 1 depicts blood supply chain at regional red-cross at Yogyakarta which was implemented in Simapro.
Figure 1. Blood supply chain at regional red-cross at Yogyakarta implemented in Promodel
4
There are three categories of entities in the model, representing individual units of blood supply, the bloods products, and orders for units of blood. This study includes most common products such as PRC, WB, and WE with shelf-life of 35 days, TC with shelf-life of 5 days and LP with shelf-life of 1 year. Each blood product actually consists of five sub-products representing the four different blood types, each of which is handled individually in the model. The supplies of each blood type are generated randomly according to the estimated distribution function from historical data.
The model was parameterized with the empirical qualitative and quantitative data which was obtained through observation (resources, process mapping), interviews (e.g., inventory policy, production planning) and records (e.g., supply, demand, processing time). All quantitative data but processing time are stochastic. The statistical analysis is therefore conducted to obtain empirical distribution corresponding to the actual data pattern.
Whole blood units arrive in the system from three entry points, representing the three collection modes as specified in section 2. The empirical distribution that fits to the actual data are Weibull, Lognormal, and Gamma distributions which are then be used to represent arrivals of each blood collection modes respectively. The collected blood for each blood types was sent to quarantine and testing units. 17% of rejected blood, according to the empirical data, is assigned to the model as the probability that the blood is not met the requirement, therefore considered as wastage. The bloods which pass the tests are then sent to transit storages and stays for 30 minutes before sending to machine processing. Production plan of 60% PRC, 7% WB, 12% TC, 1% WE, and 20% LP, which is based on actual blood inventory level, is assigned to the model.
Demands from both BDRS and Non-BDRS, which are generated randomly following empirical distribution function estimated from historical data, are fulfilled during the registration process. The registration process is actually the point where supply meets demand in the model. However, demand for Non-BDRS has to go through cross-matching test (serology test) before registration process. Demand is fulfilled when supply matches demand or substitute blood products following mismatching rule is available, otherwise, it is considered shortage.
The model was runs for 30 days. For each simulation run, the performance of blood supply chain with respect to shortage and expired products (Katsaliaki et al., 2007) for each blood products are recorded. Due to the presence of stochastic variables, replication is divided into two parts. The first part of the data was used to parameterize the model, whereas the second part of the data was used for validation purpose. Using the latter data, the model is then validated with respects to demand from both BDRS and Non-BDRS. Moreover, the model is also constrated with the actual data on expired products and shortage.
Table 1 shows the chi-square analysis of both BDRS and Non-BDRS demands, shortages, and expired products in comparison to the actual data. Statistical analysis shows insignificant difference between actual and simulation-generated data, except for BDRS demand, which indicates that the model is reasonably representing the actual system to a large extent. It is worth to note that there are only two data points available for the validation of BDRS demand so that a very small variation results in significant difference. It is therefore
5
too early to draw conclusion that there is significant difference between between actual and simulated BDRS demands, as for now.
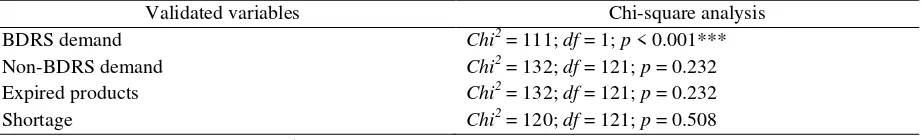
Table 1. Chi-square analysis of simulated data on demands, expired, and shortage in comparison to the actual data
Validated variables Chi-square analysis
BDRS demand Chi2 = 111; df = 1; p < 0.001***
Non-BDRS demand Chi2 = 132; df = 121; p = 0.232
Expired products Chi2 = 132; df = 121; p = 0.232
Shortage Chi2 = 120; df = 121; p = 0.508
Note: ***p<.001; ** p<.01; * p<.05
2.3Scenario Development
This section presents the development of scenarios. The baseline scenario represents the current condition, or the business-as-usual case. Based on the knowledge obtained from both observation and interview, three scenarios which examine production policy, sequencing policy and inventory policy were developed as described below.
Scenario 1 – production policy (blood product compositio). Current practice to determine blood product composition is based on intuition and/or perception on the historical data without doing any calculation corresponding to 60% PRC, 7% WB, 12% TC, 1% WE, 20% LP. Applying linier programming method on the historical data, the optimum production compositition was obtained and then intorduced to the simulation model. It is expected that the optimum product composition, i.e., 74% PRC, WB 11%, 13% TC, 2%WE, 1% LP, would lead to a better performance. historicapercentage of production changed which PRC 74%, WB 11%, TC 13%, WE 2%, and LP 1%. This calculation is done to determine the optimum number which must be produced that is expected to improve performance supply chain.
Scenario 2 – sequencing policy. Current practice is that FIFO is applied to all blood products. Using this policy, it usually take longer to proceed because they have to be sought products’ shelf-life first. Considering that the number of requests have been always exceeding stocks, this scenario examines that FIFO is applied to only TC product which has the shortest shelf-life among others (5 days) so that TC products are not stored for too long in storage and become expired. By applying the policy, the process time is expected to be shorter.
Scenario 3 – process machine categorization. The red-cross practice is currently no categorization of processing machine, which means that process machine are operationalized in random so that the process takes longer due to the mixed bloods. This scenario therefore examines the effect of machines categorization by blood type (A, B, AB, O) so that it is expected that the process flow would be more streamlined.
Scenario 4 – inventory policy for LP product at storage. This scenario assesses the effect of reducing LP product at storage with consideration that demand of the product, based on historical demand, is relatively infrequent. Current practice is that LP is kept it in a storage area in a very large number, although the demand for these products is very rare. By reducing the storage of LP products, it is expected that the space used for LP products previously could be used for other products. The scenario examines the 90% reduction of current LP product storage.
4 RESULTS AND DISCUSSIONS
Simulation results indicate that the current supply chain performance of regional red-cross (base model) is corresponding to 29% of average shortage and 59 % of average expiration. Comparing to the study of Katsaliaki et al. (2007) who found the supply chain
6
performnace of UK red-cross of 23% average shortage and 52% of average expired product indicates that improvement could be possible.
Table 2 shows simulation results. The results show that, in overall, scenario 1 yields the best performance while scenario 3 gives the least. With respect to shortage, scenario 2 results in the best performance. However, it is interesting to note that an increased performance in one area might result in a decrease performance in another area as demonstrated in scenario 2 and 3. This implies that there is a trade-off amongt blood products due to the combination of stochasticity nature on both supply and demand, and limited resources.
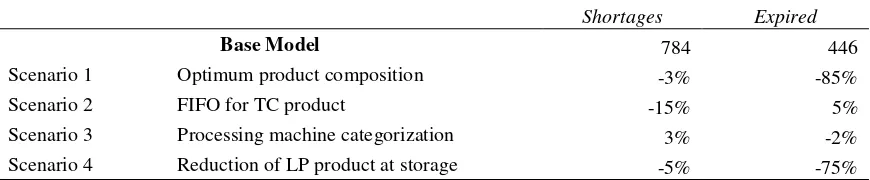
Table 2. The change percentage of average storages and expired in comparison to the base model
Shortages Expired
Base Model 784 446
Scenario 1 Optimum product composition -3% -85%
Scenario 2 FIFO for TC product -15% 5%
Scenario 3 Processing machine categorization 3% -2%
Scenario 4 Reduction of LP product at storage -5% -75%
Note: Negative sign indicates reduction
Table 3 furthermore indicates that one policy favors certain products but not others. For example, operationalizing optimum product composition results in the performance improvement of all except PRC shortage and expired TC product. Another example, applying FIFO to only TC product reduces shortages of PRC, WB, and LP product but not to WE product. Results show that the policy is contributing to, as expected, the shortage reduction of PRC, WB, and LP products, but still leads to the increase of the expired TC product which might be resulted from both short shelf-life and over-stock. The only policy which is able to reduce expired TC product is categorization of processing machine, although the policy, in overall, contributes the least improvement among other scenarios. This could be that by categorization, the process time is relatively short so that more TC product is used before its expired date.
It is also interesting to note that not applying FIFO to PRC product results in 18% reduction of PRC shortage. PRC is the most requested product so that removing restriction of sequencing would smooth the process, and hence reduce the PRC shortage. Results also highlight that the combination of various scenarios needs to be evaluated to give a better improvement and, more importantly, facilitates more comprehension on the case.
Table 3. The change percentage of average shortages and expired by blood products in comparison to the base model
Shortages Expired
PRC WB TC WE LP TC LP Base Model 603 114 0 52 15 50 396 Scenario 1 Optimum product composition 4% -32% 0% -23% -13% 26% -99% Scenario 2 FIFO for TC product -18% -5% 0% 19% -100% 34% 1% Scenario 3 Processing machine categorization 3% -7% -90% 4% 0% -18% 0% Scenario 4 Reduction of LP product at storage 2% -32% 0% -23% 0% 28% -88% Note: Negative sign indicates reduction
Although the model has been able to reasonably reproduce the real system, there is however a limitation. The model only covers internal operations of regional red-cross so that
7
the consumers are hospitals, not patients. The model could be developed by embracing hospitals whose blood bank (BDRS) so that the entire blood supply chain could be evaluated and global optimization could be achieved.
5 CONCLUSION
This present paper has contributed to a better understanding the performance of Indonesian regional red-cross at Yogyakarta. Simulation results indicate that the current performance (base model) is 29% of average shortage and 59 % of average expiration, indicating potentail areas need for improvement. Results suggest that applying the optimum product composition evaluated from data is the most effective option, followed by the 90% reduction of LP product at storage, applying FIFO to only TC product, and the categorization of processing machine, respectively.
REFERENCES
Agustin R. and Sastramihardja H., (2004), Blood Inventory Management Model in Red Cross supported WEB-based Information Systems (Adopting the concept of Supply Chain Management), Proceedings of the National Seminar on Information Technology Applications.
Akhdemila W., (2009), Analysis of Inventory Control Blood in Indonesian Red Cross Blood Transfusion Unit Branch of Depok, Thesis at the Department of Management, Faculty of Economics and Management, Bogor Agricultural University.
Banks J., Carson J. and Nicol D., (2001), Discrete Event System Simulation, Prentice Hall, New Jersey.
Belien J. and Force H., (2012), Supply Chain Management of Blood Products: A Literature Review, European Journal of Operational Research, Vol. 217, pp. 1-16.
Boonyanusith W. and Jittamai P., (2010), The Development of Web-Based System for Blood Requisition within Blood Supply Chain, International Conference on Information Technology.
Cohen M., Pierskalla W. and Sasseti R., (1976), Regional Blood Inventory Control and Distribution.
Heinrich J., (2012), Blood Supply: Availability of Blood, Health Education and Human Services Division Report, United States.
Jacobson H., Hall S. and Swisher J., (2006), Discrete-event Simulation of Health Care Systems, Journal Operations Research & Management Science, Vol. 91, pp 211-252. Jung J., Blau G., Pekny J. and Reklaitis G., (2008), Integrated safety stock management for
multi-stage supply chains under production capacity constraints, Journal Computers and Chemical Engineering, Vol. 32, pp. 2570 – 2581.
Katsaliaki K. and Brailsford S., (2007), Using Simulation to Improve the Blood Supply Chain, Journal of the Operational Research Society, Vol. 58, pp 219-227.