Spatio
Spatio
-
-
temporal analysis of methane emission in a boreal
temporal analysis of methane emission in a boreal
peatland
peatland
during one
during one
growing season as measured by eddy covariance
growing season as measured by eddy covariance
Inke Forbrich
1*, Lars Kutzbach
1,2, Christian Wille
1,2, Jiabing Wu
1,3, Thomas Becker
1,4and Martin Wilmking
1Introducion and Objectives
Peatlands are a major natural source of methane (CH4). To quantify their source strength detailed information about temporal and spatial dynamics are needed. With the increased application of new CH4analyzers, eddy covariance measurements of CH4have recently become more common. This method allows quasi-continuous measurements of turbulent fluxes and it integrates over a large source area (“footprint“).
Generally,during the summer, peak emission rates of CH4occur. Production rates are high [1] and aerenchymatuous plants stimulate both production and transport [2]. However, less information exists about shortterm CH4 dynamics during this period. With nearly continuous timeseries of CH4emissions it is possible to analyze whether oscillations are due to environmental controls (e.g. air pressure as steering parameter for ebullition [3]) or changes in the footprint of the flux measurement (similar to [4]).
Study Site Salmisuo
Location: 62°47’N, 30°56’E, Eastern Finland, oligotrophic mire complex
Classified fetch area:Eddy tower (T) is centered (z=2m), radius = 200m, circle area:12.5ha (Fig.1)
Equipment:Sonic Gill 3D anemometer, Li-7000, Campbell Sci. TGA100A (data analysis according to [6])
Pr
el
im
in
ar
y
Re
su
lts
Fig. 1: Classified fetch area: lawns (orange), flarks (green), hummocks + trees (dark green)
Three microsites: hummocks (dry), lawns (intermediate), flarks (wet)
Vegetation cover: P. sylvesteris, A. polifolia, Sph. fuscum(hummocks),
E. vaginatum, Sph. balticum, Sph. papillosum (lawns), Sch. palustris, Sph. balticum(flarks)
Climate: mean annual air temperature +2.1°C (January: -10.6°C, July: +16.0°C), mean annual precipitation 667mm (years: 1971-2000) [7]
1 Institute of Botany and Landscape Ecology, Ernst Moritz Arndt University Greifswald, Germany 2
Institute of Soil Science, University Hamburg, Germany
3 Institute of Applied Ecology, Chinese Academy of Sciences, Shenyang, P.R.China 4 National Environmental Research Institute, Aarhus University, Roskilde, Denmark
* correspondence: [email protected] [1] Saarnio et al. (1997), Oecologia 110:414-422 [6] Wille et al. (2008), Glob. Chn. Biol.:14:1-14
[2] Saarnio et al. (2002), Plant and Soil 267:343-355 [7] FMI (2002)
[3] Tokida et al. (2005), Geophys. Res. Let.:32,L13823 [8] Becker et al. (2008), Biogeosci. 5:1387-1393 [4] Neftel et al. (2008), Env. Pollution: 152:644-652 [9] Hormann (2009), diploma thesis [5] Rinne et al. (2007), Tellus 59B: 449-457
Fig. 2: Random section of time series of footprint contributions of hummocks, lawns and flarks for ten days. The contribution of flarks can usually be neglected, while the extent of lawns and hummocks show an opposite trend.
temporal analysis:
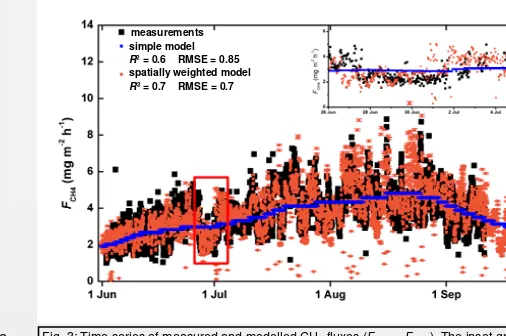
• a simple model of FCH4as function of peat temperature (adapted from [1])
FCH4_i= exp(ai+bi*Tpeat) i=lawn, flark, hummock • The microsite flux is weighted by footprint fraction
FCH4=∑(Ai* FCH4_i)
Fig. 3: Time series of measured and modelled CH4fluxes (FCH4= Flawn). The inset graph shows the model results for the same time period as Fig. 2.
In general, seasonal CH4dynamics in boreal peatlands are best
described with peat temperature below the water table [5]. Shortterm changes are not attributed to a certain environmental control yet. Here, we test whether short term oscillations in our recorded CH4fluxes are due to changes of
the flux footprint.
T board w
a lk
Methods
spatial analysis:
• high resolution aerial pictures (1Pixel: 1m*1m) [8]
• analytical footprint model according to Kormann & Meixner 2001 [9] Integral footprint contribution of the three microsite types
Ahummock, Alawn, Aflarkare computed for each pixel (in upwind direction of tower).
• Footprint model and aerial pictures are combined with the help of an arbitrary two-dimensional Cartesian coordinate system. The tower is situated in the point of origin and the maximum value for the x- and y-axis is 200m (cf. Fig. 1).
Results of temporal analysis
Results of spatial analysis
measurements simple model R² = 0.6 RMSE = 0.85 spatially weighted model R² = 0.7 RMSE = 0.7
• The point of maximum contribution to the fluxprint is < 15m from the tower.
• The 80% flux footprint area is within the classified fetch area in 97% of the measurements.
• 1.4% of the measurements are biased by low turbulence (u* <0.1 m s-1). These measurements are discarded, because the single footprint fractions add up to >100%.
• The footprint fraction of flarks (the strongest CH4source) is neglectable (Fig. 2). BecauseFlawn>> Fhummock[9], the temporal analysis is conducted for this microsite: FCH4= Flawn.
• Spatial weighting increases model performance.
• including additional variables (e.g. water level or air pressure) does not increase model performance.
• The use for gap-filling is limited to conditions with well-developed turbulence. Discussion and Conclusions
In Salmisuo, CH4flux of microsites decrease in the order: Flarks > Lawns >> Hummocks [9]. In the footprint, lawns usually cover more area than hummocks, while the spatial extent of flarks is neglectable. As the eddy covariance measurements integrate over this area, the lawns contribute by far the largest part of the measured flux. Short term oscillations can be partially explained by the changes of the footprint fraction of this microsite. However, these results are specific for Salmisuo with its characteristic microsite distribution. Furthermore, they can be specific for the growing season when vegetation cover plays a crucial role in C cycling. During the cold seasons, microsite contribution could be less significant while meteorological conditions gain importance.
Methodologically, the footprint model is restrained to atmospheric conditions with well-developed turbulence which can lead to gaps in the model timeseries. Furthermore, as the calculated footprint fraction is a result of a model itself, its use increases the uncertainty of the time series model.
•Shortterm oscillations in measured CH4flux can be attributed to footprint fraction of spatially dominant microsite with significant CH4emission rates