i
ANALYSIS ON CAD DATA OBTAINED FROM NON-CONTACT REVERSE ENGINEERING SYSTEM
MOHD HELMI BIN MD SALLEH
A project report is submitted to the Faculty of Mechanical Engineering in partial fulfillment of the requirement for the awrd of the degree of
Bachelor of Mechanical Engineering (Design and Innovation) Honors
Faculty of Mechanical Engineering Universiti Teknikal Malaysia Melaka
SUPERVISOR DECLARATION
“I hereby declare that I have read this thesis and in my opinion this report is sufficient in terms of scope and quality for the award of the degree of
Bachelor of Mechanical Engineering (Design and Innovation)”
iii
CO-SUPERVISOR DECLARATION
“I hereby declare that I have read this thesis and in my opinion this report is sufficient in terms of scope and quality for the award of the degree of
Bachelor of Mechanical Engineering (Design and Innovation)”
DECLARATION
I hereby declare that this report entitled “Analysis on CAD data obtained from non-contact reverse engineering” is the result of my own research except as cited in the
references.
Signature :
Author‟s Name : Mohd Helmi Bin Md Salleh
iii
APPROVAL
This report is submitted to the Faculty of Mechanical Engineering of UTeM as a partial fulfillment of the requirements for the degree of Bachelor of Mechanical Engineering
(Design and Innovation) honours. The members of the supervisory committee are as follow:
Dr Mohd Juzaila Bin Abd Latif (PSM Supervisor)
And
DEDICATION
To all my family especially my beloved parent, Mr. MD SALLEH IN SIMON, and
Madam ZAINAB BINTI ALI, to my Supervisor Dr MOHD JUZAILA BIN ABD LATIF
and my Co-Supervisor Mr. HAMBALI BIN BOEJANG, all lecturer and all my friends.
v
ACKNOWLEDGEMENT
First of all, Alhamdulillah and thank to ALLAH S.W.T as I had successfully complete my final year project (Projek Sarjana Muda) and finish the report on time.
I wish to acknowledge and express my gratitude and appreciation to my supervisor and co-supervisor, Dr Mohd Juzaila Bin Abd Latif and Mr Hambali Bin Boejang for his supervision, encouragement, suggestion, assistance through the research, technician and my parent whose constant encouragement, confidence besides continuously moral support.
I would like to convey my biggest thanks to Universiti Teknikal Malaysia Melaka (UTeM), Faculty of Mechanical Engineering (FKM), my PSM panel and all lecturers in UTeM who had taught me.
ABSTRACT
vii
ABSTRAK
TABLE OF CONTENTS
ix
2.1 TYPES OF REVERSE ENGINEERING ... 6
2.1.1 Tough Triggered Probe (Contact Method) ... 6
2.1.2 Analogue Probe (Contact Method) ... 7
2.1.3 Photogrammetric (Non-Contact Method) ... 8
2.1.4 Laser Scanning (Non-Contact Method) ... 8
2.1.5 Computed Tomography (CT) Scanner (Non-Contact Method) ... 9
2.2 ACTIVE AND PASSIVE SENSORS ... 10
2.3 ADVANTAGE AND LIMITATION OF RE ... 10
2.4 INTRODUCTION OF 3D SCANNER ... 12
2.4.1 Laser 3D Scanner ... 12
2.4.2 Structured Light 3D Scanner ... 13
2.5 ADVANTAGES USING 3D SCANNER ... 14
2.6 DISADVANTAGES USING 3D SCANNER ... 15
2.7 CAPABILITIES OF SCANNING OBJECT ... 16
2.8 OPERATION OF 3D SCANNER ... 17
2.8.1 3D Scannning Process ... 17
2.8.2 Object or Data Capture... 18
2.8.3 Data Processing ... 18
2.9 INTRODUCTION OF COMPUTER AIDED DESIGN (CAD) ... 18
2.9.1 History and Development Of CAD ... 19
2.9.2 Basic principle of CAD ... 20
2.9.3 Benefit of CAD ... 20
2.9.4 Geomagic and EzScan 4.5 Software ... 21
2.9.5 CATIA V5 R20 Software... 21
2.9.6.2 STL File Problem ... 23
2.9.6.3Summary of Previous Study... 24
CHAPTER 3 ... 26
EXPERIMENTAL WORK ... 26
3.0 BACKGROUND ... 26
3.1 FLOW CHART OF EXPERIMENTAL WORK ... 26
3.2 STRUCTURE OF THE EXPERIMENT ... 28
3.3 SELECTION OF SCANNED OBJECT ... 29
3.4 SELECTION OF REVERSE ENGINEERING MACHINE ... 29
3.5 EXPERIMENT PROCEDURE ... 29
3.5.1 Pre-Processing (Set-Up Procedure)... 30
3.5.1.1 Set-Up Procedure (Faro Arm Laser Scanning) ... 30
3.5.1.2 Set-Up Procedure ( Rexcan 3D Scanning) ... 31
3.5.2 Scanning Procedure ... 32
3.5.2.1 Scanning Procedure (Faro Arm Laser Scanning) ... 33
3.5.2.2 Scanning procedure (Rexcan 3D Scanning) ... 37
3.5.3 Post-Processing (Data Manipulation) ... 42
3.5.3.1 Standard Of Procedure For Data Manipulation (Faro Arm Laser Scanning) ... 42
3.5.3.2 Standard Of Procedure For Data Manipulation(Rexcan Structure Light Scanning) ... 49
3.5.3.3 Standard Of Procedure For Data Manipulation(CATIA editing for both Faro Arm and Rexcan) ... 51
3.5.4 Data Conversion ... 54
xi
3.5.4.2 Indirect Data Conversion ... 55
3.6 COMPARISON ANALYSIS ... 55
3.7.1 Faro Arm Laser Scanner ... 57
3.7.1.1 Specification of Faro Arm Laser Scanner... 58
3.7.2 Rexcan 3D Structure Light Scanner ... 59
3.7.2.1 Specification of Rexcan 3D Structure Light Scanner ... 60
3.7.3 Geomagic And Ezscan Software ... 61
3.7.4 MagicRp Software ... 61
3.7.5 CATIA V5R20 Software... 61
CHAPTER 4 ... 62
RESULT AND DISCUSSION ... 62
4.0 INTRODUCTION ... 62
4.1 PRE-PROCESSING, SCANNING, MERGE AND POST-PROCESING ... 62
4.1.1 Before STL File Generation (Faro Arm) ... 63
4.1.2 Before STL File Generation (Rexcan) ... 64
4.1.2.1 Time Duration For Merge Time ... 65
4.1.3 Total Time Required Comparison Between Faro Arm And Rexcan Before STL File Generation ... 66
4.2 QUALITY OF STL FILE (DIRECT CONVERT TO STL FILE) ... 67
4.3 QUALITY OF STL FILE (INDIRECT CONVERT TO STL FILE) ... 68
4.4 QUALITY STL FILE FROM BEST TO WORST ... 69
4.5 DATA TRANSLATION ... 70
4.6 CHALLENGE AND COUNTER ... 70
CHAPTER 5 ... 71
CONCLUSION AND RECOMMENDATION ... 71
REFERENCE ... 73 APPENDIX ... 78
A. GANTT CHART PSM 1 & PSM 2
xiii
LIST OF FIGURES
Figure No, Title Pages
Figure 1.1: Flowchart of project overview ... 4
Figure 2. 1: Tough Triggered Probe ... 7
Figure 2. 2: Analogue Probe ... 7
Figure 2. 3: Photogrammetric scanner ... 8
Figure 2. 4: Laser Scanning ... 9
Figure 2. 5: Computed Tomography (CT) Scanner ... 9
Figure 2. 6: Faro Arm Laser Scanning [22] ... 13
Figure 2. 7: Rexcan 3D scanning [23] ... 14
Figure 2. 8: Left and right side show gap and no gap between triangles [19]. ... 23
Figure 2. 9: Overlapping between triangles [19]. ... 23
Figure 2. 10: Top and bottom show incorrect and correct direction in surface normal. .. 24
Figure 3. 1: Process and planning for PSM 2 ... 27
Figure 3. 2: Scanning object. ... 30
Figure 3. 3: SKD –S2 Developer. ... 30
Figure 3. 4: Spray to object. ... 31
Figure 3. 5: Object... 31
Figure 3. 6: Sticker point. ... 31
Figure 3. 7: Fast evaporating developer. ... 32
Figure 3. 8: Spray to object. ... 32
Figure 3. 9: Equipment and apparatus of Faro Arm... 33
... 34
Figure 3. 12: Toolbar plug. ... 34
Figure 3. 13: Laser capture toolbars. ... 35
Figure 3. 14: Start capture icon. ... 35
Figure 3. 15 Seven Arm of Faro Arm machine. ... 35
Figure 3. 18: Collecting of scanned data. ... 36
Figure 3. 16: Scanned object. ... 36
Figure 3. 17: Activities on conducting machine. ... 36
Figure 3. 19: Scanned data (points cloud) is ready for post-processing process. ... 37
Figure 3. 20: Equipment and apparatus of Rexcan. ... 37
Figure 3. 21: Turn on the hardware. ... 38
Figure 3. 22: Turn on the Rexcan camera. ... 38
Figure 3. 23: Icon of Ezscan software. ... 38
Figure 3. 24: Open camera toolbar. ... 39
Figure 3. 25: Brightness toolbar. ... 39
Figure 3. 26: Distance toolbar. ... 39
Figure 3. 27: Optimal distance of laser points. ... 40
Figure 3. 28: Scan button. ... 40
Figure 3. 29: Aligning process. ... 41
Figure 3. 30: Image (scanned data) after merge process. ... 41
Figure 3. 31: Selected the overlap data. ... 43
Figure 3. 32: Deleted the overlap data. ... 43
Figure 3. 33: Icon of disconnected component. ... 44
Figure 3. 34: Reduce noise icon and process. ... 44
Figure 3. 35: Smoothness level process. ... 44
Figure 3. 36: Display deviations icon and process. ... 45
Figure 3. 37: Uniform sample process. ... 45
Figure 3. 38: Wrap icon and process. ... 46
Figure 3. 39: Repair intersection icon and process. ... 46
xv
Figure 3. 41: Fill holes process. ... 47
Figure 3. 42: Relax polygon icon. ... 48
Figure 3. 43: Sandpaper icon. ... 48
Figure 3. 44: Final data after repair (Faro Arm). ... 48
Figure 3. 45: Selected of the overlap data. ... 49
Figure 3. 46: Hole on the scanned data. ... 49
Figure 3. 48: Improve shape quality toolbar. ... 50
Figure 3. 49: Smooting toolbar ... 50
Figure 3. 47: Clean toolbar. ... 50
Figure 3. 50: Final scanned data after repair (Rexcan). ... 51
Figure 3. 51: Icon CATIA V5R20. ... 51
Figure 3. 52: Step to open the digitized shape editor environment. ... 52
Figure 3. 53: Example after open the Iges file (data in point cloud). ... 52
Figure 3. 54: Mesh creation icon... 53
Figure 3. 55: Triangle foam. ... 53
Figure 3. 56: Fill hole icon. ... 53
Figure 3. 57: Process finish ... 54
Figure 3. 58: Faro Arm 3D scanner [31] ... 57
Figure 3. 59; Rexcan 3D scanner [29] ... 59
Figure 3. 60: Top view of Rexcan 3D scanner [29] ... 59
Figure 3. 61: Front view of Rexcan 3D scanner [29] ... 60
LIST OF TABLES
Table No. Title Pages
Table 2. 1 shows the advantage and limitation between contact and noncontact reverse
engineering systems [4]: ... 11
Table 2. 2 show the capability of 3D scanner machine [4, 25]. ... 17
Table 2. 4 show the summary of previous study [2, 35, 36] ... 24
Table 3. 1: Show process and time which is used to compare the Faro Arm and Rexcan. .. ... 56
Table 3. 2: Show the consideration of STL file to determine the best method. ... 56
Table 3. 3 shown the specification of Faro Arm 3D scanner [30, 31] ... 58
Table 3. 4 shown the specification of Rexcan 3D scanner [29] ... 60
Table 4. 1: Time for Faro Arm 3D Scanner ... 63
Table 4. 2: Time for Rexan 3D Scanner ... 64
Table 4. 3: Calculation Scanning for Merge time ... 65
Table 4. 4: Comparison between Faro Arm and Rexcan for STL file quality (direct data translation). ... 67
Table 4. 5: Comparison between Faro Arm and Rexcan for STL file quality (indirect data translation). ... 68
xvii
LIST OF ABBREVIATIONS
3D : Three Dimensions
CAD : Computer Aided Design
RP ; Rapid prototyping
RE : Reverse engineering
STL file : Standard triangulation language file IGES : International Graphics Exchange Standard
SOP : Standard of Procedure
CHAPTER 1
INTRODUCTION
1.0 BACKGROUND
Nowadays there are so many reverse engineering (RE) technologies commercially available with different specifications and ranges. Generally, they are categorized into contact (probe base) and non-contact (laser based) methods [1]. Both RE methods are used to capture data or information from physical object. The scanned data obtained can be used for many downstream applications such as rapid prototyping (RP), computer aided design (CAD), computer aided manufacturing (CAM) and etc. In this era of millennium, product is more complex than before [4]. One of the most recent technological developments that have significant impact on product development and enable to overcome problem from product geometry is reverse engineering. Generally, a model of a product will be digitized or scanned to obtain its graphical representation before being manipulated the geometry data for downstream operational application. The technology of reverse engineering can change object or part to solid or surface model‟ to the end user. However, this project focuses on analysis of standard triangulation language (STL) data produced from two different products/brands of non contact RE systems.
2 1.1 OBJECTIVES
There are several objective of this project which can be concluded as the following:
-To identify the quality of STL file obtained after direct and indirect data translation from reverse engineering. engineering machine available in University Technical Malaysia Melaka (UTeM) and determines which one is the best in producing Standard Triangulation Language (STL) from a scanned object (fake hand). Generally, in the scanning /digitizing process of an object there a many tasks must be done such as setting-up, scanning, editing and repairing data, and data conversion for various applications. For example the generation of STL file format for rapid prototyping application in producing a part or product. This project is focuses on investigating the quality of STL files.
very important factor in generating a decent quality of STL file. Similarly, the main purpose of this project is to investigate the quality of STL files obtained through direct and indirect data translation from non contact RE systems. However, the quality is defined from 3 criteria of the triangles: the gaps between edges, normal orientation, and overlapped triangles.
1.3 SCOPE OF PROJECT
The scope of this project is:
-To do literature search.
-To familiarize with both non contact reverse engineering systems.
-To carry out the experimental works such as scanned the selected object, data manipulations and data conversion from scanned data to STL file.
-To do comparison analysis on the quality of the STL file produced in term its normal orientation, overlapped triangles, and gap between edges.
-To compare the setup procedures of each reverse engineering system.
- To compare number of triangles of each STL file produced from direct and indirect file conversions.
- To compare scanning speed (scanning time) for selected or assigned images.
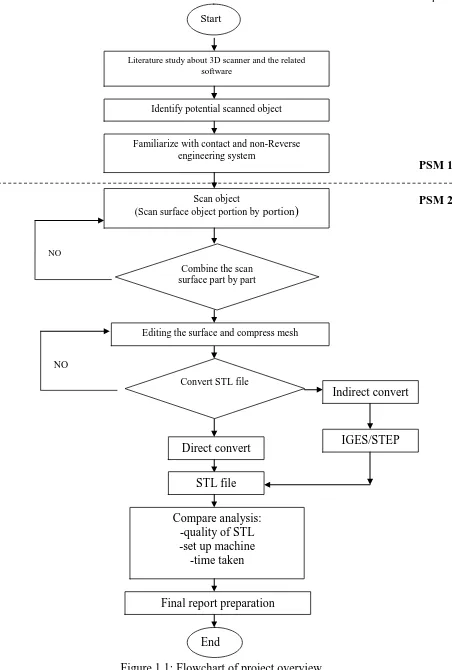
1.4 PROJECT OVERVIEW
4
Figure 1.1: Flowchart of project overview Direct convert
Literature study about 3D scanner and the related software
Identify potential scanned object
Familiarize with contact and non-Reverse engineering system
PSM 1 PSM 2
Scan object
(Scan surface object portion byportion)
NO
Editing the surface and compress mesh
CHAPTER 2
LITERATURE REVIEW
2.0 INTRODUCTION OF REVERSE ENGINEERING (RE)
Reverse engineering is the process whereby a replica is made of an existing physical object or part. It is very useful for generating a CAD model from object with no CAD data or information [4]. Basically, RE method is scan or capture the geometry of product or part by digitizer. The information of the product or part is registered on the computer and represent as a CAD data [4]. Reverse engineering is a way to redesign a product to reconstruct a new product which has similar functions and to improve the ability of the original product [5].