FINGERPRINT OF
Phyllanthus niruri
Wulan Tri Wahyuni
1,2,*, Latifah K. Darusman
1,2, and Aji Hamim Wigena
31
Division of Analytical Chemistry, Department of Chemistry, Faculty of Mathematics and Natural Sciences, Bogor Agricultural University, Dramaga-Bogor, Indonesia
2
Biopharmaca Research Center, Institute of Research and Community Empowerment, Bogor Agricultural University, Taman Kencana Campus-Bogor, Indonesia 3
Department of Statistics, Faculty of Mathematics and Science, Bogor Agricultural University, Dramaga-Bogor, Indonesia Received July 22, 2013; Accepted March 2, 2014
ABSTRACT
Split-plot mixture-mixture design has been applied for optimization of Phyllanthus niruri chromatographic fingerprint. The design was applied for unreplicated and simultaneous optimization of extraction and chromatographic mobile phase mixture. The whole-plot was extraction solvent contained various combinations of methanol, ethyl acetate and dichloromethane in a simplex centroid with axial design. The sub-plot was reversed phase chromatographic mobile phase in simplex centroid design contained varying proportions of methanol, acetonitrile and acetonitrile:water (55:45 v/v). Each extract was eluted with seven mobile phases of high performance liquid chromatography and detected at 210, 225 and 254 nm. The optimum condition was determined based on the number of peaks. The correlation between extraction solvent, chromatographic mobile phase and number of peak were evaluated with Ordinary Least Square method. The root mean square error of calibration and root mean square error of prediction obtained at 210, 225 and 254 nm were 1.8634 and 4.0076; 2.2220 and 5.2839; 1.5436 and 2.2606, respectively. The optimum condition was obtained when the ethyl acetate extract was eluted with acetonitrile:water (55:45 v/v) and detected at 254 nm. Precision of retention time at optimum condition was excellent, with the relative standard deviation in a range of 0.0698 and 0.3006%.
Keywords: optimization; chromatographic fingerprint; Phyllanthus niruri; simplex centroid; split-plot mixture-mixture design
ABSTRAK
Split-plot mixture-mixture design telah digunakan untuk pengoptimuman sidik jari kromatografi dari Phyllanthus niruri. Rancangan ini diterapkan untuk pengoptimuman simultan tanpa pengulangan dari kombinasi pelarut ekstraksi dan fase gerak kromatografi. Whole-plotnya ialah pelarut ekstraksi yang terdiri atas metanol, etil asetat, dan diklorometana pada berbagai perbandingan berdasarkan simplex centroid dengan desain aksial. Sub-plotnya ialah fase gerak kromatografi berdasarkan simplex centroid desain yang terdiri atas metanol, asetonitril, dan asetonitril:air (55:45 v/v) Masing-masing ekstrak dielusi dengan tujuh fase gerak kromatografi cair kinerja tinggi dan dideteksi pada panjang gelombang 210, 225, dan 254 nm. Kondisi optimum ditentukan berdasarkan jumlah puncak. Hubungan antara pelarut ekstraksi, fase gerak kromatografi, dan jumlah puncak dianalisis dengan metode Ordinary Least Square. Root mean square error of calibration dan root mean square error of prediction pada 210, 225 dan 254 nm berturut-turut ialah 1,86341 dan 4,00759; 2,22201 dan 5,28394; 1,54367 dan 2,26063. Kondisi optimum diperoleh saat ekstrak etil asetat dielusi dengan asetonitril:air (55:45 v/v) dan dimonitor pada 254 nm. Presisi waktu retensi pemisahan pada kondisi optimum sangat baik dengan standar deviasi relatif pada kisaran 0,0698-0,3006 %.
Kata Kunci:optimum, sidik jari kromatografi; Phyllanthus niruri; simplex centroid; split-plot mixture-mixture design
INTRODUCTION
Herbal medicines have been widely used for thousands years in Asia [1]. The people believe that traditional medicines have less risky and less bad side effect compared to modern synthetic medicines [2-4].
Therefore, it is a big challenge to establish a quality control method of traditional medicines for its clinical efficacy and safety.
Indonesia. P. niruri has been reported as a hepatoprotector [5-6], antihepatitis [7] and antioxidant [5-6]. The quality and efficacy of P. niruri are varied according to plant varieties and its growing conditions.
The quality control ofP. niruriwas examined based on concentration of marker compounds, such as lignan [8] and tannin [9]. Actually, the marker compounds did not give an overall insight of traditional medicines, because its efficacy depends on multiple constituents [1].
The fingerprint of Chromatography, including high performance liquid chromatography (HPLC) is an alternative technique for controlling the quality of the herbal medicine component, such as P. niruri [10-14]. Representative HPLC fingerprint was needed to obtain a good quality control method [15]. As already known, the HPLC fingerprint depends on the extraction and condition of the HPLC separation process. Therefore, in our work we conducted the optimization of extraction solvents and HPLC mobile phases using unreplicated split-plot mixture-mixture design to obtain a representative HPLC fingerprint ofP. niruri. The number of peaks in HPLC profiles was used as the parameter in the optimization process.
EXPERIMENTAL SECTION
Materials
P. niruri was collected from Research and Development Center of Plant Medicines and Traditional Medicine (B2P2TO-OT), Tawangmangu Central Java-Indonesia. Methanol, ethyl acetate and dichloromethane were used for extraction solvent and methanol and acetonitrile (HPLC grade) were obtained from Merck. Deionized water was obtained from Hydro water purification system.
Instrumentation
All HPLC analysis was performed using Shimadzu LC-20 AD with diode array detector. A C18 LiChospher column (5 µm particle size, 250 mm x 4 mm i.d) was
purchased from Merck was used for all chromatographic separation.
Procedure
Extraction
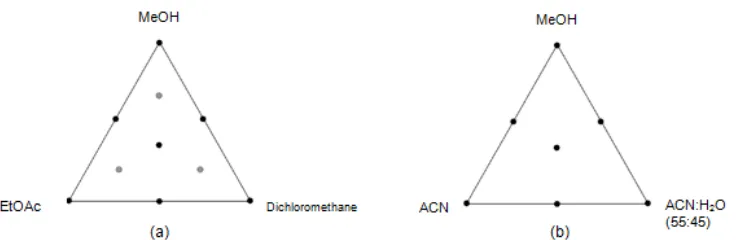
P. niruri was grounded into powder and extracted with maceration technique using the 10 combination of extraction solvents based on simplex centroid with axial design (Fig. 1a) as a whole plot in mixture system. Each extraction was conducted for 24 h and repeated three times. The extract was then filtered and concentrated with a rotary evaporator to obtain a dried extract.
HPLC analysis
The HPLC analysis was conducted using methanol, acetonitrile and acetonitrile:H2O (55:45) combination as mobile phase in appropriate ratio based on a simplex centroid design (Fig. 1b), as the sub plot in mixture system. Mobile phase was filtered through a 0.45 μm membrane filter (Millipore®) and sonicated prior to use. Then obtained extract was diluted in HPLC mobile phases and filtered, 20 μL extract was injected to HPLC Shimadzu LC-20 AD and detected at 210, 225 and 254 nm. The number of peaks was calculated from HPLC profile from each separation process. The optimum condition was determined based on the number of peaks.
Data analysis
Ordinary Least Square (OLS) method was used to construct the linear regression model from HPLC data. The HPLC data from the simplex centroid point was used to establish the regression model, meanwhile the HPLC data from the axial point was used for regression model validation.
RESULT AND DISCUSSION
Fig 2.P. niruriHPLC profile of methanol extract (a) and dichloromethane extract (b)
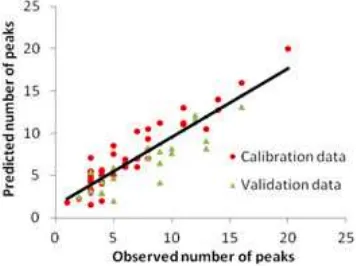
Fig 3. Graph of observed number of peaks against predicted number of peaks for calibration data set (circle) and validation data set (triangle)
Table 1.Extraction yield ofP. niruri
Solvent combination (MeOH:EtOAc:CH2Cl2) Yield (%)
(1:0:0) 7.4254
The sample was extracted using 10 combination of extraction solvents based on simplex centroid with axial design. The yield of extraction process was in a range of 1.3668 and 7.4254% w/w (Table 1). The highest yield was obtained when methanol used as the extraction solvent. It is indicated that major compounds in Phyllanthus niruri were soluble in polar solvent. Calixto et al. (1998) reported that the major compounds in P. niruri were lignan, tannin, polyphenol and flavonoids. [16].
Each extract of P. niruri was eluted in a reversed phase HPLC system using seven combinations of
mobile phase. Unreplicated injection was conducted in this separation process, therefore randomization in whole plot and subplot was conducted to avoid systematic error. The methanol extract eluted faster than nonpolar extract such as dichloromethane extract (Fig. 2) since each extract has a different interaction with mobile and stationary phase. Dichloromethane extract attached strongly to non polar stationary phase. On the other hand, interaction between methanol extract with polar mobile phase was strong and made it eluted faster than the others.
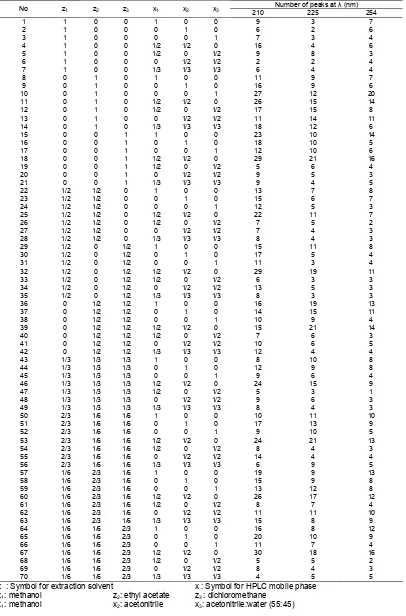
The HPLC separation process was detected at 210, 225 and 254 nm. The number of peaks evaluated according to their signal to noise ratio and its resolution. The signal was considered as a peak when its signal to noise ratio (S/N) = 3 and resolution (R) = 1. The most number of peaks detected at 210, 225 and 254 nm successively was 30, 21 and 20 peaks. Table 2 presented the number of peaks for each extraction solvents and mobile phase combination.
Statistical analysis of the data was conducted using MINITAB. The 49 data (simplex centroid points) was used for calculating coefficient of regression model. Since the ratio of whole plot error to subplot error less than 0.4 (σ2
WP/σ 2
SP < 0.4), the regression model was constructed by ordinary least square (OLS) regression [17]. The regression model was constructed from 33 interactions at 210 nm, 29 interactions at 225 nm and 18 interactions at 254 nm. The regression models of 210 nm, 225 nm, and 254 nm were presented in Table 3.
13 0 1 0 0 1/2 1/2 11 14 11
14 0 1 0 1/3 1/3 1/3 18 12 6
15 0 0 1 1 0 0 23 10 14
16 0 0 1 0 1 0 18 10 5
17 0 0 1 0 0 1 12 10 6
18 0 0 1 1/2 1/2 0 29 21 16
19 0 0 1 1/2 0 1/2 5 6 4
20 0 0 1 0 1/2 1/2 9 5 3
21 0 0 1 1/3 1/3 1/3 9 4 5
22 1/2 1/2 0 1 0 0 13 7 8
23 1/2 1/2 0 0 1 0 15 6 7
24 1/2 1/2 0 0 0 1 12 5 3
25 1/2 1/2 0 1/2 1/2 0 22 11 7
26 1/2 1/2 0 1/2 0 1/2 7 5 2
27 1/2 1/2 0 0 1/2 1/2 7 4 3
28 1/2 1/2 0 1/3 1/3 1/3 8 4 3
29 1/2 0 1/2 1 0 0 15 11 8
30 1/2 0 1/2 0 1 0 17 5 4
31 1/2 0 1/2 0 0 1 11 3 4
32 1/2 0 1/2 1/2 1/2 0 29 19 11
33 1/2 0 1/2 1/2 0 1/2 6 3 3
34 1/2 0 1/2 0 1/2 1/2 13 5 3
35 1/2 0 1/2 1/3 1/3 1/3 8 3 3
36 0 1/2 1/2 1 0 0 16 19 13
37 0 1/2 1/2 0 1 0 14 15 11
38 0 1/2 1/2 0 0 1 10 9 4
39 0 1/2 1/2 1/2 1/2 0 15 21 14
40 0 1/2 1/2 1/2 0 1/2 7 6 3
41 0 1/2 1/2 0 1/2 1/2 10 6 5
42 0 1/2 1/2 1/3 1/3 1/3 12 4 4
43 1/3 1/3 1/3 1 0 0 8 10 8
44 1/3 1/3 1/3 0 1 0 12 9 8
45 1/3 1/3 1/3 0 0 1 9 6 4
46 1/3 1/3 1/3 1/2 1/2 0 24 15 9
47 1/3 1/3 1/3 1/2 0 1/2 5 3 1
48 1/3 1/3 1/3 0 1/2 1/2 9 6 3
49 1/3 1/3 1/3 1/3 1/3 1/3 8 4 3
50 2/3 1/6 1/6 1 0 0 10 11 10
51 2/3 1/6 1/6 0 1 0 17 13 9
52 2/3 1/6 1/6 0 0 1 9 10 5
53 2/3 1/6 1/6 1/2 1/2 0 24 21 13
54 2/3 1/6 1/6 1/2 0 1/2 8 4 3
55 2/3 1/6 1/6 0 1/2 1/2 14 4 4
56 2/3 1/6 1/6 1/3 1/3 1/3 6 9 5
57 1/6 2/3 1/6 1 0 0 19 9 13
58 1/6 2/3 1/6 0 1 0 15 9 8
59 1/6 2/3 1/6 0 0 1 13 12 8
60 1/6 2/3 1/6 1/2 1/2 0 26 17 12
61 1/6 2/3 1/6 1/2 0 1/2 8 7 4
62 1/6 2/3 1/6 0 1/2 1/2 11 11 10
63 1/6 2/3 1/6 1/3 1/3 1/3 15 8 9
64 1/6 1/6 2/3 1 0 0 16 8 12
65 1/6 1/6 2/3 0 1 0 20 10 9
66 1/6 1/6 2/3 0 0 1 11 7 4
67 1/6 1/6 2/3 1/2 1/2 0 30 18 16
68 1/6 1/6 2/3 1/2 0 1/2 5 5 2
69 1/6 1/6 2/3 0 1/2 1/2 8 4 3
70 1/6 1/6 2/3 1/3 1/3 1/3 4 5 5
z : Symbol for extraction solvent x : Symbol for HPLC mobile phase z1: methanol z2: ethyl acetate z3: dichloromethane
Fig 4.HPLC profile of ethyl acetate extract monitored at 254 nm
Table 3.Regression model for the data monitored at 210, 225 and 254 nm
λ (nm) Regression Model
210 ŷ=9x1z1+6x2z1+7x3z1+34x1x2z1-18x2x3z1-96x1x2x3z1+11x1z2+16x2z2
+27x3z2+50x1x2z2-42x2x3z2+23x1z3+18x2z3+12x3z3+34x1x2z3-50x1x3z3
-24x2x3z3-114x1x2x3z3+16x2z1z2-20x3z1z2-80x1x3z1z2+20x2z1z3+72x1x2z1z3
+68x2x3z1z3-828x1x2x3z1z3-38x3z2z3-168x1x2z2z3+100x2x3z2z3+468x1x2x3z2z3
-183x1z1z2z3-108x2z1z2z3+858x1x2z1z2z3-7965x1x2x3z1z2z3
225 ŷ=3x1z1+3x3z1+20x1x3z1+9x1z2+9x2z2+12x3z2+24x1x2z2+18x1x3z2+14 x2x3z2
-114 x1x2x3z2+10x1z3+10x2z3+10x3z3+44x1x2z3-16x1x3z3-20x2x3z3-186x1x2x3z3
-92x1x3z1z2+18x1z1z3-14x3z1z3+76x1x2z1z3-72x1x3z1z3+38x1z2z3+22x2z2z3
-72 x1x2z2z3-132x1x3z2z3-84x2x3z2z3-108x1z1z2z3-8919x1x2x3z1z2z3
254 ŷ=7x1z1+6x2z1+4x3z1+7x1z2+6x2z2+20x3z2+30x1x2z2-22x1x3z2-135x1x2x3z2
+14x1z3+5x2z3+6x3z3+26x1x2z3-24x1x3z3-36x3z1z2+22x2z2z3-36x3z2z3
-80x1x2z2z3
Table 4. The RMSEC and RMSEP for 210, 225 and 254 nm
Parameter 210 nm 225 nm 254 nm
RMSEC 1.8634 2.2220 1.5436
RMSEP 4.0076 5.2839 2.2606
meanwhile the cubic and ternary interaction give nonsynergic effect.
the green triangle corresponds to validation points (axial points). Since the RMSEC was 1.54, conformity between the observed number of peaks and prediction number of peaks for simplex centroid points was good.
Based on statistical analysis, the optimum condition of P. niruri HPLC fingerprint was obtained when ethyl acetate used as extraction solvent, acetonitrile:water (55:45 v/v) as HPLC mobile phase and detection at 254 nm. Combination of ethyl acetate and acetonitrile:water (55:45 v/v) as extraction solvent and HPLC mobile phase also gives the optimum number of peaks for linear interaction at 210 and 225 nm. Fig. 4 showed the HPLC profile of ethyl acetate extract eluted using various combinations of mobile phase monitored at 254 nm. Validation of optimum condition conducted through repeatability of injection and expressed as the relative standard deviation. The relative standard deviation of analysis was in a range of 0.0698 and 0.3006%.
CONCLUSION
Optimum condition for representative P. niruri HPLC fingerprint was ethyl acetate as extraction solvent and acetonitrile:water (55:45 v/v) as mobile phase. Based on RMSEC and RMSEP of regression model, the most suitable regression model was obtained at 254 nm. Relative standard deviation of analysis at optimum condition was in a range of 0.0698% and 1.7348%.
5. Harish, R., and Shivanandappa, T., 2006, Food Chem., 95 (2), 180–185.
6. Sabir, S.M., and Rocha, J.B.T., 2008,Food Chem., 111 (4), 845–851.
7. Shin, M.S., Kang, E.H., and Lee, Y.I., 2005, Antiviral Res., 67 (3), 163–168.
8. Murugaiyah, V., and Chan, K.L., 2007, J. Chromatogr. B, 852 (1-2), 138–144.
9. Colombo, R., de L. Batista, A.N., Teles, H.L., Silva, G.H., Bomfim, G.C.C., Burgos, R.C.R., Cavalheiro, A.J., da Silva Bolzani, V., Silva, D.H.S., Pelícia, C.R., Guimarães, F.M., and Heimberg, M.C.H., 2009,Biomed. Chromatogr., 23 (6), 573–580. 10. Rafi, M., Rohaeti, E., Miftahudin, A., Darusman,
L.K., 2011,Indo. J. Chem., 11 (1), 71–74.
11. Yang, L-W., Wu, D-H., Tang, X., Peng, W., Wang, X-R., Ma, Y., and Xu, W-W., 2005,J. Chromatogr. A, 1070 (1-2), 35–42.
12. Yan, S-K., Xin, W-F., Luo, G-A., Wang, Y-M., and Cheng, Y-Y., 2005, J. Chromatogr. A, 1090 (1-2), 90–97.
13. Yi, L.Z., Yuan, D.L., Liang, Y.Z., Xie, P.S., and Zhao, Y., 2007, Anal. Chim. Acta, 588 (2), 207– 215.
14. Liu, F., Ong, E.S., and Li, S.F.Y., 2013, Food Chem., 141 (3), 1807–1813.
15. Borges, C.N., Bruns, R.E., Almeida, A.A., and Scarminio, I.S., 2007 Anal. Chim. Acta, 595 (1-2), 28–37.
16. Calixto, J.B., Santos, A.R.S., Filbo, V.C., and Yunes, R.A., 1998, Med. Res. Rev., 18 (4), 225– 258.