CONFERENCE COMMITTEE
Coordinator : Yandra Arkeman, Dr. M.Eng
(Departement of Agroindustrial Technology, IPB) Co-Coordinator : Nastiti Siswi Indrasti, Prof. Dr. Ir.
(Head of Departemen of Agroindustrial Technology, IPB)
International Experts:
1. Kenneth De Jong, Prof.
(George Mason University, Fairfax, Virginia, USA) 2. Kim Bryceson, Prof.
(School of Agriculture and Food Science , University of Queensland, Australia) 3. Haruhiro Fujita, Prof.
(Department of Information Systems, Niigata University for International and Information Studies Japan)
4. Gajendran Kandamsany, Dr. (United Kingdom)
5. Noel Lindsay, Prof. (University of Adelaide, Australia)
Committee Members from IPB: 1. Kudang Boro Seminar, Prof.
(Departement of Mechanical & Bio-system Engineering, IPB) 2. Marimin, Prof.
(Departement of Agroindustrial Technology, IPB) 3. Endang Gumbira Said, Prof.
(Departement of Agroindustrial Technology, IPB) 4. Suprihatin, Prof.
(Secretary of Departement of Agroindustrial Technology, IPB) 5. Ono Suparno, Prof.
(Departement of Agroindustrial Technology, IPB) 6. Agus Buono, Dr.
(Head of Department of Computer Science, IPB)
PROCEEDINGS
2
ndInternational Conference on Adaptive and Intelligent Agroindustry (ICAIA)
September 16 – 17, 2013, IPB International Convention Center
Bogor – Indonesia
Organized by :
WELCOMING ADDRESS
Prof. Dr. Ir. Nastiti Siswi Indrasti
Head of Agroindustrial Technology Department Faculty of Agricultural Engineering and Technology
Bogor Agricultural University
On
Second International Conference on Adaptive and Intelligence Agroindustry (2nd ICAIA)
Bogor, September, 16 – 17, 2013
Assalamu’alaikum Warohmatullahi Wabarokatuh In the name of Allah, the beneficent and the merciful,
Distinguish Guest, Ladies and Gentlemen
Let me first thank you all for accepting the invitation to participate in this 2nd International Conference on Adaptive and Intelligence Agroindustry (ICAIA). In particular I would like to thank Rector of IPB (Institut Pertanian Bogor/Bogor Agricultural University) Prof. Herry Suhardiyanto for supporting this event as part of the series academic event in celebrating the 50th Anniversary of Bogor Agricultural University.
In fact, the idea of organizing this conference was the continuation of the International Workshop on Computational Intelligence and Supercomputing Technology for Adaptive Agroindustry held by the Department of Agroindustrial Technology, Bogor Agricultural University last year.
Professor Kenneth A De Jong from George Mason University, US has successfully conducted joint international research with some staff from the Department of Agroindustrial Technology and Department of Computer Science, Bogor Agricultural University. The research aims to develop an integrated and intelligent system (namely SMART-TIN©) for the design of adaptive agroindustrial system in order to achieve a sustainable agroindustry that can mitigate global climate change and at the same time secure food, water, energy and natural medicine supply.
We are certainly proud to have been able to assemble this event in IPB, Bogor. The range of participants and audience at this conference is precisely something I would like to stress. The main goal of the conference is to provide an effective forum for distinguished speakers, academicians, professional and practitioners coming from universities, research institutions, government agencies and industries to share or exchange their ideas, experience and recent progress in Adaptive and Intelligent Agroindustry.
Distinguish Guest, Ladies and Gentlement,
Global climate change is the most challenging problems for us today and in the near future. This global change in our climate can lead to the shortage of the food, water, bioenergy and natural medicine that will affect the quality of human life. Many studies indicate that the threat of food, water, bioenergy and natural medicine crisis due to global climate change still worries our society. This problem can be solved by the development of agroindustry, i.e. an interrelated value chain entities from farming, to agro-processing industry and then to the end-customers. In fact, the design of agroindustry is complex and involves many factors and large data bases and more importantly, needs a good intelligence to process data and information to good decisions. Therefore, the way to design and manage agroindustry should be improved in order to meet the design objectives.
Agroindustries consume quite significant amount of energy on one side, on the other side they generate sizable amount of industrial wastes and its utilization as a captive energy resource is a kind of potential. Based on our study, a plywood industry with the production capacity of 200.000 m3/year could generate 32 percentage of solid waste. If this amount of waste used as an energy alternative, it may result on the saving of 131.037.768.597 rupiah per month. Similar to plywood industry, sugarcane industry with the production capacity of 480 ton per hour could generate 154 ton per hour of waste (bagasse) and this amount of waste contribute to the saving of energy consuming by 19.250 Kwh. Recent study we conducted, indicated that cassava starch industry may contribute to a significant amount of waste. It has also potential usage as an energy resource. Based on our study the conversion of its waste into energy will contribute to the saving of energy usage of 4100 liter biogas per ton material.
reduced. The new, incremental energy contributions that can be obtained from waste biomass will depend on future government policies, on the rates of fossils fuel depletion, and on extrinsic and intrinsic economic factors, as well as the availability of specific residues in areas where they can be collected and utilized. All of these factors should be in detail examined to evaluate the development of the industrial waste contribution. Hope this conference will also discuss this issue in more detail as it is an important matter for all of us. We should no more think just how to produce high value product but it is also necessarily important how to keep our live in good quality by understanding following old saying…” only when the last tree has been cut, only when the last fish has been angled, and only when the last river has been polluted, then we realized that we could not eat money”.
I do not to take up any more of your time with these opening remarks. Let me simply thank you once again for sharing your thoughts with us. Here’s wishing every success for the conference. May Allah bless all of us.
Thank you for your kind attention,
AGENDA of
2
ndInternational Conference on Adaptive and Intelligent Agroindustry
(ICAIA)
Time Activities Room
Day 1 (16 September 2013)
08.00 – 09.00
Welcoming Address: Prof. NastitiSiswiIndrasti (Head of Dept TIN, Fateta, IPB)
Conference Opening: Prof. HerrySuhardiyanto(Rector of IPB) o ABET Certification announcement and short ceremony o Launching International Double Degree Master Program in
Innovation and Technopreneurship in Cooperation with University of Adelaide, Australia
o Soft-launching Master in Logistik Agroindustri (Agroindustrial Logistics)
Ballroom
10.00 – 10.45 (45’)
Opening Speeches:
Prof. IrawadiJamaran (Agroindustry Guru, IPB: 25’) Prof. Eriyatno (Industrial and System Engineering, IPB: 20’)
Ballroom
Session 1 10.45 – 11.15
(30’)
Keynote Speech Dr. YandraArkeman (IPB) Ballroom
11.15 – 12.00 (45’)
Keynote Speech Prof. Kenneth De Jong (George Mason University, USA) Ballroom
12.00 – 13.30
Moderator: Prof. EndangGumbiraSa’id (IPB) Invited Speakers (1-4) (4 x 20 minutes) Discussion (25 minutes)
Tentative Schedule: Prof. Kim Bryceson (Australia), Prof. SyamsulMa’arif (IPB), Prof. KudangBoro Seminar (IPB), Prof. HaruhiroFujita (Japan)
Ballroom
Moderator: Prof. Marimin (IPB) Invited Speakers (5-8) (4 x 20 minutes) Discussion (25 minutes)
Tentative Schedule: Dr. Gajendran (UK), Prof. Noel Lindsay (University of Adelaide), Dr. KuncoroHartoWidodo (UGM), Prof. UtomoSarjonoPutro (ITB)
Ballroom
Day 2 (17 September 2013) 08.00 – 08.30
(30’)
Registration
08.30 – 10.15 (105’)
Moderator: Prof. KudangBoro Seminar (IPB) Invited Speakers (9-12) (4 x 20 minutes) Discussion (25 minutes)
Prof. Egum (IPB), Prof. Marimin (IPB), Dr. AgusBuono (IPB), Dr. HeruSukoco (IPB) 10.15 – 10.30
12.30 – 13.30 (60’)
Lunch Break
13.30 – 15.00 (90’)
Open Discussion (Open Forum) with Prof. Kenneth De Jong
Topic: Foundations and Applications of Genetic/Evolutionary Algorithms
Ballroom
15.00 – 15.30 (30’)
Conference Closing Ballroom
15.30 – 17.00 (90’)
Indonesian Agroindustry Association (AGRIN) National Congress (PIC: Prof. Suprihatin)
Ballroom
17.00 – 17.45 (45’)
CONTENT LIST
Conference Committee
Welcoming Address ….……….………... i
Agenda of 2nd ICAIA 2013... iii
Content List …………..………...………... v
A. SMART-TIN© : An Integrated And Intelligent System For The Design Of Adaptive Agroindustry (A Conceptual Framework) (Yandra Arkeman)
1‐9.
B. GHG Emission Reduction By Waste Cooking Oil Recycling In Environmental Partnership Program Of Bogor City (Haruhiro Fujita, Atsushi Yoshimoto, Katsuyuki Nakano, Koji Okuhara, Noriaki Koide, Dadang Supriatna)
10‐16.
C. Challenge of Indonesian Logistics Infrastructure for Perishables Products (Kuncoro Hartoto Widodo, Yandra Rahardian Perdana, Joewono Soemardjito)
17‐28.
D. Design Of Grouping Traditional Market Distribution Using Fuzzy Clustering And Design of Routing of Packaging Cooking Oil From Distribution Center To Traditional Market Using Traveling Salesperson Problem– Genetic Algorithm in Indonesia (Case‐Jakarta) (Teja Primawati Utami, Syamsul Maarif, Yandra Arkeman, Liesbetini Hartoto)
29‐43.
E. Determining the degree of product rightness at the conceptual stage:A Case of the Low Cost Green Car (Ade Febransyah, Fransisca Tharia)
44‐53.
F. Co‐Composting Process Of Bagasse And Sludge From Sugarcane Industry With Influence Of Difference Initial C/N Value And Aeration (Andes Ismayana, Nastiti Siswi Indrasti, Tori Sane)
54‐62.
G. Analysis Of The Competitiveness Of The Agribusiness Sector Companies Using Porter's Five Forces (M. Hudori)
63‐72.
H. Design And Optimization Of Agro‐Scm For Food And Energy Security In Indonesia (Hoetomo Lembito, Kudang Boro Seminar, Nunung Kusnadi, Yandra Arkeman) Arifin, A. Fatikunnada)
100‐112.
L. Artificial Neural Network Model Based Capacitance Dielectric For Crackers Self‐ Life Prediction (Erna Rusliana Muhamaad Saleh, Erliza Noor, Taufik Djatna, Irzaman)
113‐121.
M. Characterizing Temporal Dynamic Of Weather Variability To Support Decision Making On Weed Control (Rizky Mulya Sampurno, Kudang B. Seminar, Yuli Suharnoto, Mohamad Solahudin)
N. Risk Management Model in Dairy Product Transportation With Fuzzy Logic Approach (Winnie Septiani, Yandra Arkeman)
131‐141.
O. Strategy to Increase Institutional Capacity of Farmer Groups to Support the Transportation System Agroindustry Products (Zulfiandri, Yandra Arkeman)
142‐156.
P. Adsorption Of Carotenoid From Palm Oil Methyl Ester By Using Attapulgite And Synthetic Silica Magnesium As Adsorbent (Sapta Raharja, Prayoga Suryadarma, Zuni Fitriyantini)
157‐163.
Q. High Accuracy Agroindustry Environment Monitoring System Based on Photonic Crystal Sensor Network (Mamat Rahmat, Muhamad Azis, Erus Rustami, Wenny Maulina, Kudang Boro Seminar, Arief Sabdo Yuwono, Husin Alatas)
164‐174.
R. Study on Effect ofTemperatureIncrease on the Productivity of Methanefrom POME Fermentation (Sarono, E. Gumbira Said, Ono Suparno, Suprihatin, Udin Hasanudin)
175‐180.
S. The Design and Implementation of Geographic Information Systems to Support Food and Energy Security (Arif Purnomo Muji Basuki, Yandra Arkeman, Musthofa)
181‐191.
T. Study Of White Crystal Sugar Distribution System In Indonesia (Suripto, Yandra Arkeman)
192‐199.
U. Corncob Biodelignification Process Using White Rot Fungi (Liesbetini Hartoto, Purwoko, Elis Nina Herliyana, Cucu Rina Purwaningrum)
200‐212.
V. Color Stability of Beet Dyes Label During Heating (Endang Warsiki, Asih Setiautami)
213‐219.
W Precipitation Classification Using LVQ on Dry Season Base on Global Climate Indices Case Study in Indramayu District (Indra Kelana Jaya, Agus Buono, Yandra Arkeman)
220‐225.
X. Wood Identification Type By Using Support Vector Mechine‐Based Image (A.A. Gede Rai Gunawan, Sri Nurdiati, Yandra Arkeman)
226‐232.
Y. Fuzzy Logic Systems and Applications in Agro‐industrial Engineering and Technology (Marimin, Mushthofa)
233‐241.
Risk Management Model in Dairy Product Transportation With Fuzzy
Logic Approach
Winnie septiani
Department ot Agroindustrial Technology Bogor Agricultural University
Yandra Arkeman
Department ot Agroindustrial Technology Bogor Agricultural University E-mail: [email protected]
ABSTRACT
Transportation risk management is an integral part of risk management to minimize the impact on efficiency, profitability and success of the operation. The critical point in the dairy product transport risk is on that is easily damaged products contaminated with bacteria due to improper handling of dairy. This study aims to: (1) Identify risks in dairy product transport, (2) analyzing and assessing risk in dairy product using fuzzy logic approach (3) Determination of risk management is based on a risk assessment phase 1 and phase 2. Transport activities in the agroindustry supply chain covering dairy delivery from farmers to dairy collectors, dairy delivery from the collector to the cooperatives and the delivery of dairy to the cooperative Dairy Processing Industry (IPS). Hierarchical Breakdown Structure (HRBS) is used as the basis of risk classification stage. Assessment and risk analysis performed using fuzzy logic approach. Determination of the magnitude of risk in the form of linguistic formulated and expressed in the form of IF THEN rule. The relationship between risk and risk factors described in the relation ship chain risk (risk dependency chain). Risk management performed on the transport activity that has the greatest chance of risk, which is the risk of transport cooperatives to IPS.
Keyword : risk transportation, dairy product, fuzzy logic, HRBS
1. INTRODUCTION
Assessment and risk analysis of transportation is an integral part of risk management to minimize the impact on efficiency, profitability and success of the operation. According to Coyleetal (2011), the risk of transport is the transfer of risk from the activities of goods/products are measured by the value of the probability and impact (severity) that could potentially affect the performance of the supply chain. Risk due to the low transport many handling operations every day. Errors in scheduling deliveries, loading and unloading process errors by labor and external disturbances such as road and weather conditions cause temporary disruption of transport material or product.
Tumala (2011) defined risk as a combination of the probability or frequency of occurrence and magnitude of the impact of the incident. Development of formal risk management processes have been carried out at this time. Risk management processis divided into four main stages such as risk identification, risk assessment, risk management strategies and the evaluation and monitoring of risk.
The critical point in the dairy product transport risk is on that easily damaged products contaminated with bacteria due to improper handling of dairy. Damage caused by the formation dairy as a result of lacticacid fermentation of lactosebycoli forms. Fermentation by these bacteria will cause the dairy to be changed and the aroma is not favored by consumers. To minimize contamination by micro organisms and inhibit the growth of bacteria in dairy that can be stored for longer so handling after milking farmer should be a major concern.
emergence of risk on any transport activity will cause harm to the major actors of dairy product, which is farmers, co-operatives and Dairy Processing Industry (IPS). Each of fender has an interest and agroindustry linkages dairy to keep dairy is not broken, ranging from milking at dairy farms up in processing. If the risk and the cause can be identified since the beginning of the risk management efforts can be planned appropriately.
This study aimsto: (1) Identify risks in dairy product transport, (2) analyzing and assessing risk in dairy product using fuzzy logic approach(3) Determination of risk management is based on a risk assessment phase 1 and phase 2.
2. METHODS
Transportation risk identification performed based dairy product transport risk category developed by Coyle et. al. (2011), which divides risks into six categories that is transportation risk of losing the product (product loss), the risk of damage to the product (product damage), the risk of contaminated products (product contamination), the risk of late delivery (delivery delay), disruptionof supply chain (supply chain interruption), security breaches (security breach). Risk factors will be identified based on six categories of the transportation risk.
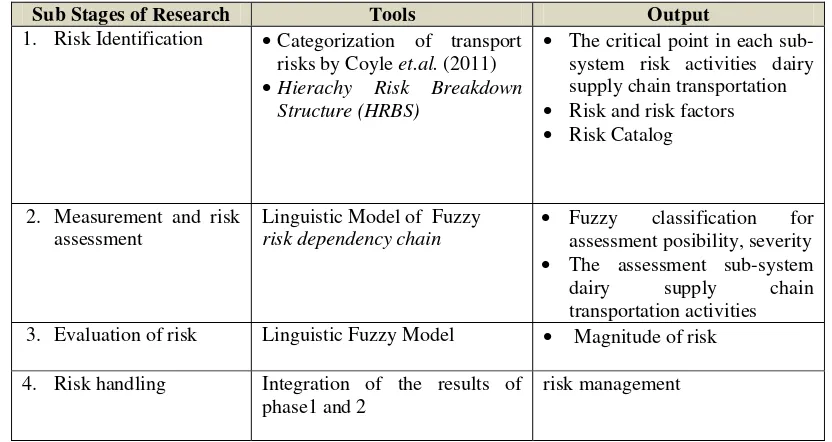
Stages of transportation risk management under taken include risk identification, risk analysis and risk management based on risk evaluation. Fuzzy set theory allows to model risk assessments kualititaif. By using fuzzy association, relationship between sources of risk and its consequences can be identified. Hierarchical Breakdown Structure (HRBS) is used as the basis of risk classification stage. The use of methods / tools at every stage and the results / outputs at each stage can be seen in Table 1.
Table1.The use of methods / tools and the results / outputs at each stage of the research
Sub Stages of Research Tools Output
1. Risk Identification Categorization of transport risks by Coyle et.al. (2011)
Hierachy Risk Breakdown Structure (HRBS)
The critical point in each sub-system risk activities dairy supply chain transportation
Risk and risk factors
Risk Catalog
2. Measurement and risk assessment
Linguistic Model of Fuzzy
risk dependency chain
Fuzzy classification for assessment posibility, severity
The assessment sub-system dairy supply chain transportation activities
3. Evaluation of risk Linguistic Fuzzy Model Magnitude of risk
4. Risk handling Integration of the results of phase1 and 2
effective for 24 hours. And at room temperature and a low level of contamination, bacteriostatic be active for 12 hours. However, the initial state of high bacterial populations, as well as the temperature of its environment, bacteriostatic activity will be short lived (± 2 hours). Therefore, the shorter the time needed to transport dairy the better.
One of the factors that constraint the people at the farmer level that is less hygienic sanitation systemat both the milking farmers, as well as at the level of collecting and Cooperatives of the KUD. Intake of dairy performed gradually twice a day according to the time of dairy, and are the morning. At the collector level test alcohol (alcohol precipitation test / APT) or boiled test (cloton boiling) and a specific gravity test. Reservoir level (KUD) 3 testing performed above also added the test fat, dry matter content (TS), dry matter without fat (SNF), methylene blue and total bacteria.
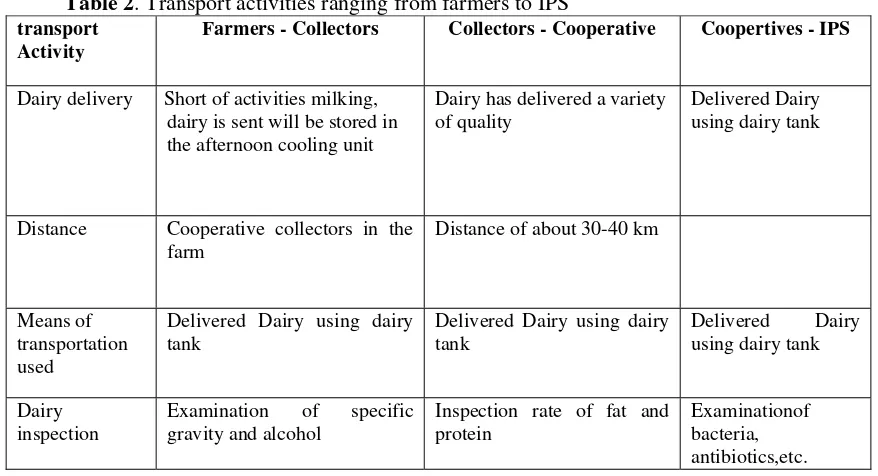
Dairycoolingis usuallyperformedatthe level ofa containerdairybefore it issent toIPS. Cooling dairy is one of the preservation efforts to maintain the quality of the dairy afte rmilking. If delivery of the dairy container to IPS performed on the same day (that day), dairy cooling is done at a temperature of 8-10C. But if the dairy delivery performed on different days (the next day) cooling needs to performed at a temperature of 4 Cand the temperature is kept constant. Transport activities ranging from farmers to the Dairy Processing Industry can be seen in Table 2.
Table 2. Transport activities ranging from farmers to IPS
transport Activity
Farmers - Collectors Collectors - Cooperative Coopertives - IPS
Dairy delivery Short of activities milking, dairy is sent will be stored in the afternoon cooling unit
Dairy has delivered a variety of quality
Delivered Dairy using dairy tank
Distance Cooperative collectors in the farm
Distance of about 30-40 km
Means of transportation used
Delivered Dairy using dairy tank
Delivered Dairy using dairy tank
Inspection rate of fat and protein
Examinationof bacteria, antibiotics,etc.
3.2 Categorization of risk based on the risk category of transportation Coyle et al (2011)
Transportation risks in the supply chain will be identified dairy product based transport six risk categories, each category of risk is decomposed into several more specific risks and is defined as shown in Table 3.
Table 3. Defining Risk categorization and Dairy product Transport
Category Specific Risk Definition
Product Loss Product pilferage Risk oflossdue totheftof dairy
Shipment Jettison The risk of dairy lossfordisposalProducttripfor safety reasons
Piracy and Hijacking The risk ofpiracyorillegal chargeson the way tothe
Category Specific Risk Definition
Product damage Equipment accidents The risk of dairy damage caused damage Tools and modes of transportation
Foor freight Handling The risk of damage due to the bad handling of dairy on the activities of loading and unloading and temporary storage
Improper Equipment The risk of damage caused by the use of dairy Tools are not according to their capacities and also use tools that do not address the transport mileage
Product contamination
Climate control failure Risks due to contamination of the dairy temperature and humidity settings are not right
Product tampering The risk of contamination dairy afte rmilking is done by only by a group of individuals to commit fraud to for gery dairy, through the addition of water, coconut water, coconut milk, rice water, dairy mask, goat dairy, sweetened condensed milk, and skim dairy
Exposure to contaminant The risk of dairy contamination because dairy is contaminated a substansi others, such as dust, left over food, fur, pathogenic bacteria, insecticides, antibiotics, etc.
delivery delay Congestion Risk dairy delivery delays caused due to traffic
congestion
Poor weather Risk of delivery delays due to weather factors natural dairy that can not be controlled, such as the disaster floods.
Equipment Malfunction The risk of delay in delivery due to damage in transport mode trips
Supply Chain Interruption
Carrier bankruptcy The risk ofsupplychain disruptionscaused bythe instability offinancialfirmsbecause ofthe economiccrisisandthe high price ofenergy(electricity, fueloil, etc.)
Capacity shortage The risk of supply chain disruptions caused by the transport capacity can not meet all requests
Labor disruptions and strikes Risks due to labor disturbances and strikes
Security Breach Shipment control breakdown Risk controld is order due to failure of delivery of security
Unprotected transfer facilities The risk of security breaches because no facility that allows the protection of the tand contamination of products
from environments that are relatively difficult to control. Center identified risk based on identified risk factors, which include product, people, equipment and the environment.
R A B C D Figure1 :Preparation ofAgendaTransportationRisk
Description :
A: Risk(by category of risk) B: Risk factors
C: Centerof risk (products/dairy (1), human (2), equipment (3), the environment (4) D: Type of risk (internal risk sources (1), external (2)
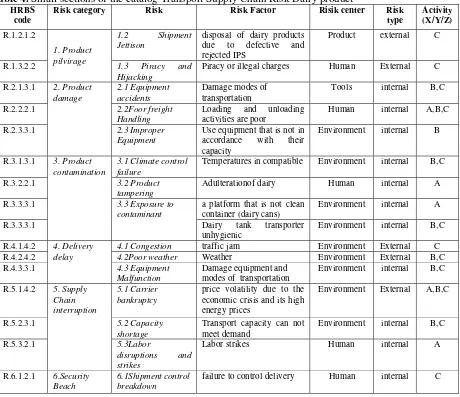
Small part of the risk catalog agroindustry supply chain transportation dairy is shown in Table 4.
able 4. Small sections of the catalog Transport Supply Chain Risk Dairy product
HRBS code
Risk category Risk Risk Factor Risik center Risk type
disposal of dairy products due to defective and rejected IPS
Product external C
R.1.3.2.2 1.3 Piracy and
Hijacking
Piracy or illegal charges Human External C
R.2.1.3.1 2. Product
Tools internal B,C
R.2.2.2.1 2.2Foor freight
Handling
Loading and unloading activities are poor
Human internal A,B,C
R.2.3.3.1 2.3 Improper
Equipment
Use equipment that is not in accordance with their capacity
Environment internal B
R.3.1.3.1 3. Product contamination
3.1 Climate control failure
Temperatures in compatible Environment internal B,C
R.3.2.2.1 3.2 Product
tampering
Adulterationof dairy Human internal A
R.3.3.3.1 3.3 Exposure to
contaminant
a platform that is not clean container (dairy cans)
Environment internal A
R.3.3.3.1 Dairy tank transporter
unhygienic
Environment internal B,C
R.4.1.4.2 4. Delivery delay
4.1 Congestion traffic jam Environment External C
R.4.2.4.2 4.2Poor weather Weather Environment External B,C
R.4.3.3.1 4.3 Equipment
Malfunction
Damage equipment and modes of transportation
Environment internal B,C
R.5.1.4.2 5. Supply Chain interruption
5.1 Carrier bankruptcy
price volatility due to the economic crisis and its high energy prices
Environment External A,B,C
R.5.2.3.1 5.2 Capacity
shortage
Transport capacity can not meet demand
Environment internal B,C
R.5.3.2.1 5.3Labor
failure to control delivery Human internal C
Description:
3.4 Assessment and Analysis Risk
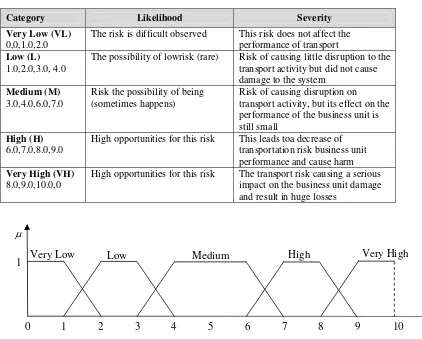
Assessment and risk analysis of transportation in the supply chainis divided into three dairy product transport activity is the delivery dairy from farmers to collectors cooperatives, dairy delivery from cooperative to cooperative collection, delivery of dairy cooperatives to IPS. Important characteristics to be considered in the risk assessment is the likelihood (probability) of occurrence of the risk and impact of the risk. Risk assessment can be performed using numerical valuesbut in this paper used the linguistic variables, very low (VL), low (L), medium (M), high (H) and very high (VH). Descriptive Interpretation of Fuzzy Membership Function representation for Severity, Likelihood can be seen in Table 5.
Table 5. Descriptive Interpretation of Fuzzy Membership Representation of Severity and Likelihood
Category Likelihood Severity
Very Low (VL)
0,0,1.0,2.0
The risk is difficult observed This risk does not affect the performance of transport
Low (L)
1.0,2.0,3.0, 4.0
The possibility of lowrisk (rare) Risk of causing little disruption to the transport activity but did not cause damage to the system
Medium (M)
3.0,4.0,6.0,7.0
Risk the possibility of being (sometimes happens)
Risk of causing disruption on transport activity, but its effect on the performance of the business unit is still small
High (H)
6.0,7.0,8.0,9.0
High opportunities for this risk This leads toa decrease of transportation risk business unit performance and cause harm
Very High (VH)
8.0,9.0,10.0,0
High opportunities for this risk The transport risk causing a serious impact on the business unit damage and result in huge losses
Figure2 : Graphical representation of Fuzzy Membership Function for Fuzzy Linguistic
Very Low Low Medium
1 0
1
2 3 4 5 6 7 8 9 10
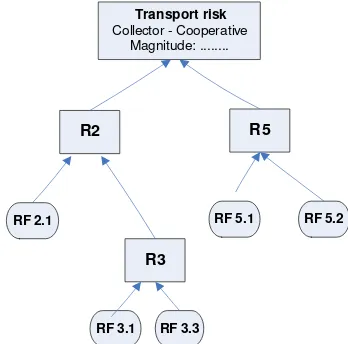
the values that affect the system. Likehood values and severity defined by the rules of IF THEN rule in to the magnitude of risk or impact of risk, risk factor values are determined by using a combination of fuzzy. Interdependence of risk (R) and risk factors (RF) determined during the process of identification and assessment of risk by using chain relationships (risk dependency chain) as shown in Figure1.2 and 3.
Transport risk
Collector - Cooperative Magnitude: ...
R2
R3
R5
RF 2.1
RF 3.3 RF 3.1
RF 5.1 RF 5.2
Figure3 : Chain Risk Relationsand Risk Factors for Container Transport Farmers
R2 is affected by RF2.1 and R3, R3 is affected by RF3.1 and RF3.3. R5 is affected by RF5.1 and RF5.2. The magnitude of the risk magnitude that occurred on the activities of farmers to transport container can be calculated based on the value of R2 and R5 risk. Severity and likelihood values measured and assessed in each risk factor. The same reasoning logic to chain relationship risk and risk factors to the cooperative transport of container (Figure 2) and risk of transportation cooperatives to IPS (Figure 3).
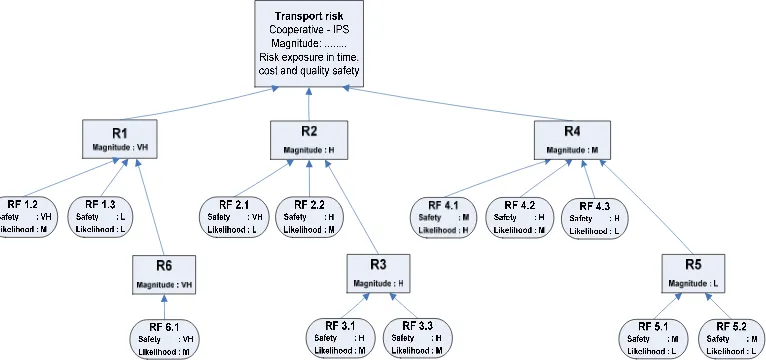
Figure4 : Risk Chain Relations and Risk Factors for Cooperative Transport Container
Risk is the case of the identification results is the risk of a cooperative transportation to IPS. Identified risks appear in all risk categories. R1 is influenced by risk factors RF1.2 and RF1.3. Value is also affected by the risk R1R6, which affected RF6.1. R2 is affected RF2.1 and RF2.2, is also influenced by the magnitude value of R3 risk. Magnitude of risk is influenced R4 R5 magnitude.
Transportrisk Collector-Cooperative
Magnitude: ...
Transportrisk Cooperative - IPS
Figure5 : Chain Risks and Risk Factors Relations Cooperative Transport to IPS
Determination of the magnitude of risk in the form of linguistic formulated and expressed in the form of IF THEN rule. IF the following proposition called the antecedent, while the following proposition THEN called the consequent. Relationship between the likelihood of occurrence L, V severity, and magnitude of risk E represented as follows:
R1 : IF L is mi AND S is ni THEN M is oi i = 1,2,3,...K
description: L: Likelihood S: Severity
m, n: constant linguistic antecedents (qualitatively defined function) M: magnitude of risk
o: constant consequent linguistic Example:
IF likelihood high AND severity is very high THEN magnitude risiko is very high
Table 6. Some IF THEN rule Prepared for Determination
Rule Probability Domain Fuzzy Severity Domain Fuzzy Impact
1 very low 0,0,1.0,2.0 very low 0,0,1.0,2.0 very low
2 very low 0,0,1.0,2.0 low 1.0,2.0,3.0, 4.0 very low
3 very low 0,0,1.0,2.0 medium 3.0,4.0,6.0,7.0 low
4 very low 0,0,1.0,2.0 high 6.0,7.0,8.0,9.0 high
5 very low 0,0,1.0,2.0 very high 8.0,9.0,10.0,0 high
Rule Probability Domain Fuzzy Severity Domain Fuzzy Impact
15 medium 3.0,4.0,6.0,7.0 very high 8.0,9.0,10.0,0 very high
16 High 6.0,7.0,8.0,9.0 very low 0,0,1.0,2.0 medium
17 High 6.0,7.0,8.0,9.0 Low 1.0,2.0,3.0, 4.0 medium
18 High 6.0,7.0,8.0,9.0 medium 3.0,4.0,6.0,7.0 medium
19 High 6.0,7.0,8.0,9.0 high 6.0,7.0,8.0,9.0 very high
20 High 6.0,7.0,8.0,9.0 very high 8.0,9.0,10.0,0 very high
21 very High 8.0,9.0,10.0,0 very low 0,0,1.0,2.0 medium
22 very High 8.0,9.0,10.0,1 Low 1.0,2.0,3.0, 4.0 medium
23 very High 8.0,9.0,10.0,2 medium 3.0,4.0,6.0,7.0 high
24 very High 8.0,9.0,10.0,3 high 6.0,7.0,8.0,9.0 very high
25 very High 8.0,9.0,10.0,4 very high 8.0,9.0,10.0,0 very high
Examples of calculation Example Calculation of the Fuzzy Risk Exposure Measurement Transport Cooperative-Dairy Processing Industry can be seen in Figure4. Severity and likelihood assessed for each risk factor. The magnitude of the risk magnitude based on the value of the risk factors.
Figure 4. Fuzzy Calculation examples in Risk Exposure Measurement Transport Cooperative-Dairy Processing Industry
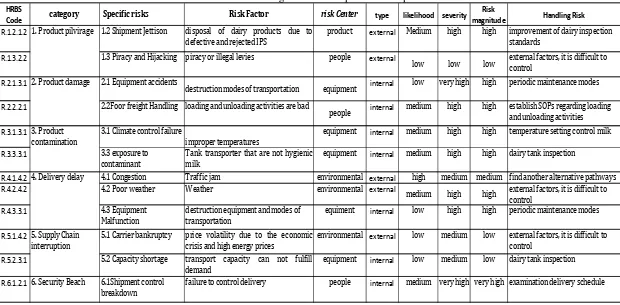
4.3 Risk Management
Table7. Search andRiskManagementofTransportationCooperativestoIPS HRBS
Code category Specificrisks RiskFactor
riskCenter type likelihood severity Risk
magnitude Handling Risk R.1.2.1.2 . Shipment Jettison disposal of dairy products due to
defective and rejected IPS product
external Medium high high improvement of dairy inspection standards
R.1.3.2.2 . Piracy and Hijacking piracy or illegal levies people external
low low low external factors, it is difficult to control
R.2.1.3.1 . Equipment accidents
destruction modes of transportation equipment internal low very high high periodic maintenance modes
R.2.2.2.1 . Foor freight Handling loading and unloading activities are bad
people internal medium high high establish SOPs regarding loading and unloading activities
R.3.1.3.1 . Climate control failure
improper temperatures equipment
internal medium high high temperature setting control milk
R.3.3.3.1 . exposure to
contaminant Tank transporter that are not hygienicmilk equipment
internal medium high high dairy tank inspection
R.4.1.4.2 . Congestion Traffic jam environmental external high medium medium find another alternative pathways
R.4.2.4.2 . Poor weather Weather environmental external
medium high high external factors, it is difficult to control
R.4.3.3.1 . Equipment
Malfunction destruction equipment and modes of transportation equiment
internal low high high periodic maintenance modes
R.5.1.4.2 . Carrier bankruptcy price volatility due to the economic
crisis and high energy prices environmental
external low medium low external factors, it is difficult to control
R.5.2.3.1 . Capacity shortage transport capacity can not fulfill
demand equipment
internal low medium low dairy tank inspection
R.6.1.2.1 . Security Beach . Shipment control
breakdown failure to control delivery people
internal medium very high very high examination delivery schedule . Supply Chain
interruption . Product pilvirage
. Product damage
. Product contamination
5. CONCLUSION
1. Identify the risk of transport is divided into three activities, namely transport of farmers to collector, collector to transport cooperatives, cooperative transportation to IPS. Opportunity risk is greatest in transportation cooperative activities to IPS. Risk identification results prepared using the Hierarchy of Risk Breakdown Structure (HRBS), which sub sequently made into a catalog of risk so that searches can be more easily carried out risk
2. Assessment and risk analysis performed using fuzzy logic approach. Determination of the magnitude of risk in the form of linguistic formulated and expressed in the form of IF THEN rule. The relationship between risk and risk factors described in the relationship chain risk (risk dependency chain)
3. Handling risk carried on transport activities that have the greatest chance of risk, ie the risk of transportation cooperatives to IPS.
REFERENCES
[1] Bragli,M. Frosolini,M. 2003. Fuzzy Critically Assessment Model for Failure Modes and Effects Analysis. Journal of Quality & Reliability Management 20(4) : 503 -524
[2] Coyle,J et al. 2011. Transportation : A Supply Chain Perspektif. Southwern Cengage Learning
[3] David,H. 2003. Using a Risk Breakdown Structure in Project Management. Journal of Facilities Management 2 (1) : 85-97
[4] Fuller, B.A. 2009. Managing Transportation Safety and Security Risk. Chemical Engineering Progress : 25 – 29
[5] Mishra,P.K. Shekhar, B.R. 2011. Impact of Risk and Uncertainties on Supply Chain : A dairy industry Perspective. Journal of Management Research. Vol 3 No.2 E11.
[6] Tummala, R. 2011. Assesing and Managing Risks using the Supply Chain Risk management Process (SCRMP). Supply Chain Management : An International Journal 14(4) : 247 -252 [7] Marlina,E.T., Hidayatai, Y.A dan Juanda,W. Kualitas Mikroba pada ruang penampungan
susu dan pengaruhnya terhadap jumlah bakteri dalam air susu. Fakultas peternakan. Univeristas Pajajaran
[8] Tah,J.H.M.,Carr,V. 2001. A Fuzzy Approach to Construction Project Risk Assesment and Analysis : Construction Project Risk Management System. Advance Engineering Software 32 : 847-857