Gadjah Mada International Journal of Business Vol. 16, No. 3 (September-December 2014): 243-254
The Market Quality to Technical Analysis Performance:
Intercountry Analysis
Jogiyanto Hartono
aand
Dedhy Sulistiawan
ba Faculty of Economics and Business, Universitas Gadjah Mada, Indonesia b Faculty of Business and Economics, Universitas Surabaya, Indoneasia
Abstract: The main objective of this research is to discuss the impact of market quality on technical analysis profitability using inter-country analysis. Market quality is proxied by market capitalization. Tech-nical analysis performance (profitability) is calculated using techTech-nical analysis return for MA5 indicator and short transaction strategy. This study uses the OSIRIS and Yahoo Finance databases. Using 21 countries with 50 companies for each country, this study finds that market quality affects technical analysis perfor-mance. Robustness tests are conducted for longer moving average indicators that are MA10 and MA15. To make sure that the results are not sensitive toward the strategy used, other robustness tests are con-ducted by using short and long-short transaction strategies. All robustness tests confirm the findings. Abstrak: Tujuan utama dari penelitian ini adalah untuk membahas dampak dari kualitas pasar bursa saham terhadap profitabilitas analisis teknis dengan menggunakan analisis pasar saham antarnegara. Kualitas pasar diproksikan dengan kapitalisasi pasar. Kinerja analisis teknikal (profitabilitas) dihitung dengan menggunakan analisis teknis berpatokan pada perdagangan forex indikator MA5 dan strategi transaksi pendek. Penelitian ini menggunakan database OSIRIS dan Yahoo Finance yang berasal dari 21 negara dengan jumlah total 50 perusahaan untuk masing-masing negara. Hasil penelitian menunjukan bahwa kualitas pasar mempengaruhi kinerja analisis teknikal. Tes ketahanan dilakukan untuk melihat lama bergerak indikator rata-rata dari rata-rata perpindahan 10 (MA10) sampai MA15. Untuk memastikan bahwa hasil penelitian ini tidak sensitif terhadap strategi yang digunakan, tes ketahanan lainnya dilakukan dengan menggunakan strategi transaksi pendek serta gabungan strategi panjang dan pendek. Semua tes ketahanan yang dilakukan mengkonfirmasi temuan di atas.
Keywords: long strategy; market quality; moving average; short strategy; technical analysis performance
Introduction
The main objective of this research is to examine the impact of market quality on technical analysis profitability using inter-country analysis. This issue is very important to bridge technical analysis studies, because previous studies have produced different re-sults between developing countries and de-veloped countries. Technical analysis signals in developed markets, such as in the United States (U.S.) and the United Kingdom (UK), produce lower performances than those in developing markets such as countries in South America (McKenzie 2007), Eastern Europe (Fifield et al. 2005), and Asia (Ahmed et al. 2000). Those results suggest that market qual-ity of a country affects its technical analysis performance, but none of the studies directly examines this idea.
Previous studies only compared tech-nical analysis returns of each country with U.S. stock returns. Most Asian markets pro-duce better returns than returns in the US market. They use the US market as a bench-mark (Bessembinder and Chan 1995). Tech-nical analysis returns in the Greece market are more dominant than those in the US mar-ket (Milionis and Papanagiotou 2008). An-other study divides stock market quality based on large and small categories with a nominal scale and only uses European stock markets (Fifield et al. 2005).
This study expands previous studies by (1) expanding the idea using international data, and (2) upgrading market quality proxy from nominal scale to ratio scale as an im-portant determinant for technical analysis returns.
In their seminal article, Jensen and Meckling (1976) describe how ownership pro-portion will affect managers’ behavior. The
proportion of ownership itself is also influ-enced by law and investor protection in a country (La Porta et al. 1998)
When the protective laws for outside investors are enforced, outside investors will tend to fund the company, and ownership becomes more valuable and more dispersed. Conversely, when the law does not protect the interests of investors, the growth of capi-tal markets is not fast (La Porta et al. 2002) and the firms’ ownership becomes more con-centrated (La Porta et al. 1998). As a result, companies’ financial statements in countries with poor enforcement and high ownership concentration are considered less reliable than those in the countries with high enforcement and low ownership concentration. Conse-quently, information outside the financial statements are needed. One of these is tech-nical analysis signals information. In low markets quality countries, markets are less efficient than that in high quality countries. It means that technical analysis performance will be more (less) useful in countries with low (high) stock market quality.
This paper is organized as follows. Sec-tion 2 presents a literature review. SecSec-tion 3 discusses the research methodology. Empiri-cal results and analysis are presented in Sec-tion 4. In the final secSec-tion, this study states its conclusions.
Literature Review and
Hypothesis Development
Fama and Blume (1966). The results provide support for the use of technical analysis. Sweeney (1988), Brock, Lakonishok, and LeBaron’s (1992) studies use the method of variable-length moving average (VMA) and fixed-length moving average (FMA), and the trading range break-out (TRB). Their results support the use of technical analysis.
According to Shleifer and Vishny (1997), the main reason for stock investors providing external funding is to obtain vot-ing rights. In countries with weaker legal sys-tems, minority shareholder voting rights are not respected. This condition will discourage them from holding stocks for long periods. In countries with good protection, minority in-vestors tend to be willing to conduct long-term investment due to a legal certainty that is sufficient to get the dividend and principal value of their investment. Conversely, in low protection countries, minority investors have no incentive to keep stock for long periods. Those conditions stimulate different invest-ment strategies. In good investor protection countries, stock prices and dividends are higher than those in bad investor protection countries (La Porta et al. 2000a and 2000b) because long-term investment will maintain the price of stocks at a higher level. Con-versely, short-term investing strategy will pro-duce bigger volatility.
Technical analysis is used for short-term investments. It means that investors do not intend to invest in long-term horizon. Based on that condition, short-term investments analysis will be used by many investors. When many investors make long term investments, the price will be relatively higher. This was shown by La Porta et al. (2002). Previous studies also indicate that the technical analy-sis signal is reliable in developing markets, but not in developed markets (Fifield et al. 2005 and McKenzie 2007).
Bessembinder and Chan (1995) exam-ine the performance of VMA, FMA and TRB in the markets of Japanese, Hong Kong, South Korea, Malaysia, Thailand and Taiwan, as well as the market in the United States (U.S.) as a benchmark. In all those countries, except the U.S., technical analysis produces good performances. Ahmed et al. (2000) also examine developing markets with high vola-tility and a declining trend. The results show that the performances of technical analysis are better than those of buy and hold strategy, except on the U.S. stock market. The study of McKenzie (2007) also uses VMA, FMA and TRB methods. He shows that perfor-mances of technical analysis in developing countries are better than those in developed countries. In European markets, the research by Fifield et al. (2005) also reaches the same conclusions. Smaller European markets pro-vide benefits to users of technical analysis, but technical analysis signals are not useful for the larger European markets.
In Indonesia, Sulistiawan and Hartono (2014) give evidence that technical analysis signals before earnings announcements pro-duce profit. In that situation, technical analy-sis signals capture price reaction before earn-ings announcements. Conversely, technical analysis signals after earnings announcements do not produce profit because stock prices are not stimulated by new information. That study gives evidence about the conditions affecting technical analysis return. In short, using Indonesian market data they show that technical analysis signals around earnings announcements are useful.
technical analysis. Technical analysis indica-tors produce good (bad) performances in low (high) quality stock markets as reported by McKenzie (2007); Fifield et al. (2005); Ahmed et al. (2000); Bessembinder and Chan (1995); Millionis and Papanagiotou (2008). Based on the above discussions, this study hypothesizes that stock market quality nega-tively affects technical analysis performance.
Data
Data for this study are taken from Osiris and Yahoo Finance databases. Sample con-sists of firms in countries listed in the OSIRIS database. Lara et al. (2006) show that the OSIRIS database tends to provide bigger companies in a certain country. This study uses market returns of 21 countries that have to be available in both of Yahoo Finance and OSIRIS. Stock price data are collected from Yahoo Finance database. These data are needed to calculate technical analysis returns based on technical analysis signals.
This study observes companies around the world in 2010 and 2011. The main inter-est of this study is year 2011, because in that year, world stock markets returns declined. Conversely, in 2010, the world stock markets returns tended to rise. By using the different market conditions in these two years, this study covers both bearish and bullish mar-kets. Another reason why this study only uses two years’ data is because each year has to be observed with a lot of technical analysis signals for 21 countries with three support-ive methods namely MA5, MA10, and MA15. Number of technical analysis signals obtained from MA5, MA10, MA15 are 2,598; 1,690; 1,262 respectively for long strategy. For short strategy, the number of technical analysis sig-nals obtained from SMA5, SMA10, SMA15 are 2,592; 1,674; 1,224 respectively. There-fore, the total number of technical analysis
signals used in this research are 11,040 sig-nals.
Empirical Models
This study employs the regression model to test the hypothesis. This study uses coun-try level in the measurement where subscript i represents the country, and t represents the year. The regression model is as follows.
TAPi,t= a + b1.MQUALi,t +
b2.YEFFECTi,t + e1i,t... (1a)
AdjtTAPi,t= a + b1.MQUALi,t +
b2.YEFFECTi,t +e1i,t.. (1b)
TAPi,t is a technical analysis performance; AdjtTAPi,t is a technical analysis performance after adjusted by buy and hold return for each country-i for each period-t; MQUALi,t is the market quality for each country-i for each period-t; YEFFECTi,t is a dummy variable to control for year effects.
Operational Definition of
Variables
Variables that are used in the regression model are measured as follows.
Rsell-buy,k,i,t = (Pk,s,I – Pk,b,c) / Pk,b,i ... (2)
TAPsell-buy,i,t = Rsell-buy,k,i,t... (3)
Where TAPsell-buy,i,tis cumulative returns gen-erated from a buy signal that is followed by a sell signal for market index in a country-i. Using return of buy and hold, this study ad-just the value of TAPsell-buy,i,t.Return of buy and hold strategy (Rbh,i,t ) and adjTAPi,t are calcu-lated as follows.
Rbh,i,t = (Pend,c - Pbegin,i ) / Pbegin,i...(4)
AdjtTAPi,t = TAPsell-buy,i,t - Rbh,i,t ...(5)
Return of buy and hold strategy (Rbh,i,t) is calculated by the difference of ending hold-ing price (price of the last sell signal for the period) from the beginning holding price (price of the first buy signal for the period) divided by the beginning holding price. AdjTAPi,t is actually a net return between technical analysis return after adjusted by buy and hold return and calculated by deducting TAPsell-buy,i,t with Rbh,i,t.
In technical analysis, price on sell sig-nal and price of buy sigsig-nal for each technical analysis signal can be determined using vari-ous methods. In many references of techni-cal analysis, for example, Luca (2000) and technical analysis software such as Meta Stock or Chart Nexus, provide many techni-cal analysis indicators that can be used to generate a buy or sell signal. This study uses the Moving Average (MA) that produced good performance in previous researches [Milionis and Papanagiotou 2008; McKenzie 2007; Fifield Fifield et al. 2005; Wonget al. 2003; Ahmed et al. 2000; Bessembinder and Chan 1995; and Brock et al. 1992).
In addition, Moving Average (MA) in-formation is also available on Yahoo Finance
as well as in technical analysis softwares. The MA method used is the same with VMA (Variable-length MA), which means the time scale/the time period between buy and sell signals varies. The formula is presented as follow.
MAi,n =(Pi,n+Pi,n-1+….+Pi,1)/n... (6)
Pn is the price n days ago for country i. P1 is the price of 1 day ago for country i.This study uses three indicators: MA5, MA10, and MA15. The symbol n is the period used in this study using the indicator, where n is 5,10, and 15 for MA5, MA10, and MA15, respec-tively. Buy signal occurs when the stock price the day 0 (P0) crosses up MA line, where P0> MA and P-1<MA-1. Sell signal occurs when the stock price on day 0 (P0) crosses down MA line, where P0<MAn and P-1> MA-1. The symbol of -1 represents one-day before tech-nical analysis signals.
MQUALi,t is the market quality for 50 companies for each country-i for each period-t. Measurement of market quality is proxied by the average of market capitalization of stocks in the sample in each country. A study by Fifield Fifield et al. (2005) classifies the European market using categorical scale. This study uses not only European countries, but also uses broader data, i.e international data. To improve the quality of data, this study does not only use categorical data, but uses ratio scale to measure market capitalization. Market capitalization is measured with its natural logarithm value.
This study believes that the regression coefficients vary between years. This study expects that market quality negatively affects technical analysis performance. The hypoth-esis is accepted if b1 coefficient significantly negative.
Robustness Tests
To make the results robust, some ef-forts are conducted as follows.
1. This study does not use one stock trading strategy only. In addition to using MA5, this study also uses MA10, and MA15 to test whether shorter or longer days have different effects.
2. For the technical analysis strategy, this study not only employs long strategy, but also short strategy, and the combination between long and short strategy.
a. For long strategy, technical analysis buy signal is recognized first followed by sell signal.
b. Short strategy is the reverse where tech-nical analysis sell signal is recognized first followed by buy signal. Short strategy is conducted for short selling, where inves-tor sells a stock shortly and then buys the stock when the price falls.
c. For long and short strategy, return is cal-culated from the combination of short and long strategies. Price determination is be-coming the reference return that is the daily closing price at the time the signal has emerged. At the end of the measure-ment period, the last closing price is used as a reference for the calculation of the last return.
Results
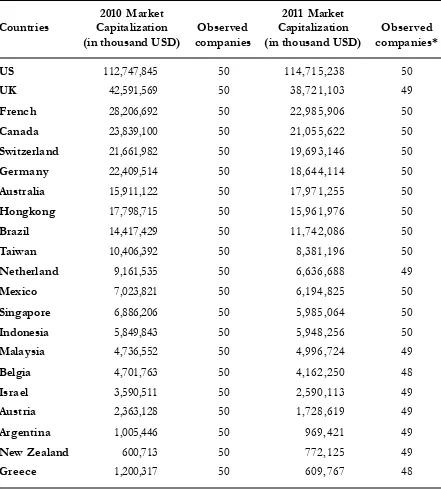
Market capitalization is a proxy for stock market quality. The market capitaliza-tion for each country is shown in Table 1.
Table 1 shows that companies in US and UK markets dominate the value of market capitalization. According to this measure, Greece, New Zealand, and Argentina are ex-amples of stock markets with low market capitalization.
The hypothesis predicts that stock mar-ket quality negatively affects technical analy-sis performance. Market quality (MQUAL) proxies market capitalization. Results of the regression are presented in Table 2. The re-siduals of those regressions are normally dis-tributed and no autocorrelation problems are found.
According to the Table 2, long strate-gies using all indicators show that coefficients for market capitalization negatively affect technical analysis returns. The MQUAL co-efficients for MA5, MA10, and MA15 are 0.023 (tvalue is 1.689 significant at 5%), -0.031(t-value is -2.644 significant at 1%), and -0.019 (t-value is -1.343 significant at 10%), respectively.
Table 1. The Market Capitalization
2010 Market 2011 Market
Countries Capitalization Observed Capitalization Observed
(in thousand USD) companies (in thousand USD) companies*
US 112,747,845 50 114,715,238 50
UK 42,591,569 50 38,721,103 49
French 28,206,692 50 22,985,906 50
Canada 23,839,100 50 21,055,622 50
Switzerland 21,661,982 50 19,693,146 50
Germany 22,409,514 50 18,644,114 50
Australia 15,911,122 50 17,971,255 50
Hongkong 17,798,715 50 15,961,976 50
Brazil 14,417,429 50 11,742,086 50
Taiwan 10,406,392 50 8,381,196 50
Netherland 9,161,535 50 6,636,688 49
Mexico 7,023,821 50 6,194,825 50
Singapore 6,886,206 50 5,985,064 50
Indonesia 5,849,843 50 5,948,256 50
Malaysia 4,736,552 50 4,996,724 49
Belgia 4,701,763 50 4,162,250 48
Israel 3,590,511 50 2,590,113 49
Austria 2,363,128 50 1,728,619 49
Argentina 1,005,446 50 969,421 49
New Zealand 600,713 50 772,125 49
Greece 1,200,317 50 609,767 48
Table 2. The Impact of Market Quality (Capitalization) to Technical Analysis Perfor-mance
Dependent Variable: TAP
Long Strategy
n=42 M A 5 M A 10 M A 15 n=42 M A 5 M A 10 M A 15
Intercept 0.309 0.467 0.316 YEFFECT 0.148 0.068 0.025
Stat.t 1.430 2.471 1.387 Stat.t 4.278 2.243 0.690
Sig. * *** * Sig. *** ***
-MQUAL -0.023 -0.031 -0.019 Durbin-watson 1.701 1.759 1.805
Stat.t -1.689 -2.644 -1.343
Sig. ** *** *
Notes: ***, **, and * denote significance at the 1 percent, 5 percent, and 10 percent levels, respectively (one-tailed test). TAP is technical analysis performance. MQUAL is market quality. That is represented by the average of market capitalization of companies in sample countries. YEFFECT= 1 when year is 2011, and 0 otherwise. Residuals are normally distributed.
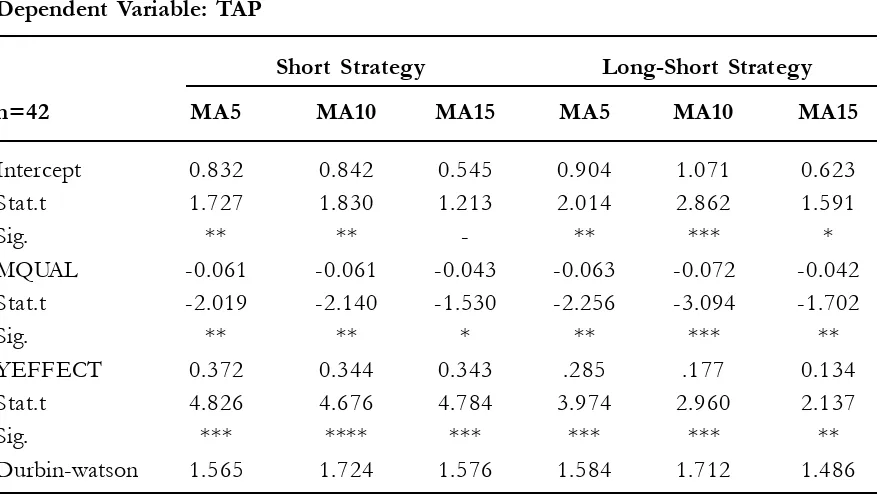
Table 3. The Impact of Market Quality (Capitalization) to Technical Analysis Perfor-mance: Robustness Tests
Dependent Variable: TAP
Short Strategy Long-Short Strategy
n=42 MA5 MA10 MA15 MA5 MA10 MA15
Intercept 0.832 0.842 0.545 0.904 1.071 0.623
Stat.t 1.727 1.830 1.213 2.014 2.862 1.591
Sig. ** ** - ** *** *
MQUAL -0.061 -0.061 -0.043 -0.063 -0.072 -0.042
Stat.t -2.019 -2.140 -1.530 -2.256 -3.094 -1.702
Sig. ** ** * ** *** **
YEFFECT 0.372 0.344 0.343 .285 .177 0.134
Stat.t 4.826 4.676 4.784 3.974 2.960 2.137
Sig. *** **** *** *** *** **
Durbin-watson 1.565 1.724 1.576 1.584 1.712 1.486
In long-short strategy, market capitali-zation negatively affects technical analysis return, but only one indicator that is signifi-cant. It is MA15. The MQUAL coefficients for MA5, MA10, and MA15 are -0.063 value is -2.356 significant at 5%), -0.072 (t-value is -3.094 significant at 1%), and -0.042 (t-value is -1.702 significant at 5%), respec-tively. As a control variable, YEFFECT is used to control the year effect. YEFFECT coefficients are significant for all indicators and strategies.
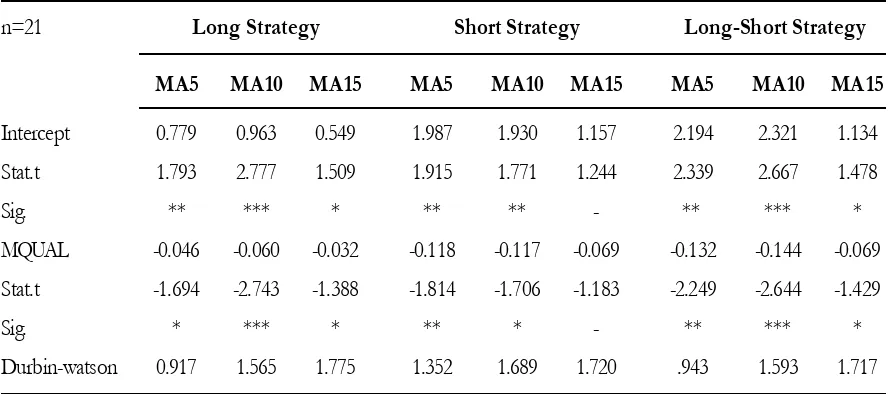
Using technical analysis return data 2010 and 2011, a robustness test was also conducted to calculates technical analysis returns after adjusted by buy and hold returns. That variable is used as dependent variable. The independent variable is MQUAL. The results are presented in Table 4.
According to the results on Table 4, the MQUAL coefficients are statistically
signifi-cant for all strategies and indicators, except in short strategy using MA15 indicator. In long strategy, the MQUAL coefficients for MA5, MA10, and MA15 are 0.046 (tvalue is 1.694 significant at 10%), 0.060 (tvalue is -2.743 significant at 1%), and -0.032 (t-value is -1.388 significant at 10%), respectively. In long strategy, the MQUAL coefficients are -0.118 (t-value is -1.814 significant at 5%) for MA5, -0.117 (t-value is -1.706 significant at 10%) for MA10, and -0.069 (t-value is -1.183 insignificant) for MA15.
In long-short strategy, market capitali-zation also negatively significant affects tech-nical analysis return after buy and hold. The MQUAL coefficients for MA5, MA10, and MA15 are -0.132 (t-value is -2.249 cant at 5%), -0.144 (t-value is -2.644 signifi-cant at 1%), and -0.069 (t-value is -1.429 sig-nificant at 10%), respectively.
Table 4. The Impact of Market Quality on Two-years Technical Analysis Returns After being Adjusted by Buy and Hold Returns
Dependent variable: AdjTAP
n=21 Long Strategy Short Strategy Long-Short Strategy
MA5 MA10 MA15 MA5 MA10 MA15 MA5 MA10 MA15
Intercept 0.779 0.963 0.549 1.987 1.930 1.157 2.194 2.321 1.134
Stat.t 1.793 2.777 1.509 1.915 1.771 1.244 2.339 2.667 1.478
Sig. ** *** * ** ** - ** *** *
MQUAL -0.046 -0.060 -0.032 -0.118 -0.117 -0.069 -0.132 -0.144 -0.069
Stat.t -1.694 -2.743 -1.388 -1.814 -1.706 -1.183 -2.249 -2.644 -1.429
Sig. * *** * ** * - ** *** *
Durbin-watson 0.917 1.565 1.775 1.352 1.689 1.720 .943 1.593 1.717
According to some robustness tests, re-sults provided by this study are convincing. Therefore, the hypothesis is supported. It means that market quality negatively affects technical analysis performance.
Discussion
This study discusses the impact of stock market quality on technical analysis perfor-mance. Stock market quality is proxied by market capitalization for the biggest 50 com-panies in 21 countries.
Previous studies only compared tech-nical analysis returns of each country like those of the U.S. (Bessembinder and Chan, 1995). Most Asian markets produce better returns than the US market’s returns. They use the US market as a benchmark.
Milionis and Papanagiotou (2008) present the simulation that both Greece and US markets produce positive returns based on technical analysis indicators. After being adjusted by buy and hold returns, technical analysis still produces positive returns in the Greece market. Conversely, it generates nega-tive returns in the US market.
Technical analysis generates bigger (lower) return in emerging (developed) stock markets. This study not only confirms previ-ous studies, but also enriches the methods by using ratio scale in market quality and data coverage. Using global stock market data available from Yahoo Finance, this study pro-vides evidence that market quality affects technical analysis performance.
In US, UK, France, Canada, Switzer-land, Germany, Australia and Hong Kong, technical analysis signals do not produce prof-itable returns. Conversely, in Indonesia, Ma-laysia, Belgium, Israel, Austria, Argentina, New Zealand, and Greece, developing
coun-tries, technical analysis produces more posi-tive returns. It means that in developing coun-tries, technical analysis signals are profitable. This study not only uses different indi-cators (MA5, MA10, and MA15), but also different trading strategies (long, short, and long-short). Because of different market con-ditions in 2010 and 2011, this study also uses two-year technical analysis returns to provide a longer duration of technical analysis per-formance test. In 2011 (2010), short (long) strategies produce negative returns. In long or short strategies, MA5 produce bigger re-turns than those for longer MA10 and MA15. These result confirm the study of Wong et al. (2002).
This study not only contributes to theo-retical and methodological aspects of ment, but also gives insight to global invest-ment managers about an alternative strategy, i.e. technical analysis, when they are creating their stock portfolios.
Conclusion
To expand this study, there are several developments that could be used. First, this study could be enriched with a broader sample
of countries. Second, this study could be de-veloped by using different indicators besides moving average (MA).
Acknowledgement
The authors gratefully acknowledge Faculty of Economics and Business at Universitas Gadjah Mada for supporting this study. The authors also appreciate the comments of research seminar participants at Universitas Gadjah Mada.
References
Ahmed, P., K. Beck, and E. Goldreyer. 2000 Can moving average technical trading strategies help in volatile and declining markets? A study of some emerging asian markets. Managerial Finance 26 (6): 49-62.
Bessembinder, H., K. Chan. 1995. The profitability of trading rules in the Asian stock markets. Pasific-Basin Finance Journal 3: 257-284.
Brock, W., L. Lakonishok, and B. LeBaron. 1992. Simple technical trading rules and the stochastic prop-erties of stock returns. Journal of Finance 47 (5): 1731-1764.
Fama, E. F., and M. E. 1966. Filter rules and stock-market trading. Journal of Business 39: 226-241. Fifield, S. G. M., D. M. Power, and C. D. Sinclair. 2005. An analysis of trading strategies in eleven european
stock markets. European Journal of Finance 11: 531-548.
Jensen, M. C., and W. H. 1976. Theory of the firm: Managerial behavior, agency costs and ownership structure. Journal of Financial Economics 3 (4): 305-360.
La Porta, R., F. Lopez-de-Silanes, A. Shleifer, and R. W. Vishny. 1998. Law and finance. Journal of Political Economy 106: 1113-1155.
La Porta, R., F. Lopez-de-Silanes, A. Shleifer, and R. W. Vishny. 2000a. Agency problems and dividend policies around the world. Journal of Finance 55: 1-33.
La Porta, R., F. Lopez-de-Silanes, A. Shleifer, and R. W. Vishny. 2000b. Investor protection and corporate governance. Journal of Financial Economics 58: 3-27.
La Porta, R., F. Lopez-de-Silanes, A. Shleifer, and R. W. Vishny. 2002. Investor protection and corporate valuation. Journal of Finance 57: 1147–1170.
Lara, J. M. G., B. G. Osma, and B. Gill-de-Albornoz. 2006. Effects of database choice on international accounting Research. Abacus 42 (3-4): 426-454.
Luca, C. 2000. Technical Analysis Applications in the Global Currency Markets (2nd ed.). Institute of Finance,
New York.
McKenzie, M. D. 2007. Technical trading rules in emerging markets and the 1997 Asian currency crises.
Emerging Markets Finance and Trade 43 (4): 46-73.
Shleifer, A., and R. W. Vishny. 1997. A survey of corporate governance. Journal of Finance 52 (2): 737-783. Sulistiawan, D., and J. Hartono. 2014. Can technical analysis signals detect price reaction around earnings announcement? Evidence from Indonesia. The International Journal of Business and Finance Research 8 (1): 113-123.
Sweeney R. J. 1988. Some new filter rule tests: Methods and results. Journal of Financial and Quantitative Analysis 2 (3): 285-300.