ContentslistsavailableatScienceDirect
Resources,
Conservation
and
Recycling
j ou rn a l h o m epa g e :w w w . e l s e v i e r . c o m / l o c a t e / r e s c o n r e c
Community
participation
in
household
solid
waste
reduction
in
Surabaya,
Indonesia
Yeny
Dhokhikah
a,c,∗,
Yulinah
Trihadiningrum
a,
Sony
Sunaryo
baDepartmentofEnvironmentalEngineering,InstitutTeknologiSepuluhNopember,Indonesia bDepartmentofStatistics,InstitutTeknologiSepuluhNopember,Indonesia
cDepartmentofCivilEngineering,UniversitasJember,Indonesia
a
r
t
i
c
l
e
i
n
f
o
Articlehistory:
Received6March2015
Receivedinrevisedform17June2015 Accepted22June2015
Keywords:
Communityparticipation Householdsolidwastereduction EasternSurabaya
a
b
s
t
r
a
c
t
Thegoalofthisstudywastoexaminethecommunityparticipationinhouseholdsolidwaste(HSW) reductionandtheinfluencingfactorsineasternSurabaya.Theresearchwasconductedinthreedistricts, namelySukolilo,Rungkut,andTenggilisMejoyo.TheHSWsamplingforSWcompositionanalysiswas performedovereightconsecutivedays.SurveyconcerningcommunityinvolvementinHSWreduction wasconductedin300householdsusingstratifiedrandomsamplingtechnique.Thequestionnaireswere distributedduringHSWsamplingforgenerationrateandcompositionmeasurements.
Results of this study showed that average HSW generation rate in eastern Surabaya was 0.33kg/capita/day.TheHSWcompositionwasdominatedbyfoodwaste(64.19%),followedbyplastics (10.79%),paper(9.24%)anduseddiapers(6.97%).Thesocio-economiccharacteristicshadlessinfluence thanthesupportingfactorsonsorting,recyclingandcompostingactivities.
ThisstudysuggestedfourstrategiestosupportthecommunityparticipationonHSWreductionin east-ernSurabaya.Thesestrategieswere:tointensifytheHSWreductiontrainingprograms;tointensifythe informationdisseminationthroughmassmediaandcampaign;toincreasethenumberofenvironmental cadres;andtooptimizetheexistenceofwastebankanditsfunction.
©2015ElsevierB.V.Allrightsreserved.
1. Introduction
Population, industrialization, urbanization, and economic growtharethefactorscausingtheincreaseinsolidwaste(SW) gen-erationindevelopingcountries(DhokhikahandTrihadiningrum, 2012).Householdsolidwaste(HSW)hasbecomeaseriousproblem inlargecitieswithhighpopulationdensity.Surabaya,oneofthe highlypopulatedmetropolitancitiesinIndonesia,facesthis prob-lem,whichisprimarilycausedbythelackoflandtoserveasthe finaldisposalsite,lackoffunds,andfacilities.Thispopulation gen-erates3982.25cubicmetersofSWeachday(SanitationWorking GroupSurabaya,2010).In2005,Surabayaorganizeditsfirstannual greenandcleancompetition,whichwasfollowedbymorethan500 neighborhoodassociations(RukunTetangga).Thisprogramaimsto promotetheimportanceofSWreductionatthesource.SW reduc-tionwasinitiatedbytheclosingofthefinaldisposalsite(FDS)in Keputihattheendof2001.InthisyeartheCleansingAgencyof
∗Correspondingauthor.
E-mailaddress:[email protected](Y.Dhokhikah).
SurabayaCityandUnileverIndonesiaCorporationsupportedthe initialSWreductionprogram(Trihadiningrum,2006).
Indonesiahassomelegalinstrumentsthatsupportthe reduc-tionofHSWatsource.Regulationonwastemanagementisstated inActNo.18of2008Article29.Itmentionsaboutthebanofwaste managementwhichcausesenvironmentalpolluting,illegal dump-ingandopenburning.Inaddition,GovernmentRegulationNo.81 of2012,confirmedtheimportanceofreduction,reuse,and recy-cle(3R)ofHSW.Additionally,thereisalsoaministerialregulation on3Rthroughawastebank,namelytheRegulationofthe Min-isterofEnvironmentoftheRepublicofIndonesiaNo.13of2012. Theoretically,thepresenceofseverallegalinstrumentsgoverning 3RmakestheproblemofSWmanagementeasiertosolve,butin realitytherearesomeconstraintsinimplementationof3R.The implementationof3Rneedsthecommunityparticipation,the col-laborationbetweengovernment,community,privatesector,and non-governmentorganizations(NGOs),andamongthemembers ofthecommunity.
Communityparticipationisa keyfactorattainingthegoalof solidwastemanagement(SWM)(ChungandPoon,2001;Sukhor et al., 2011). In developing countries, community participation playsanimportantroleinachievingSWmanagement(Dhokhikah
154 Y.Dhokhikahetal./Resources,ConservationandRecycling102(2015)153–162
andTrihadiningrum,2012;Mongkolnchaiarunya,2005;Zurbrugg etal.,2004).In developing countrieswithlargepopulation,the humanresourceisthepotentialresourcefordevelopment.Human resourcesplaythekeyroleinSWmanagementindeveloping coun-tries.
Environmentalknowledgeisstronglycorrelatedwith environ-mentalactivity(Yenckenetal.,2000).Additionally,environmental knowledgeisconnectedtoimprovingthecitizens’attitudetoward the environment (Barraza and Walford, 2002). Environmental educationcansupportenvironmentalactionsandgenerate aware-ness,concern,andrecognitionoftheeffectofcitizens’activities (SalequzzamanandStocker,2001).Ontheotherhand,regulatory knowledgedoesnotautomaticallyimplythatcitizenswilladopt theseactions. Althoughmany citizensstate that theyare will-ingtorecyclewaste,inrealitytheydonotautomaticallyrecycle becauseof severalsituationalreasons(Corralizaand Berenguer, 2000;BorsgstedeandBiel,2002)
Environmentalcadreisdefinedasapersonfromalocal asso-ciationoroutsideoftheneighborhoodassociationsthatprovides thepublicwithenvironmentalcounselingandguidance,suchas howtosegregatetheHSWandhowtocompostthedecomposable waste.Environmentalcadreistypicallyfoundineach neighbor-hoodassociations,andinthevillageordistrict.Theexistenceof environmentalcadrecansupportthedisseminationofinformation aboutenvironmentalissues,andcanimproveattitude, behavior andactionstowardtheenvironment.Inordertoimprovethe com-munity’slevelofknowledge,theenvironmentalcadrehastospread outtocommunitytomotivate,guide,counselaboutsorting, recy-clingandcompostingHSWatsource.
Wastebankis abank thatis establishedbythecommunity. Wastebankreceivesrecyclablewastefromcommunity(asthe cus-tomer/clientofthewastebank).Thewastebankacceptsrecyclable waste,suchasplasticbottles,plastic glasses,newspaper, maga-zines,books,plasticbags,corrugatedpaper,officepaper,electrical wires,aluminumcans,ferrouscans,andwornshoes,amongothers, fromclients.DifferenttypesofSWmaterialshavedifferentprices perkilogram.EachtypeofSWisweighedandthenitsweightis recorded.Eachclientobtainsadepositbook,whichcontainsthe typeofwaste,weight,priceperkilogramandtotalamount. Cur-rently,therearemorethan20wastebanksinSurabaya(Ministry ofEnvironmental,2012).TheycanminimizethevolumeofHSW fromsources beforetransporting tothetemporarydisposalsite (TDS).
Theprimarygoalofthisstudyistodeterminecommunity partic-ipationinHSWmanagementinSurabaya,Indonesia.Theworking objectivesofthisresearchareasfollows:(a)todeterminethe gen-erationrateandcharacteristicsofHSWineasternSurabaya, (b) toidentifythesocio-economiccharacteristicsoftherespondents ineastern Surabaya, (c) todeterminetheinfluence of support-ingfactorsoncommunityparticipationinsorting,recyclingand compostingactivities,and(d)toanalysetheinfluenceof socio-economiccharacteristicsandsupportingfactorsonHSWreduction (sorting,recyclingandcomposting).
2. Materialsandmethods
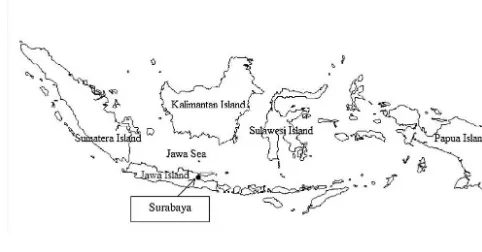
SurabayaisthecapitalcityofEastJavaProvinceandrecordeda populationofmorethanthreemillionpeoplein2013.Thecityhas fiveregions(centre,north,east,southandwest);encompassing31 districts(kecamatan)and160villages(kelurahan)(StatisticCenter Board,2012).Thisstudywasconductedintheeasternregionof Surabaya,EastJavaProvince,Indonesia.EasternSurabayacovers anareaof91.18km2.Thepopulationwas746,532in2011andthe
populationdensitywas72,297peoplepersquarekilometre. East-ernSurabayaconsistsofsevendistricts,42villages,390community
Fig.1. ThemapofIndonesia.
associations(RukunWarga)and2538neighborhoodassociations (StatisticCenterBoard,2012).
From2006to2013SurabayareceivedAdipura,anationalaward forcleancities.Surabaya wasalsoawardedtheASEAN Environ-mentallySustainableCityAwardin2011,andtheEnvironmentally SustainableCity(ESC)Awardin2012.Theseawardswerepresented tothecitywiththebestimplementationofsustainable environ-mental regulations. In addition,Surabaya receivedthe City-net awardinthecategoryofthebestparticipatorycityin the Asia-Pacificregionin2012(SurabayaCityGovernment,2014).
2.1. Descriptionofthethreedistricts
Eastern Surabaya was chosen as the study area because it has economic and population growth rates higher than other regions.Thenumber ofpublicand privateuniversities,colleges andacademies, industrialand commercialareas increaseinthe lastdecade,followingtherapidgrowthofpublichousingtowards theeastcoast.EasternSurabaya consistsofseven districts.The selecteddistrictswerebasedonthepopulationdensity,whichthe densitywasbasedonINS(IndonesiaNationalStandards) 19-2454-2002(INS,2002).ThefirstdistrictwasSukolilo,whichcoveredan areaof23.68km2andwasdividedintosevenvillages,67
commu-nityassociationsand361neighborhoodassociations.Thenumber ofresidentsin thisdistrictwas100,148withapopulation den-sityof4230people/km2.TheseconddistrictwasRungkutwithan
areaof 21.08km2,consistingofsixvillageswith73community
associationsand394neighborhoodassociations.Thisdistrictwas occupiedby111,286inhabitants,withapopulationdensityof5280 people/km2.ThethirddistrictwasTenggilisMejoyo,whichcovered
5.52km2,andhad25communityassociationsand156
neighbor-hoodassociations.Thisdistrictwaspopulatedby76,154residents, withapopulationdensityof13,796people/km2 (StatisticCenter
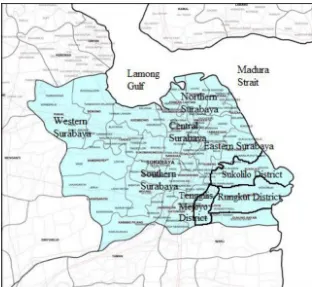
Board,2012).Fig.1showsthemapofIndonesia,andFig.2shows themapofSurabayaandthestudyarea.
2.2. Samplingmethod
The survey sample size was based on statistical principles. Householdsweresampledaccordingtothestratifiedrandom sam-plingmethod.Theselecteddistrictswerechosenbythepopulation density,whichSukolilowastheleastdense(43peopleperhectare), Rungkutwasoflow density(53peopleperhectare),and Teng-gilis Mejoyo wasof medium density (138 people per hectare). Theselectedhouseholds hadvarious socio-economiclevelsand othercharacteristicsincludinggender,age,educationbackground, andfamilyincome.Therewerethreesocio-economiclevels(high, middleandlow)whichwerebasedonthetypeofdwelling. Deter-miningthetype ofsettlementwasbasedonINS19-3242-2008, withtheprovisionsofaluxury,medium,andsimpleresidential house,withsizetypesover70m2,between45and54m2and21m2
Fig.2.ThemapofSurabayaandthestudyarea(Sukolilo,RungkutandTenggilisMejoyoDistrict).
ThesamplingHSWwasconductedinJune2013.Thequantityof sampleswasmeasuredbasedonStandardTestMethodfor Deter-minationoftheCompositionofUnprocessedMunicipalSolidWaste ASTMD5231-92-1994(Standard TestMethod,1994),withthe minimumweightof100kgeachsample.WeassumedthattheHSW generationratewas0.3kg/capitaeachdayandthehousehold mem-berswere4people.TheHSWgenerationforasemi-permanent dwellingrangedfrom0.3to0.35;andforapermanentdwelling rangedfrom0.35to0.4(PublicWorkDepartment,1993).One hun-dredhouseholderswereselectedforHSWsamplingandsurveyfor eachdistrict.Samplingwascarriedoutineightconsecutivedays. TherespondentswereaskedtocollecttheirdailyHSWintowaste bagswhichweredistributedonedaypriortocollection.The col-lectedHSWwasusedtodeterminethegenerationrateandthe composition.
ThecollectedHSWwastransportedtotemporarydisposalsite (TDS)formeasuringtheweightofHSW,todeterminetheHSW density,andtoclassifythecompositionofHSW.TheHSWsample wasweighedusingabalanceof50kgcapacity.
2.3. Surveyoncommunityparticipation
Wecommunicatedwithselectedrespondentstogaintheir con-sentto contributetothesurvey.Each selectedrespondentwas givenaninvitationlettertobecomerespondentanda question-naire.Each respondentwasvisited forquestionnaire checkand collection.Thenumberofrespondentsforsurveywascalculated usingSlovin’sFormula.Thenumberofrespondentsineachdistrict was100.TheSlovin’sFormulawasasfollows(Setiawan,2007):
n= N
N×d2+1 (1)
wheren=numberofsample;N=totalpopulation;d=error mar-gin=0.10. For further calculationof sample size was shown in Table1.
Table1
SamplesizeineachdistrictbasedonSlovin’sFormula.
Nameofdistrict Population Numberof household
Samplesize (households)
Sukolilo 100,148 25,037 100
Rungkut 111,286 27,822 100
TenggilisMejoyo 76,154 19,039 100
Interviews were conducted after collecting the answered questionnaires from the respondents. The questionnaires were reviewedtogaindataonawidevarietyofissuesrelatedto com-munityparticipationinSWreduction.
3. Dataanalysis
Aregression methodwasappliedtoexplain therelationship betweenaresponsevariableandoneormorepredictorvariables. TherespondentsselectedwereaskedtheiractivitytosorttheHSW, tocreate unique handcraftedgoods,and tocompost HSW.The activitiesofrespondentsinsortingHSW;creatingunique hand-craftedgoods,andcompostingweregiventhevalueof“1”,while theiractivitiesinnotsortingHSW,creatinghandcraftedgoods,and compostingweregiventhevalueof“0”.Furthermore,datafrom thequestionnaireswerecompiledandprocessedbybinarylogistic regression.
Datawereprocessedbydeterminingpredictorvariablessuch associo-economicfactors;andsupportingfactors.Thepredictor variableswerethefollowing:
(1)Thesocio-economiccharacteristicsincluded
respon-156 Y.Dhokhikahetal./Resources,ConservationandRecycling102(2015)153–162
dent’s agewas between36 and 50 years old;X2=3, ifthe respondent’sagewasbetween51and65yearsold;andX2=4, iftherespondent’sagemorethan65yearsold.
(c)Educational background (X3) had six categorical variables, whereX3=1,iftherespondentnevergraduatedfrom elemen-taryschoolorwasuneducated;X3=2,iftherespondentonly graduatedfromelementary school;X3=3,iftherespondent graduatedfromjuniorhighschool;X3=4,iftherespondent graduatedfromsenior highschool; X3=5,iftherespondent graduatedfromacademyordiploma;X3=6,iftherespondent wasundergraduateorpostgraduate.
(d)Familyincome(X4)hadeightcategorical,whereX4=1,ifthe family incomewasless thanRp 500,000;X4=2, ifthe fam-ilyincomerangedfromRp500,000toRp1500,000;X4=3,if thefamily income rangedfromRp1500,000 toRp2500,000; X4=4, if the family income ranged from Rp2500,000 to Rp3500,000; X4=5, if the family income ranged from Rp3500,000toRp5000,000;X4=6,ifthefamilyincomeranged fromRp5000,000toRp7500,000;X4=7,ifthefamilyincome rangedfromRp7500,000toRp10,000,000;X4=8,ifthefamily incomemorethanRp10,000,000.
(2)Thesupportingfactorsincluded
(a)Theleveloftherespondents’knowledgeconsistingof mecha-nismsofSWsorting,recycle,compostdegradableHSW,treat HSW into biogas, and animal feed, definitions of compost andbiogas,andtheprocessofrecyclingandcomposting.The responseswerecomposedof threechoices onscaleranging from“lowlevelofknowledge”,“sufficientknowledge”to“high level of knowledge”. The level of knowledge was the fifth predictor variable (X5).Therespondents’ knowledge hasan influenceonHSWsorting,recyclingandcompostingbehaviour (Ramayahetal.,2012;TroschinetzandMihelcic,2009). (b)Informationfrommassmedia(electronicorprintmedia)about
classifying,segregatingandhandlingSW(including decompos-ableandrecyclablewastes).Theinformationfrommassmedia wasthesixthpredictorvariable(X6).X6 hadtwocategorical
variables,whereX6=1,iftherespondentnevergot
informa-tionfrommassmediaabout3R;andX6=2,iftherespondent
evergottheinformationfrommassmediaabout3R.
(c)HSWreduction trainingincludedactivityof educationaland trainingsofSWsorting,recycling,andcompostingconducted bylocalgovernment;privatesectororNGOs.HSWreduction trainingwastheseventhpredictorvariable(X7),whichhadtwo
categoricalvariables.IftherespondentnevergotHSW reduc-tiontraining,thevalueofX8was1.Iftherespondentevergot
atleastonceHSWreductiontraining,thevalueofX8was2.
(d)Environmentalcadre—thepresentofcadresinthecommunity providingmotivationandcounsellinginHSWreduction.The environmentalcadrewastheeighthpredictorvariable(X8)and
hadtwocategoricalvariables.Iftherewasnoenvironmental cadreintherespondent’sarea,thevalueofX8was1.Ifthere
wasatleastoneenvironmentalcadreintherespondent’sarea, thevalueofX8was2.
(e)Theavailabilityofwastebanktoacceptrecyclablewastefrom thecustomer,andresellthewastetoanagent.Theexistence ofwastebankwastheninthpredictorvariable(X9)andhad
two categoricalvariables.Ifthere wasnowastebankinthe respondent’sarea,thevalueofX8was1.Iftherewasawaste
bankintherespondent’sarea,thevalueofX8was2.
Additionally,theresponsevariableswerethefollowing:
Table2
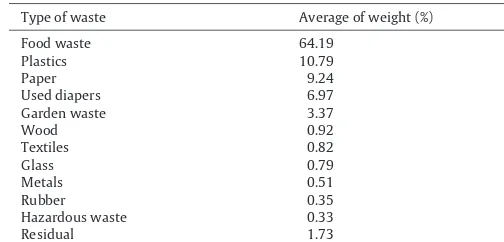
HSWcompositionsineasternSurabaya.
Typeofwaste Averageofweight(%)
Foodwaste 64.19
(1)Sortingactivity(Y1)—activityofrespondentstoclassifytheSW intodecomposableorrecyclablewaste.
(2)Recyclingactivity(Y2)—activityofrespondentstocreateunique handcraftedgoodsfromrecyclablewaste,suchaspencilcases, bags,wallets,purses,andflowers.
(3)Composting activity (Y3)—activity of respondent to convert decomposablewasteintocompost.
Logisticregressionwasappliedtoprocesspublicopinionabout thepublicacceptanceinarecyclingscheme(Keramitsoglouand Tsagarakis,2013),sourceseparation(Zhangetal.,2012).SPSS17.0 softwarewasusedfortheseregressions.The logisticregression modelwasasfollows(HosmerandLemeshow,2000):
g(x)=ˇ0+ˇ1X1+···+ˇpXp (2)
ˇ0=thevectorofparametertobeestimated;ˇp=thecoefficientof
predictorvariables;Xp=avectorofpredictorvariableobservations;
(x)=theconditionalmean.Theinterpretationofbinarylogistic regressionmodelwasusedOddRatio(OR).OR’sformulawasshown asfollows:
OddsRatio=expB (4)
4. Results
4.1. ThecompositionofHSWineasternSurabaya
TheaverageofHSWgenerationrateineasternSurabayawas 0.33kgeachdaypercapita.GenerationrateofHSWinSukolilo, Rungkut, and Tenggilis Mejoyodistrict were0.39kg/capita/day, 0.31kg/capita/day and 0.29kg/capita/day–respectively. Genera-tion rateof HSWin Sukolilo district wasthe highest,and was followedbyRungkut andTenggilisMejoyodistrict.The compo-sitionsoftheHSWineasternSurabayaweredominatedbyfood waste(64.18%),plastics(10.79%),paperwaste(9.24%)andused dia-pers(6.97%).ThecompositionofHSWineasternSurabayaisshown inTable2.
Fig.3.HSWcompositionineasternSurabaya,(a)foodwaste,(b)paperwaste,(c)useddiapers,(d)glass,and(e)woods.
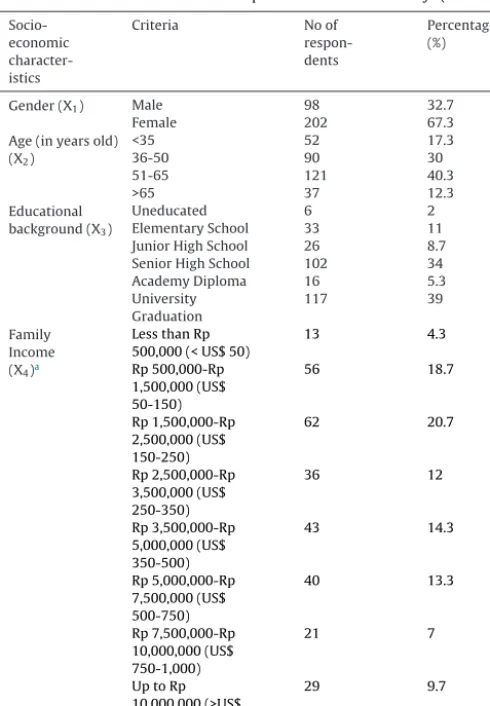
Table3
Socio-economiccharacteristicsoftherespondentsineasternSurabaya(n=300).
Socio-JuniorHighSchool 26 8.7
SeniorHighSchool 102 34
AcademyDiploma 16 5.3
wasteconsisted ofcoconut shelland bamboo packaging. Fig.3 showstheHSWcompositionineasternSurabaya.
4.2. Thesocio-economiccharacteristicsoftherespondentsin easternSurabaya
Thesocio-economiccharacteristicsofthehouseholdsareshown inTable3.Oftherespondents,63%werefemaleand37%weremale. Theagesoftherespondentsrangedfromlessthan35,36to50,51to 65andupto65,whichwere17.3%,30%,40.3%and12.3%of respon-dents,respectively.Theeducationalbackgroundofrespondentsin universitygraduation,senior highschoolandelementaryschool were39%,34% and11%, respectively.The familyincome ofthe respondentsrangedfromRp500,000toRp10,000,000.Thelargest percentageoftherespondents(20.7%)hadamonthlyincomeof
Table4
SupportingfactorsinHSWhandling(n=300).
Supportingfactors Noofrespondents Percentage(%)
LevelofknowledgeaboutHSWhandlingandreduction
a.Lowlevelofknowledge 55 18.3
b.Sufficientknowledge 154 51.3
c.Highlevelofknowledge 91 30.3
InformationobtainedfrommediamassaboutHSWhandling
a.Never 117 39
b.Ever,atleastobtainedoneinformation 183 61
Receivedtrainingandeducationalprogram
a.Never 150 50
b.Ever,atleastreceivedonetraining 150 50
ExistenceofEC
a.None 191 63.7
b.Oneormoreperson 109 36.3
ExistenceofWBintheirresidences
a.Notavailable 230 76.7
b.Available 70 23.3
betweenRp1,500,000andRp2,500,000,and18.7%ofrespondents earnedamonthlyincomeofbetweenRp500,000andRp1,500,000. Only4.3%hadanincomelessthanRp500,000,and9.7%hadincome higherthanRp10,000,000.
4.3. Supportingfactorstowardsthecommunityparticipationin sorting,recyclingandcompostingactivities
158 Y.Dhokhikahetal./Resources,ConservationandRecycling102(2015)153–162
Table5
Descriptionofsorting,recyclingandcompostingHSWactivities(n=300).
Respondent’sactivityinsorting,recyclingandcompostingHSW Noofrespondents Percentage(%)
ActivitiesofsortingtheHSW
a.Implemented 143 47.7
b.Notimplemented 157 52.3
ReasonforsortingtheHSW
a.Selfawareness 74 51.7
b.Commandfromleaderofneighborhoodassociation/communityassociation 35 24.5
c.ProfitfromsellingdryHSWuseforcommunityneeds 8 5.6
d.Increasethefamilyincome 13 9.1
e.Others 13 9.1
ReasonfornotsortingtheHSW
a.Laziness 51 32.5
b.Notime 60 38.2
c.Donotknowtheprocedure 29 18.5
d.Lackofspace 8 5.1
e.Others 9 5.7
WillingnesstosorttheHSW
a.Willingness 98 62.4
b.Nowillingness 59 37.6
RecyclingtheHSWtocreateuniquehandcraftedgoods
a.Implemented 15 5
b.Notimplemented 285 95
ReasonofrecyclingtheHSWtouniquehandicraft
a.Selfawareness 8 53.3
b.Commandfromleaderofneighborhoodassociation/communityassociation 5 33.3
c.Followfriend 1 6.7
d.Others 1 6.7
ReasonfornotrecyclingtheHSWintouniquehandcraftedgoods
a.Laziness 135 47.4
b.Notime 37 13
c.Donotknowtheprocedure 91 31.9
d.Others 22 7.7
WillingnesstorecycletheHSWintouniquehandcraftedgoods
a.Willingness 121 42.5
b.Nowillingness 164 57.5
ActivitiesofcompostingtheHSW
a.Implemented 27 9
b.Notimplemented 273 91
ReasonforcompostingtheHSW
a.Selfawareness 9 33.4
b.Commandfromleaderofneighborhoodassociation/communityassociation 12 44.4
c.Followfriend 1 3.7
d.Others 5 18.5
ReasonfornotcompostingtheHSW
a.Laziness 26 9.5
b.Notime 126 46.2
c.Donotknowtheprocedure 92 33.7
d.Nospace 12 4.4
e.Others 17 6.2
WillingnesstocomposttheHSW
a.Willingness 138 46
b.Nowillingness 162 54
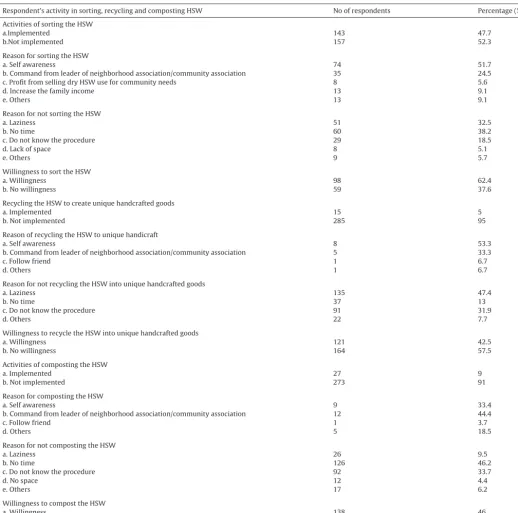
The respondent’s activity in sorting, creating unique hand-craftedgoodfromrecyclablewasteandcompostingHSWisshown inTable5.Thesortingactivitywasperformedby47.7%of respon-dents,butwasnotperformedby52.3%ofrespondents.Theprimary reason for sorting was “self-awareness” (51.7%), and the least popularreason given was“profit for communityneeds” (5.6%). Ontheother hand,themajorreasonsfor notsorting were“no time”(38.2%)and“laziness”(32.5%).Thepercentageofrespondents willing to segregate HSW was as high as 62.4%. This percent-agewashigher thanthat of respondentnot willingtosort the HSW.
Theactivityofcreatingofuniquehandcraftedgoodswasonly accomplishedby5%oftherespondentsineasternSurabaya.The
Table6
Resultsfromthebinarylogisticregressiononsortingactivity(n=300).
B S.E. Wald df Sig. Exp(B)
Step 6a
Age 22.457 3 0.000
Age(1) 2.035 0.447 20.689 1 0.000 7.653
Age(2) 0.968 0.420 5.319 1 0.021 2.633
Age(3) 1.113 0.519 4.604 1 0.032 3.042
Levelofknowledge 23.078 2 0.000
Levelofknowledge(1) 0.768 0.392 3.831 1 0.050 2.155
Levelofknowledge(2) 1.943 0.434 20.002 1 0.000 6.981
Environmentalcadre(1) 0.588 0.317 3.442 1 0.064 1.800
Wastebank(1) 1.518 0.404 14.093 1 0.000 4.564
Constant −2.766 0.509 29.473 1 0.000 0.063
aVariable(s)enteredonstep1:gender,age,educationalbackground,familyincome,levelofknowledge,HSWreductiontraining,informationfrommassmedia, environmentalcadre,andwastebank.
Table7
Resultsfromthebinarylogisticregressiononcreatinguniquehandcraftedgoodsfromrecyclablewasteactivity(n=300).
B S.E. Wald df Sig. Exp(B)
Step 8a
Environmentalcadre(1) 2.074 1.127 3.386 1 0.066 7.959
Wastebank(1) 2.153 0.842 6.542 1 0.011 8.612
Constant -5.682 1.060 28.748 1 0.000 0.003
aVariable(s)enteredonstep1:gender,age,educationalbackground,familyincome,levelofknowledge,wastebank,HSWreductiontraining,informationfrommass media,andenvironmentalcadre.
4.4. Theinfluenceofsocio-economiccharacteristicsand supportingfactorsforHSWreduction
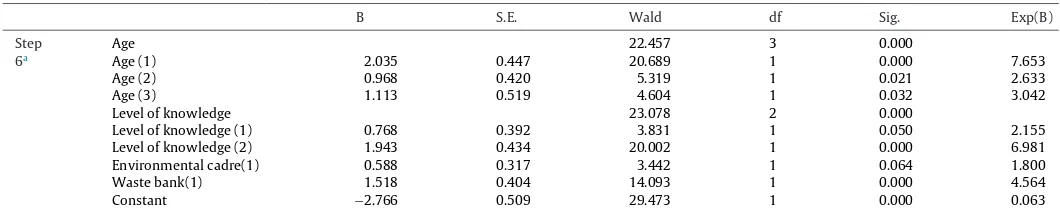
Theresultsofthebinarylogisticregressiononthecommunity sortingactivityareshowninTable6.Basedontheresult,the influ-encingfactorsfortheHSWsortingactivitywereageofrespondent, thelevelofknowledge,thepresenceofanenvironmentalcadre, andthewastebankavailabilitybecausethesignificantvalueswere 0.000;0.000;0.064;and 0.000,respectively.Thesignificant val-ueswerelessthan0.1(10%),indicatingthatthevariableshighly influencethesortingactivity.
BasedonEq.(2),thelogisticregressionmodelonsortingactivity wasasfollows:
g(x)=−2.766+2.035age (1)+0.968age (2)+1.113age (3)
+0.768level ofknowledge (1)+1.943level ofknowledge (2)
+0.588 environmental cadre (1)+1.518waste bank (1)
TheprobabilityofsortingHSWbyrespondentwiththeageof 36–50yearsoldwaseighttimesmorethanitwiththeageofless than35yearsold.TheprobabilityofsortingHSWbyrespondent withtheageof51–65yearsoldwasthreetimesmorethanitwith theageoflessthan35yearsold.TheprobabilityofsortingHSWby respondentwiththeageofmorethan65yearsoldwasthreetimes morethanitwiththeageoflessthan35yearsold.
Theprobability of sorting HSWby respondent withlevel of knowledge“sufficientknowledge”wastwotimesmorethanitwith thelevelofknowledge“lowlevelofknowledge”.Additionally,the probabilityof arespondent withtheknowledgelevel indicated as“highlevelofknowledge”wasseventimesmorelikelytosort HSWthanarespondentwiththeknowledgelevelof“lowlevelof knowledge”.
Whiletheprobabilityofsortingwastwotimeshigherwhenan environmentalcadrewasavailablethanwhentherewasno envi-ronmentalcadre.Inaddition,theprobabilityofsorting wasfive timeshigherwhen,awastebankwasavailablethanwhenthere wasnowastebank.
Thefittedmodelofsortingactivitywasusedtoestimatethe probabilityonsortingactivity.Forexample,respondentof40years old(=1)withhighlevelofknowledge(=1),therewerean
envi-ronmentalcadre(=1) andawastebankinhisarea(=1).So, the probabilityofsortingactivitywasasfollows:
g(x)=−2.766+2.035 (1)+0.968 (0)+1.113 (0)+0.768 (0)
+1.943 (1)+0.588 (1)+1.518 (1)
g(x)=3.318
(x)= e
[3.318]
1+e[3.318]
=0.965≈0.97=97%
Ontheotherhand,iftherewerenoanenvironmentalcadre(=0) andawastebank(=0),theprobabilityofsortingwasasfollows:
g(x)=−2.766+2.035 (1)+0.968 (0)+1.113 (0)+0.768 (0)
+1.943 (1)+0.588 (0)+1.518 (0)
g(x)=1.212
(x)= e
[1.212]
1+e[1.212]
=0.77=77%
Theestimatedlogisticprobabilityonrespondent’ssorting activ-itywas97%,ifhewas40yearsoldwithhighlevelofknowledge,and therewereanenvironmentalcadreandawastebankinhisarea. Whentherewerenotanenvironmentalcadreandawastebank, theestimatedlogisticprobabilityonrespondent’ssortingactivity was77%.
160 Y.Dhokhikahetal./Resources,ConservationandRecycling102(2015)153–162
Table8
Resultsfromthebinarylogisticregressiononcompostingactivity(n=300).
B S.E. Wald df Sig. Exp(B)
Step 6a
Gender(1) 1.079 0.534 4.081 1 0.043 2.941
HSWreductiontraining(1) 1.097 0.609 3.249 1 0.071 2.996
Informationfrommassmedia(1) 1.690 0.764 4.888 1 0.027 5.419
Environmentalcadre(1) 1.191 0.504 5.584 1 0.018 3.292
Constant -5.872 0.980 35.924 1 0.000 0.003
aVariable(s)enteredonstep1:gender,age,educationalbackground,familyincome,levelofknowledge,wastebank,HSWreductiontraining,informationfrommass media,andenvironmentalcadre.
goodsfromrecyclablewaste,suchasthepresenceofenvironmental cadreandwastebank.
BasedonEq.(2),thelogisticregressionmodelonrecycling activ-itywasasfollows:
g(x)=−5.682+2.074 environmental cadre (1)
+2.153 waste bank (1)
Theprobabilityofcreatinguniquehandcraftedgoodsfrom recy-clablewastebyrespondentswiththepresenceofanenvironmental cadrewaseighttimeshigherthanwithoutanenvironmentalcadre. Inaddition,theprobabilityofcreatinguniquehandcraftedgoods fromrecyclablewastebyrespondentshavinganavailablewaste bankwasninetimeshigherthanwithoutanavailablewastebank. Thefittedmodelofrecyclingactivitywasusedtoestimatethe probabilityonrecyclingactivity.Forexample,iftherewerean envi-ronmentalcadre(=1)andawastebankinrespondent’sarea(=1). So,theprobabilityofcreatinguniquehandcraftedgoodsactivity wasasfollows:
g(x)=−5.682+2.074 (1)+2.153 (1)=−1.455
(x)= e
[−1.455]
1+e[−1.455] =0.189≈0.19=19%
Ontheotherhand,ifthere werenoanenvironmentalcadre (=0)andawastebank(=0)inrespondent’sarea,theprobabilityof creatinguniquehandcraftedgoodswasasfollows:
g(x)=−5.682+2.074 (0)+2.153 (0)=−5.682
(x)= e
[−5.682]
1+e[−5.682] =0.003=0.3%
Theestimationofprobabilityonrespondent’screatingunique handcraftedgoodsactivitywas19%,iftherewereanenvironmental cadreandawastebankinrespondent’sarea.Oncontrary,ifthere werenotanenvironmentalcadreandawastebank,theestimation ofprobabilityonrespondent’screatinguniquehandcraftedgoods activitywas0.3%.
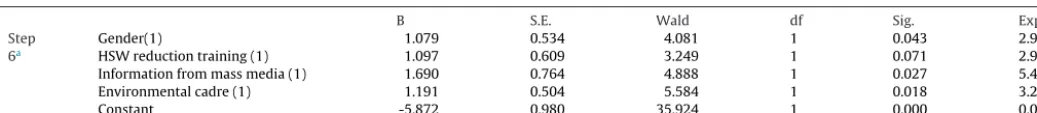
Theresultsfromthebinarylogisticregressiononcomposting areshowninTable8.Theinfluencingfactorsonthecomposting activityweregender,HSWreduction training,informationfrom massmedia,andtheexistenceofenvironmentalcadre,becausethe significantvalueswere0.043;0.071;0.027;and0.018,respectively. Thevaluesofsignificantwerelessthan0.1(10%),indicatingthatthe variablesexertedsubstantialcontroloverthecompostingactivity. BasedonEq.(2),thelogisticregressionmodeloncomposting activitywasasfollows:
g(x)=−5.872+1.079 gender (1)
+1.097environmental training (1)
+1.680information from mass media (1)
+1.191environmentalcadre (1)
Theprobabilityforafemalerespondenttocompostwasthree timeshigher thanthat fora malerespondent. Additionally,the probability of composting for respondent who received HSW reduction training was three times more than that respondent who never received HSW reduction training. Additionally, the probabilityofcompostingforrespondentwhoreceived informa-tionfrommassmediaabout3Rwasfivetimeshigherthanthat respondentwhoneverreceivedinformationfrommassmedia.In addition,theprobabilityofcompostingbyrespondentwith avail-ableenvironmentalcadrewasthreetimeshigherthanthatwithout environmentalcadre.
Thefittedmodelofcompostingactivitywasusedtoestimatethe probabilityoncompostingactivity.Forexample,iftherespondent isfemale(=1),andhasreceivedHSWreductiontraining(=1),and informationfrommassmedia(=1),withthepresenceofan envi-ronmentalcadre(=1),thentheprobabilityofcompostingactivity wasasfollows:
g(x) =−5.872+1.079 (1)+1.097 (1)+1.690 (1)+1.191 (1)
=−0.815
(x)= e
[−0·815]
1+e[−0·815]=0·307≈0·31=31%
Ontheotherhand,iffemalerespondent(=1)never received HSWreduction training(=0) andinformation frommass media about3R(=0),andtherewasnotanenvironmentalcadreinher area(=0),theprobabilityofcompostingwasasfollows:
g(x)=−5.872+1.079 (1)+1.097 (0)+1690 (0)+1.191 (0)
=−4.775
(x)= e
[−4.775]
1+e[−4.775]=0.008=0.8%≈1%
Theestimationofprobabilityonrespondent’scomposting activ-itywas31%,iffemalerespondenteverreceivedatleastonceHSW reductiontrainingandtherewereanenvironmentalcadreanda wastebankin hisarea.Whentherewerenotanenvironmental cadreandawastebank,theestimationofprobabilityon respon-dent’scompostingactivitywas1%.
5. Discussion
recyclablematerialssuchaspaper(rangedfrom3.6%to30%),and plastics(rangedfrom2.9%to19.9%).Thecompositionofrecyclable materialstendedtomultiplyastheresultofthechanginglifestyle andtheconsumptionofmorepackagedproducts(Dhokhikahand Trihadiningrum,2012).
BasedonTable5,thereasonsofrespondentnotsortingHSW wereprimarycausedbylackoftime,laziness,andnotknowingthe procedureofsortingHSW.Therespondents’reasonsweresimilarto previousstudieswhichstatedthatthebarrierstosortwere“lack oftime”(Grodzin´ıska-Jurczaketal.,2003),lackofspacetosave recyclablesathomeandscarcityoflocalfacilities(Alexanderetal., 2009;Hageetal.,2009;Martinetal.,2006;PerryandWilliams, 2007;TimlettandWilliams,2008),aswellaslackofacollection service(Grodzin´ıska-Jurczaketal.,2003).
ThereasonsofrespondentnottorecycleHSWinTable5were laziness,notknowingtheprocedureofrecycle,andlackoftime. Theyweresimilartothepreviousstudieswhichstatedthatthe bar-riersofrecyclingwerelimitedoftimetodo(Alexanderetal.,2009; Grodzin´ıska-Jurczaketal.,2003;Martinetal.,2006),lackof incen-tivetorecycle(RobinsonandRead,2005;TimlettandWilliams, 2008),publicattitudestowardrecyclingactivitiesandtheir per-ceptionsof theconstraintsinrecycling (Alexander etal.,2009), assumptionof“producelittlewaste”(Grodzin´ıska-Jurczaketal., 2003),apathytowardsrecycling(RobinsonandRead,2005),lack ofpublicawarenessandparticipation(Grodzin´ıska-Jurczaketal., 2003;RobinsonandRead,2005;Shawetal.,2007;Singhirunnusorn etal.,2012),lackofenthusiasmandstimulus(Shawetal.,2007).
BasedonTable5,thereasonsofrespondentnottocompostwere lackoftime,notknowingtheprocedureofcomposting,and lazi-ness.Theyweresimilartopreviousstudieswhichmentionedthat theconstraintsofcompostingarelackofinterestandlackof aware-nessinsellingandpromotion(Hoornwegetal.,1999;Zurbrugg, 2002).On theotherhand,composting wasthebestanswerfor SWM,becauseitreducedtheSWvolume,suppliedplantnutrients, andincreasedthesoilquality(Körneretal.,2008;Mbuligweetal., 2002).Inaddition,decentralizedcompostingneedslowtechnology andbudget(Körneretal.,2008).Becauseofitsbenefits,composting issupportedbylocalgovernment,community,privatesectorand NGOs.
Table6indicatedthatenvironmentalknowledgehadastrong correlationwithenvironmentalbehavior(Ramayahetal.,2012; TroschinetzandMihelcic,2009; Yenckenetal.,2000)and with theimprovementoftheresidents’attitudetowardthe environ-ment(BarrazaandWalford,2002;Singhirunnusornetal.,2012), and knowledge transfer could improve the SW management (Valaencia-Vazquezetal.,2014).
BasedonTable6,thepredictorvariablesinfluencingthesorting activitywererespondent’sage,thelevelofknowledge, environ-mentalcadre,andwastebank.Sortingactivitywasinfluencedby levelofknowledge(Ramayahetal.,2012;TroschinetzandMihelcic, 2009).Additionally,Table7showsthatactivityofcreatingunique handcrafted goodswas influenced byenvironmental cadre and wastebank.
Theexistenceofawastebankencouragesthecommunity activi-tiesonHSWsortingandrecycling(seeTables6and7).Customersof thewastebanksellrecyclablewastethathasvalue,suchaspaper, plastic,metal,andglass.Thewastebankprovidesdepositbooks tothecustomers,containingthetype,amountandweightofthe recyclablewaste.Thewastebanksetsthepriceofeachtype of SWaccordingtotheagreementbetweenthebankandthe cus-tomer.Furthermore,theamountofmoneysavedisobtainedfrom thepriceofeachtypeofwasteorthenumberofunitsmultiplied bytheweightofthewaste.Theamountofmoneyisrecordedin thedepositbook.Thecustomersofwastebanktakeanadvantage ofsortingandrecyclingHSW,becausetheycangainmoneyfrom sellingrecyclablewaste.
TheexistenceofawastebankinIndonesiaissupportedbylegal instrument,namelytheRegulationoftheMinisterofEnvironment oftheRepublicofIndonesiaNo.13 of2012.Manywastebanks wereestablishedin2012aftertheregulationwasreleased.Awaste bankalsosupportedthecreationofuniquehandcraftedgoodsinthe community(TriwardaniandSarmini2013;Purbasari,2014),such asbysupportingatrainingprogram.Thekeyrolesinreductionand recyclingwerethepublicawareness(HottaandAoki-Suzuki,2014), andknowledgetransfer(Valaencia-Vazquezetal.,2014).Training programcantransferknowledgeandtechnology,andimprovethe community’slevelofknowledge,andincreasetheirawarenessin HSWreduction. Inaddition,level ofknowledge canchangethe awarenesstoaction.Furthermore,thefunctionofwastebankis notonlyasamediafor sellingtherecyclablewaste,butalsoas amediaororganizationfortransferringtheknowledgeand tech-nologyofHSWreductionandimprovingthecommunity’slevelof knowledge.
BasedonTable8,gender,HSWreductiontraining programs, informationfrommassmedia,andenvironmentalcadreinfluenced thecompostingactivity.Informationplaysakeyroleinchangingof theattitudetowardSWM.Informationabouttheenvironmentcan disseminatethroughmassmediaorelectronicmedia,andmany citizenscangaininformationfromeducationandtraining. Simi-lartopreviousstudiesthatenvironmentaleducationcansupport pro-environmentalactionsandgenerateawareness,concern,and recognitionoftheeffectofcitizens’activity(HottaandAoki-Suzuki, 2014; Ramayah et al., 2012; Salequzzaman and Stocker,2001; Sukhoretal.,2011).Itwasstatedthatthegenderrolewas dom-inantin3RimplementationinothercitiesinIndonesia,because mostofthecadreswerewomen(Utamietal.,2008;Wardi,2011). Similartootherdevelopingcountries,womenwerethekeyroles inHSWreductioninYala,Thailand(Mongkolnchaiarunya,2005).
Environmentalcadresinfluencethecommunity participation onHSWreduction.Environmentalcadrestransferknowledgeand technology,guideandmotivatethecommunity.Knowledge trans-fer about HSW reduction improves the community’s level of knowledge,increasesawareness,andchangestheawarenessinto actionpro-environmental.
Therearefourstrategiesthatcanbeproposedtosupportthe communityparticipationonHSWreductionineasternSurabaya. ThefirststrategyofreductionHSWatsourceistointensifythe HSWreductiontrainingforcommunityandenvironmentalcadres. TheHSWreduction training cantransferinformation aboutthe HSWhandling,and reduction, and itcan improvetheir knowl-edge.Theparticipantsoftraining involveallofthecommunity. Thegovernment,privatesector,NGOs, institution,and commu-nitycancontributeintrainingmaterials,funding,traineronHSW reductiontraining.Thesecondstrategyistointensifythe informa-tionabouttheHSWhandling,reductionandrecyclingthroughthe massmediaand campaign.Thethirdstrategyistomultiplythe numberofenvironmentalcadresasmotivatorsandguidestothe communityintheHSWreduction.Environmentalcadresarenot onlyfromresidentsoutsidetheregionbutalsofromlocalresidents andlocalcommunityleaders.Thefourthstrategyistomultiplythe existenceofwastebankanditsfunctions.Thewastebankfunctions areasabankacceptingrecyclablewastefromcommunityas cus-tomer,andasanorganizationimprovingthecommunitythrough environmentalcampaignandtrainings.
6. Conclusion
socio-162 Y.Dhokhikahetal./Resources,ConservationandRecycling102(2015)153–162
economiccharacteristicsofrespondentshadless influencethan supportingfactorsinsorting HSW,creatinguniquehandcrafted goodsfromrecyclablewaste,andcomposting.Inordertoimprove thecommunityactivityin3R,thecollaborationbetweenthe gov-ernment and community, private sector,and NGOs have tobe conducted.Fourstrategiestoachievethegoalofcommunity par-ticipationin HSWreduction aretointensifytheHSWreduction trainingforcommunityandenvironmentalcadres;toincreasethe informationthroughmassmediaand campaignabouttheHSW handlingandreduction;tomultiplythenumberofenvironmental cadresfromcommunityandthelocalleaders;andtoincreasethe numberofwastebankandtheirfunctions(asbankwhichacceptthe recyclablewaste;andanorganizationforenvironmentalcampaign andtrainings).
Acknowledgements
Theauthorsgratefully acknowledgetheHigherEducation of Ministryof EducationandCulture ofIndonesiaforthefinancial researchfund,contractno.(013674.33/IT2.7/PN.08.01/2013).The authorsarealsogratefultoYoanitaPuspitaRatih,HendriSutrisno, andIntanJuliaLaksonofortheassistancesindatacollection.Our gratitudeisalsodeliveredtoDr.VitaRatnasariforheradvicein finalizingthismanuscript.
References
Alexander,C.,Smaje,C.,Timlett,R.,Williams,I.D.,2009.Improvingsocial technologiesforrecycling.Proc.Inst.CivilEng.WasteResour.Manage.162, 15–28.
Barraza,L.,Walford,R.A.,2002.Environmentaleducation:acomparisonbetween EnglishandMexicanschoolchildren.Environ.Educ.Res.8,171–186. Borsgstede,C.,Biel,A.,2002.Pro-environmentalactivity:situationalbarriers,and
concernforthegoodatstake.G ¨oteborgPsychol.Rep.32(1),1–10. Chung,S.S.,Poon,C.S.,2001.Acomparisonofwaste-reductionpracticesandnew
environmentalparadigmofruralandurbanChinesecitizens.J.Environ. Manage.62,3–19.
Corraliza,J.,Berenguer,J.,2000.Environmentalvalues,beliefsandactions.A situationalapproach.Environ.Behav.32(6),832–848.
Dhokhikah,Y.,Trihadiningrum,Y.,2012.SolidwastemanagementinAsian developingcountries:challengesandopportunities.J.Appl.Environ.Biol.Sci.2 (7),329–335.
Grodzin´ıska-Jurczak,M.,Tarabul,M.,Read,A.R.,2003.Increasingparticipationin rationalmunicipalwastemanagement–acasestudyanalysisinJasloCity (Poland).Resour.Conserv.Recycl.38,67–88.
Hage,O.,Söderholm,P.,Berglund,C.,2009.Normsandeconomicmotivationin householdrecycling:empiricalevidencefromSweden.Resour.Conserv. Recycl.53,155–165.
Hoornweg,D.,Thomas,L.,Otten,L.,1999.CompostinganditsApplicabilityin DevelopingCountries.UrbanWasteManagement.WorkingPaperSeries.The WorldBank,Washington,USA.
Hosmer,D.W.,Lemeshow,S.,2000.AppliedLogisticRegression,2nded.JohnWiley &Sons,Inc.,Toronto,Canada.
Hotta,Y.,Aoki-Suzuki,C.,2014.Wastereductionandrecyclinginitiativesin Japanesecities:lessonsfromYokohamaandKamakura.WasteManage.Res.32 (9),857–866.
INS(IndonesiaNationalStandard)19-2454-2002.2002.Theprocedureforthe operationaltechniquesofurbanwastemanagement.NationalStandardization Board.(inBahasaIndonesia).
INS(IndonesiaNationalStandard)3242-2008.2008.Wastemanagementinthe settlementinIndonesia.NationalStandardizationBoard.(inBahasaIndonesia). Keramitsoglou,K.M.,Tsagarakis,K.P.,2013.Publicparticipationindesigninga
recyclingschemetowardsmaximumpublicacceptance.Resour.Conserv. Recycl.70,55–67.
Körner,I.,Saborit-Sánchez,I.,Aguilera-Corales,Y.,2008.Proposalforthe integrationofdecentralisedcompostingoftheorganicfractionofmunicipal solidwasteintothesystemofCuba.WasteManage.28,64–72.
Martin,M.,Williams,I.D.,Clark,M.,2006.Social,culturalandstructuralinfluences onhouseholdwasterecycling:acasestudy.Resour.Conserv.Recycl.48, 357–395.
Mbuligwe,S.E.,Kassenga,G.R.,Kaseva,M.E.,Chaggu,E.J.,2002.Potentialand constraintsofcompostingdomesticsolidwasteindevelopingcountries: findingsfromapilotstudyinDaresSalaam,Tanzania.Resour.Conserv.Recycl. 36,45–59.
MinistryofEnvironmentalIndonesiasolidwastebankprofile.2012.National WorkshopofSolidWasteBank.Malang2–4November2012.(inBahasa Indonesia).
Mongkolnchaiarunya,J.,2005.Promotingacommunity-basedsolidwaste managementinitiativeinlocalgovernment:Yalamunicipality,Thailand. HabitatInt.29,27–40.
Perry,G.D.R.,Williams,I.D.,2007.Theparticipationofethnicminoritiesinkerbside recycling:acasestudy.Resour.Conserv.Recycl.49,308–323.
PublicWorkDepartmentWastegenerationstandardspecificationsforsmalland mediumcitiesinIndonesia.1993.LPMB.Bandung.(inBahasaIndonesia). Purbasari,N.,2014.Communityempowermentthroughrecyclingplasticwaste
(CasestudyonwastebankcommunityhousingpokliliinPerumahanGriya LembahDepok,SukmajayaSubdistricts,Depokcity).Thesis.SocialScience EducationDepartment.FacultyofTarbiyahandEducation.SyarifHidayatullah StateIslamicUniversity.Jakarta.(inBahasaIndonesia).
Ramayah,T.,Lee,J.W.C.,Lim,S.,2012.Sustainingtheenvironmentthrough recycling:anempiricalstudy.J.Environ.Manage.102,141–147.
Robinson,G.M.,Read,A.D.,2005.RecyclingbehaviourinaLondonBorough:results fromlarge-scalehouseholdsurveys.Resour.Conserv.Recycl.45,70–83. Salequzzaman,M.,Stocker,L.,2001.Thecontextandprospectsforenvironmental
educationandenvironmentalcareerinBangladesh.Int.J.Sustain.High.Educ.2 (2),104–126.
SanitationWorkingGroupSurabaya,2010.DraftofSanitationSurabayaWhite Book.SettlementSanitationDevelopmentAccelerationProgram(PPSP)(in BahasaIndonesia).
Setiawan,N.,2007.SamplesizedeterminationusingSlovin’sformulaand Krejcie–Morgan’stable:thestudyoftheconceptanditsapplication.Scientific discussionofSocio-EconomicDepartment,FacultyofAnimalHusbandry, UniversitasPadjadjaran(inBahasaIndonesia).
Shaw,P.J.,Lyas,J.K.,Maynard,S.J.,vanVugt,M.,2007.Ontherelationshipbetween set-outratesandparticipationratiosasatoolforenhancementofkerbside householdwasterecycling.J.EnvironManag.83,34–43.
Singhirunnusorn,W.,Donlakorn,K.,Kaewhanin,W.,2012.Contextualfactors influencinghouseholdrecyclingbehaviours:acaseofwastebankprojectin Mahasarakhammunicipality.Procedia–Soc.Behav.Sci.36,688–697. StandardTestMethodfordeterminationofthecompositionofunprocessed
municipalsolidwasteD5231-92.1994.AnnualBookofASTMStandards. Section11thWaterandEnvironmentalTechnologyVol.11.04.
Sukhor,F.S.A.,Mohammed,A.H.,Sani,S.I.A.,Awang,M.,2011.Areviewonthe successfactorsforcommunityparticipationinsolidwastemanagement. InternationalConferenceonManagement(ICM)Proceeding.
SurabayaCityGovernmentAwardsreceivedbytheCityofSurabaya.www. surabaya.go.id(accessed25.11.14.)(inBahasaIndonesia).
Timlett,R.E.,Williams,I.D.,2008.Publicparticipationandrecyclingperformancein England:acomparisonoftoolsforactivitychange.Resour.Conserv.Recycl.52, 622–634.
Trihadiningrum,Y.,2006.ReducingpotentialofdomesticsolidwasteinSurabaya City,Indonesia.In:Proceedingsofthe4thInternationalSymposiumon SustainableSanitation,Bandung,4–6September.
Triwardani,R.,Sarmini,2013.Acculturationofcharactercaringenvironment throughwastebanksinDuwetVillage,SubdistrictBendo,DistrictsMagetan. KajianMoralKewarganegaraan1(3),470–484(inBahasaIndonesia). Troschinetz,M.,Mihelcic,J.R.,2009.Sustainablerecyclingofmunicipalsolidwaste
indevelopingcountries.WasteManage.29,915–923.
Utami,B.D.,Indrasti,N.S.,Dharmawan,A.H.,2008.Householdwastemanagement ofcommunity-based:theexampleofthetwocommunitiesinSlemanand SouthJakarta.Sodality.J.TransdisiplinSosiol.Komun.Ekol.Manusia2(1), 49–68(inBahasaIndonesia).
Valaencia-Vazquez,R.,Perez-Lopez,M.E.,Vicencio-de-la-Rosa,M.G.,
Martinez-Prado,M.A.,Rubio-Hernandez,R.,2014.Knowledgeandtechnology transfertoimprovethemunicipalsolidwastemanagementsystemofDurango City,Mexico.WasteManage.Res.32(9),848–856.
Wardi,I.N.,2011.Wastemanagementbasedsocialculture:effortstoovercomethe environmentinBali.J.BumiLestari11(1),167–177(inBahasaIndonesia). Yencken,D.,Fien,J.,Sykes,H.(Eds.),2000.Routledge,London.
Zhang,W.,Che,Y.,Yang,K.,Ren,X.,Tai,J.,2012.Publicopinionaboutthesource separationofmunicipalsolidwasteinShanghai,China.WasteManage.Res.30 (12),1261–1271.
Zurbrugg,C.2002.Urbansolidwastemanagementinlow-incomecountriesof Asia:howtocopewiththegarbagecrisis.ScientificCommitteeonProblemsof theEnvironment(SCOPE).Durban,SouthAfrica,November.