R E G I O N A L C A S E S T U D Y
Community activities in residential solid waste reduction
in Tenggilis Mejoyo District, Surabaya City, Indonesia
Yulinah Trihadiningrum1 •Intan J. Laksono1•Yeny Dhokhikah1• Atiek Moesriati1•Deqi Rizkivia Radita1•Sony Sunaryo2
Received: 23 April 2015 / Accepted: 16 September 2015 ÓSpringer Japan 2015
Abstract The main source of municipal solid waste in Indonesia is residential area. The Indonesian Government Regulation No. 81/2012 concerning Residential Solid Waste (RSW) Management and Similar Types of Solid Waste stipulates that every generator is obliged to perform separation and treatment. This study was aimed to deter-mine RSW generation rate, reduction potential, and reduction activities by the community in Tenggilis Mejoyo District, Surabaya City. The RSW generation rate and composition were measured according to ASTM D5231-92 method. RSW reduction potential was determined based on weight percentage of recyclable RSW components. This study involved 100 householders, who were selected using stratified random approach based on the economical strata. This study resulted in RSW generation rate of 0.29 kg/ person day, or a total of 16.84 tons/day. The RSW com-position was dominated by biodegradable organics of 74.43 %, followed by plastic and paper waste materials. Estimated RSW reduction potential was 67.92 %. The RSW separation was only done by 37 % of respondents. Main reasons of the respondents for not implementing RSW separation were inavailability of time, laziness, and no use. Composting activity was conducted by 17 % respondents. This research further provides a
recommendation for improving community participation in RSW reduction.
Keywords Community activitiesReduction
Residential solid waste
Introduction
The rapid population and industrial growth in Surabaya City has caused the municipal solid waste (MSW) gener-ation to increase. Surabaya City generates 1689 tons MSW per day with the population of 3,104,584 [1,2]. JICA study in 2008 showed that the MSW collection rate in Java was only 59 % [3]. A study by Puspitarini et al. in 2013 showed that the MSW collection rate in East Surabaya achieved 82.5 % [4]. About 79.19 % of MSW in Surabaya City was generated from the residential area. The Living Environ-ment Board of Surabaya City estimated that the residential areas generated more than 1200 tons of solid waste (SW) per day [5]. However, this city should face limited resources for implementation of proper MSW manage-ment, such as inadequacies in service provision, financing, environmental controls, institutional structure, under-standing of complex systems, and sanitation [6]. Therefore, the reduction of solid waste at source was considered as the most appropriate strategy for managing the MSW [7]. In order to implement this strategy, community participation was generally recommended in solid waste management in developing countries [8].
The sustainability of solid waste management system can be achieved with the establishment of community awareness program for conducting solid waste reduction, separation, and recycling [9]. The economical status of people and community behavior may affect solid waste
& Yulinah Trihadiningrum
1 Department of Environmental Engineering, Institut
Teknologi Sepuluh Nopember, Jl. Arief Rahman Hakim, Surabaya 60111, Indonesia
2 Department of Statistics, Institut Teknologi Sepuluh
Nopember, Jl. Arief Rahman Hakim, Surabaya 60111, Indonesia
reduction activities at source [10]. Accordingly, the lack of knowledge and facilities could inhibit community partici-pation in conducting the solid waste reduce, reuse, and recycle (3R’s) program. Some people might state that they had limited time to involve in solid waste reduction and space for providing treatment facilities [11]. Intensive social approach could maintain community participation in implementing proper solid waste separation and reduction activities [7]. Additionally, the sustainability of 3R’s activities can be promoted if markets of solid waste treat-ment products are available [11].
Reformation on community behavior in MSW man-agement in Surabaya City was begun in 2001, when the only one open dumped disposal site at Keputih District was closed by the communities due to the offensive environ-mental impacts. Since then, the communities were inten-sively introduced with community awareness and solid waste treatment technology, and the provision of household and communal composting facilities by the municipality and the Non-Governmental Organizations (NGOs). The women association of the municipality routinely organized solid waste reduction awareness program for householders. Introduction of solid waste treatment options covered compost making and handcraft production from plastic waste materials [12].
Paper and metal waste components were generally stored by the householders, and sold to the recyclable waste collectors in Surabaya City [13]. The Living Environment Board of Surabaya City reported that the MSW reduction in 2012 was implemented with community involvement. The community activities are expected to include separa-tion, recycling, and marketing of the recyclables and composting of biodegradable solid waste. Reduction of the Residential Solid Waste (RSW) was also supported with the construction and operation of compost houses, which were built in several communities [5]. Eighteen compost houses could treat 42–147 m3 of residential yard waste every day [14].
Another RSW reduction facility that has been operated in Surabaya City is solid waste bank (SWB). The solid waste bank system is defined by the Department of Public Works as a collective and systematic management option of recyclable and decomposable solid waste materials from the generators [15]. This facility serves community saving activity, which uses recyclable solid waste as saving materials. The recyclable solid waste from each generator is weighed for further collectively and systematically managed. The economical value is calculated, saved, and reported to the solid waste generator. This mechanism can force the community to sort and to value the solid waste [16]. According to the Mayor of Surabaya City, 180 solid waste banks have been operated since 2014, with estimated total number of customers more than 10,000 [17].
Another effort for reducing the solid waste by the municipality is the provision of trained environment cadres. Selected volunteers from every district were trained by the municipality or NGOs. Their duty is to give personal assistance to the householders in RSW reduction. About 28,000 environment cadres had been trained for serving all communities in Surabaya City [18,19].
In addition to the above-mentioned efforts for solid waste reduction, the use of ‘‘Takakura’’ composting basket was introduced for treating the RSW biodegradable part in 1990s. Introduction of Takakura was done when the part-nership program between The Japan’s Kitakyushu Inter-national Techno-cooperative Association (KITA) and Surabaya Municipality took place. Seventeen thousand units of Takakura baskets were distributed to the local communities through the NGOs. Maeda reported that only 20 % of the communities continued practicing the Taka-kura method in Surabaya City [20]. The TakaTaka-kura program failed because the follow-up system was not prepared well. There were limitations in terms of expansion and scale because the program was handled only by NGOs [21]. Therefore, it is very interesting to perform this study in Surabaya City, in order to evaluate how the communities involved in reducing the solid waste after various efforts have been introduced.
This paper aimed to measure RSW generation rate, reduction potential and to describe the community activi-ties in RSW reduction program. Tenggilis Mejoyo District was selected as the study area from a total of 31 districts in Surabaya City for some seen activities in RSW 3R’s by the community and for the varied economic levels of the householders. Being inhabited by 58,058 people of 16,024 householders, this district consists of 5 subdistricts and occupies an area of 5.51 km2 [22]. The State Regulation No. 81/2012 concerning the Management of RSW and Similar Types of Solid Waste stipulates that every citizen and the managers of residential areas are obliged to con-duct solid waste separation and treatment [23]. The results of this research are meant to reveal how the RSW 3R’s program be implemented by the community in the study area, after 13-year introduction of community involvement in RSW reduction in Surabaya City.
Method
from different economic strata, which were then combined into a single sample [26]. The economical strata were determined according to annual land and building owner-ship tax, which was paid by each householder. The low income, middle income, and high income groups of tax were classified into three categories, namely: less than Indonesian Rupiah (IDR) 100,000; between IDR 100,000 and IDR 300,000; and higher than IDR 300,000 respec-tively. These tax categories were used to replace the income levels of the respondents. One of the reasons of using the tax category was that the householders were not open to give open information concerning their income.
This classification resulted in the following numbers of household samples of each stratum: 16 from the low eco-nomical stratum, 27 from the middle stratum, and 57 from the high stratum. Tenggilis Mejoyo District comprises five subdistricts, namely Panjang Jiwo, Prapen, Tenggilis Mejoyo, Kendangsari and Kutisari. The household samples were proportionally distributed and selected in these sub-districts. A total of 16 householders were selected in Pan-jang Jiwo subdistrict, 7 in Prapen, 18 in Tenggilis Mejoyo, 25 in Kendangsari, and 34 in Kutisari. The total number of family members in all householder samples was 469.
RSW samples for generation rate and composition measurement were collected from the selected household-ers. Each householder was provided with one plastic bag for placing the RSW, which was generated in 24 h. Col-lection of the RSW samples was done on the next day. Measurements of RSW generation rates and compositions were done according to Standard Test Method for Deter-mination of the Composition of Unprocessed Municipal Solid Waste ASTM D5231-92 [27]. Replication was done in eight consecutive days in order to cover daily fluctuation (which included weekdays and weekends) of the RSW generation rate. This method has been formally used as national standards for measuring MSW generation rate and composition in Indonesia to date [28].
A survey was conducted to the similar selected house-holder samples as described earlier for determining com-munity perceptions, activities and willingness in implementing the 3R’s activities. During the survey, the respondents were interviewed by a surveyor using ques-tionnaires, which were of closed questions with fixed options of answers. The data were tabulated for analysis.
Chi-squared (v2) correlation test was performed using SPSS software of 18th version in order to determine cor-relations between the predictor variables and the respond variables. The respond variables covered three categories of community activities, each of which was provided with two nominal scales as the following:
1. Sorting the RSW (Y1): respondent activity in separat-ing the RSW into decomposable and
non-decomposable materials. Y1=0, if respondent did not do the sorting; Y1=1, if respondent did the sorting.
2. Recycle the non-decomposable RSW (Y2): respondent activity in handcraft making from recyclable materials. Y2=0, if respondent did not do the handcraft making; Y2=1, if respondent did the handcraft making.
3. Produce compost (Y3): respondent activity in produc-ing compost from decomposable RSW material. Y3=0, if respondent did not do composting; Y3=1, if respondent did composting.
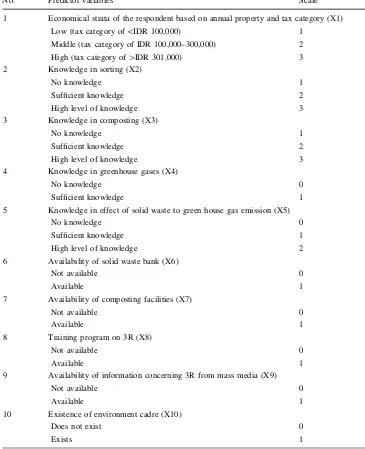
The predictor variables are listed in Table1.
Correlations among the respond variables and predictor variables were determined using the following hypotheses: 1. H0is accepted: if there is no correlation between the
respond variables (Y) and the predictor variables (X); 2. H1 is accepted: if there is correlation between the
respond variables (Y) and the predictor variables (X). Correlations between the predictor and respond vari-ables were determined according to the significance values (a) and Pearson v2values.
The correlation test between the predictor and respond variables was done as follows:
1. The predictor variable is correlated with the respond variable if the calculatedavalue was lower than 0.1, or the calculated Pearson v2 value was higher than v2 value in table (rejectH0and acceptH1).
2. The predictor variable is not correlated with the respond variable if the calculated a value was higher than 0.1, or the calculated Pearson v2 value
was lower than v2 value in table (accept H0 and
reject H1).
Results and discussion
RSW generation rate
area. Earlier studies showed that one of the factors which affected the generation rate of household solid waste was the income levels of the generators. The high-income group generated RSW with highest rate, and lowered in the middle towards the low-income groups [29,30].
RSW composition and reduction potential
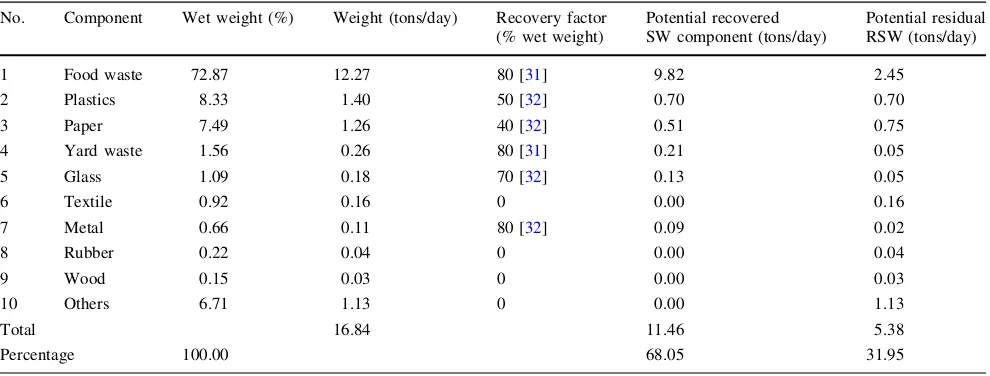
The RSW was dominated by food waste (72.87 %), fol-lowed by plastics (8.33 %), paper (7.49 %), and other components in smaller proportions (Fig.1). Paper, plastics, and metal waste components were the most preferred materials for separation by the generators to be sold to waste collectors. The reduction potential of the RSW was estimated by using recovery factor values of each solid
waste component as described by Tchobanoglous et al. and Trihadiningrum et al. [31,32]. Solid waste recovery factor or recovery rate is defined as the weight percentage in wet basis of solid waste which is separated for reuse or recy-cling [31,33].
The estimated RSW reduction potential values in Tenggilis Mejoyo District are shown in Table3. Food waste has a recovery factor of 80 %. This means that 80 % of food waste can be potentially treated as raw material for compost or biogas production. The remaining 20 % should be disposed of as residual matter. As shown in Table3, if the 3R’s program worked effectively, the RSW could be potentially reduced up to 11.46 tons/day (68.05 %), leaving 5.38 tons (31.95 %) of residual components for final dis-posal. This reduction potential could be achieved if all Table 1 List of predictor
variables and scale of each variable
No. Predictor variables Scale
1 Economical strata of the respondent based on annual property and tax category (X1)
Low (tax category of\IDR 100,000) 1
Middle (tax category of IDR 100,000–300,000) 2
High (tax category of[IDR 301,000) 3
2 Knowledge in sorting (X2)
No knowledge 1
Sufficient knowledge 2
High level of knowledge 3
3 Knowledge in composting (X3)
No knowledge 1
Sufficient knowledge 2
High level of knowledge 3
4 Knowledge in greenhouse gases (X4)
No knowledge 0
Sufficient knowledge 1
5 Knowledge in effect of solid waste to green house gas emission (X5)
No knowledge 0
Sufficient knowledge 1
High level of knowledge 2
6 Availability of solid waste bank (X6)
Not available 0
Available 1
7 Availability of composting facilities (X7)
Not available 0
Available 1
8 Training program on 3R (X8)
Not available 0
Available 1
9 Availability of information concerning 3R from mass media (X9)
Not available 0
Available 1
10 Existence of environment cadre (X10)
Does not exist 0
householders were willing to do RSW separation and treatment activities.
Community activities in RSW separation
Community activities in RSW separation include sorting the recyclable materials, such as paper, plastics, and metals
from decomposable and residual components. Among 100 respondents being surveyed by direct interview, 37 % separated and collected the recyclable RSW components for further treatment. The other 63 % did not do this activity. Sixty percents of those who did not do the RSW separation stated that they were willing to do the RSW separation in the future, and the other 40 % refused to do this activity (Fig.2).
From five reason options being questioned to respon-dents who did RSW separation during the survey, 41 % stated that self awareness as the reason (Table4). The other 30 % declared that they did the RSW separation due to community leader instruction. Other respondents (11 %) mentioned that the reasons were as effect of training, and for generating family income (5 %). The remaining 13 % of the respondents mentioned other reasons, such as: fol-lowing friends, folfol-lowing instruction of the women asso-ciation, for contributing the sorted materials to neighbors, waste pickers, or local organization.
The reasons of the respondents who did not separate the RSW were: time unavailability (30 %), laziness (17 %), Table 2 Results of RSW
generation rate measurement in Tenggilis Mejoyo District
Day Number of householder samples
Number of family members
RSW weight (kg) RSW generation rate (kg/person day)
(a) (b) (b)/(a)
1 100 469 133.80 0.29
2 127.00 0.27
3 125.00 0.27
4 146.90 0.31
5 152.50 0.33
6 132.00 0.28
7 130.70 0.28
8 135.40 0.29
Average 0.29
Food Waste 72.87% Plastics, 8.33%
Paper, 7.49% Yard Waste
1.56%
Glass, 1.09% Textile, 0.92%
Metal, 0.66% Rubber, 0.22%
Wood, 0.15% Others, 6.71%
% = % wet weight
Fig. 1 RSW composition in Tenggilis Mejoyo District
Table 3 RSW reduction potential in Tenggilis Mejoyo District
No. Component Wet weight (%) Weight (tons/day) Recovery factor (% wet weight)
Potential recovered SW component (tons/day)
Potential residual RSW (tons/day)
1 Food waste 72.87 12.27 80 [31] 9.82 2.45
2 Plastics 8.33 1.40 50 [32] 0.70 0.70
3 Paper 7.49 1.26 40 [32] 0.51 0.75
4 Yard waste 1.56 0.26 80 [31] 0.21 0.05
5 Glass 1.09 0.18 70 [32] 0.13 0.05
6 Textile 0.92 0.16 0 0.00 0.16
7 Metal 0.66 0.11 80 [32] 0.09 0.02
8 Rubber 0.22 0.04 0 0.00 0.04
9 Wood 0.15 0.03 0 0.00 0.03
10 Others 6.71 1.13 0 0.00 1.13
Total 16.84 11.46 5.38
impracticality (16 %), inefficiency (11 %), no technical knowledge for RSW treatment (8 %), no facility for sorting the RSW materials (5 %), no separate bin facility (5 %), and other reasons (8 %) as shown in Table5. The highest percentage of respondents declared that they have limited time to participate in RSW separation. Laziness or lack of interest was classified as individual barrier, which some-times outweighed the environmental concern [34].
Respondents who stated that the RSW separation was inefficient, explained that the RSW collection crew always remixed the separated RSW components when loaded to the collection vehicle. The handcarts and trucks, which served house to house RSW collection, were not facilitated
with a procedure for collecting the sorted RSW nents separately. Therefore, all separated RSW compo-nents were mixed, when deposited in transfer depots for further transport to the final disposal site. This condition is not favorable for the householders in implementing the RSW separation at source.
One of the policies in Surabaya City is to modify a number of solid waste transfer depots to become 3R’s facilities [35]. These facilities may work well with com-munity involvement if the municipality facilitates appro-priate collection vehicles for separated waste components.
RSW recyclable material handling
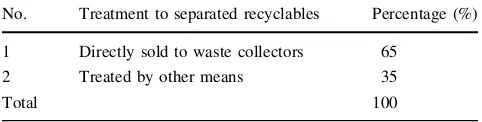
The majority (65 %) of respondents who did RSW sepa-ration stated that the recyclable non-compostable waste materials, such as paper, plastics, and metals, were directly sold to recyclable waste collectors (Table 6). This attitude is commonly done by householders in Surabaya City because it is most practicable for additional income gen-eration from the solid waste. Recyclable waste collector is part of informal sector, whose business is as buyer of recyclable solid waste from the generators or solid waste pickers. The waste collector workshops operate throughout Surabaya City and easy to find. The recyclable solid waste is further sold to the agent, whose hierarchy in informal sector is higher than the collectors. The agent performs limited treatment to the recyclable solid waste, such as washing the plastic waste, shredding it into flakes, pel-letizing the flakes, and packaging. Such a phenomenon was common in developing countries in Asia, where simple recycling technologies were applied [36]. The treated recyclables are sold to the manufacturing industries [32, 37]. The other 35 % of respondents treated the recyclable waste materials by other means, i.e. contributed to solid waste pickers or to community leader, or saved in the solid waste bank.
This situation indicates that the informal sector plays an important role in handling the recyclable non-com-postable RSW materials after segregation by the house-holders. Visvanathan et al., however, suggested that a more formal promotion, technology transfer, and policy refor-mulation of 3R’s based solutions were needed for coping with the solid waste problem [36].
RSW separation
activities
37% of respondents sorted the RSW
63% of respondents did not sort the RSW
60% were willing to do RSW
separation
40% refused to do RSW separation
Fig. 2 Community activities in RSW separation
Table 4 Reasons of respondents in performing RSW separation
No. Reasons Percentage (%)
1 Self awareness 41
2 Community leader instruction 30
3 Effect of training 11
4 To increase family income 5
5 Other reasons 13
Total 100
Table 5 Reasons of respondents who did not do RSW separation
No. Reasons Percentage
(%)
1 Unavailability of time 30
2 Laziness 17
3 Impracticality 16
4 Inefficiency 11
5 No technical knowledge for further treatment 8
6 No facility for storage of the sorted RSW materials
5
7 No separate bin facility 5
8 Other reasons 8
Total 100
Table 6 Treatment of recyclable RSW by the community
No. Treatment to separated recyclables Percentage (%)
1 Directly sold to waste collectors 65
2 Treated by other means 35
The actual reduction rate of non-compostable waste materials was influenced by the community participation rate of 65 %. This participation rate can be used for esti-mating the actual reduction rate of these types of RSW materials. The estimated actual recycling amount of non-compostable waste can be calculated using Eq.1:
Estimatedactualrecyclingamount of non-compostablewaste
¼communityparticipation factorpotentialrecyclingof plastics; paper;glass;and metals ð1Þ
Using Eq.1, the estimated actual recycling amount of non-compostable waste= 65 %9(0.70?0.51 ?0.13?0.09)=65 %91.43 tons/day=0.93 tons/day The potential recycling amount of these materials was 1.43 tons/day (calculated from data in Table3). The actual recycling rate of non-compostable waste materials can be calculated using Eq.2.
Estimatedactualrecyclingrateof non-compostablewastematerials
¼Estimated actual recycling rate of non-compostable waste
Total amount of the RSW
100 % ð2Þ
Hence, The estimated actual recycling rate of non-compostable waste materials¼ 0:93
16:84 100 % ¼5:52 %
The calculation above shows that the actual recycling rate of non-compostable solid waste materials is low, although the community participation factor is reasonably high. This is because of the low percentages of these materials (plastics, paper, glass and metals) in the RSW. Therefore, the community should focus more on treating the biodegradable solid waste materials.
RSW treatment
Only 8 % of the respondents made handcraft products, such as home ornament, laptop bags, shopping bags, jackets, and umbrellas, from plastic waste materials. The reasons for the low participation of handcraft making were the low generation rate of plastic waste material (50 %), the limited number of markets for the products (25 %), and the lacks of human resource (25 %). These activities were done either by individual (62 %) or com-munal (38 %).
The biodegradable organic waste was composted by only 17 % of respondents. This community participation value can be used for estimating the actual composting rate. The estimated actual recycling amount of biodegradable RSW can be calculated using the following equation:
Estimated actual recycling amount of compostable waste
¼community participation factor
potential recycling of food waste and yard waste
ð3Þ
Using Eq.3, the estimated actual recycling amount of compostable waste ¼ 17% ð9:82þ0:21Þ ¼ 17%
10:03 tons=day¼1:70 tons=day
The potential recycling amount of these materials was 10.03 tons/day (calculated from data in Table3). The actual recycling rate of compostable waste materials can be calculated using Eq.4.
Estimated actual recycling rate of compostable waste materials
¼Estimated actual recycling rate of compostable waste
Total amount of the RSW 100%
ð4Þ
Hence, the estimated actual recycling rate of compostable waste materials¼ 1:70
16:84 100%¼10:09%:
The low actual value of recycling rate of com-postable RSW material revealed that the community in the study area had not played a significant role in treating the biodegradable waste. The reasons stated by 83 % of the respondents who did not do composting activities were: unavailability of time (39 %), no technical knowledge (30 %), laziness (14 %), and the other reasons (17 %). The other reasons were: unavailability of space, health factor, insight factor, and lack of guidance. Fifty-three percent (53 %) of the respondents, who composted the biodegrad-able waste, made compost from the yard waste. The other 29 % composted combined yard waste and food waste, and only 18 % of the respondents composted food waste.
Correlations between the respond variables and the predictor variables
The calculated Pearson v2 values were compared to the values inv2table at a significance level of 0.1, and degrees of freedom of 1 and 2. The used values of v2 from the table were v2(1:0.10)=2.706 and v2(2:0.10)=4.605. The results of v2 correlation test on community sorting, composting and treating the recyclable component activi-ties with the predictor variables are shown in Tables7,8, and 9. Predictor variables listed in Tables7, 8, 9 were those with strongv2andavalues.
As shown in Table 7, the community involvement in RSW sorting strongly correlated with the training program on 3R’s activities, the availability of solid waste bank, and the existence of environment cadre (reject H0). The
sorting activity as it provided the community with infor-mation on the importance and the method of RSW sorting. This result met the conclusion of earlier study, which stated that routine training program could enhance solid waste separation by the generators [7]. The test results also revealed that the availability of solid waste bank gave strong correlation with community sorting activity. The solid waste bank provided access to the community to earn and save money from the recyclable waste
component value. Community activity in RSW sorting was also correlated with the existence of environment cadres, whose task was to guide the householders to do 3R’s activities. In contrast, the economic strata of the community, role of mass media, knowledge on green house gases, knowledge in effects of the solid waste to GHG emission community, and knowledge in sorting of the solid waste did not correlate with RSW sorting activity (accept H0). This may reveal that the sorting activity has
Table 7 Results ofv2correlation test between the community sorting activity and the predictor variables
Predictor variables Degree of freedom v2value Calculateda Decision
Training program on 3R (X8) 1 11.108 0.001 Reject H0a
Availability of solid waste bank (X6) 1 8.408 0.004 Reject H0a
Existence of environment cadre (X10) 1 7.328 0.007 Reject H0a
Knowledge in sorting (X2) 2 1.985 0.371 Accept H0b
Economical strata (X1) 2 0.657 0.720 Accept H0b
Availability of information concerning 3R from mass media (X9) 1 0.139 0.709 Accept H0a
Knowledge in GHG (X4) 1 1.693 0.193 Accept H0a
Knowledge in effects of SW to GHG emission (X5) 2 4.451 0.108 Accept H0b
a
v2(1:0.10)=2.706
b
v2(2:0.10)=4.605
Table 8 Results ofv2correlation test of the community composting activity and the predictor variables
Predictor variables Degree of freedom v2value Calculateda Result
Availability of composting facilities (X7) 1 55.811 0.000 Reject H0a
Training program on 3R (X8) 1 13.271 0.000 Reject H0a
Knowledge in composting (X3) 2 12.656 0.002 Reject H0a
Existence of environment cadre (X10) 1 9.913 0.002 Reject H0a
Availability of information concerning 3R from mass media (X9) 1 3.854 0.050 Reject H0a
Knowledge in effects of SW to GHG emission (X5) 2 4.782 0.092 Reject Hob
Knowledge in GHG (X4) 1 0.226 0.634 Accept H0a
Availability of solid waste bank (X6) 1 0.159 0.690 Accept H0b
Economical strata (X1) 2 1.557 0.459 Accept H0b
a
v2(1:0.10)=2.706
b
v2(2:0.10)=4.605
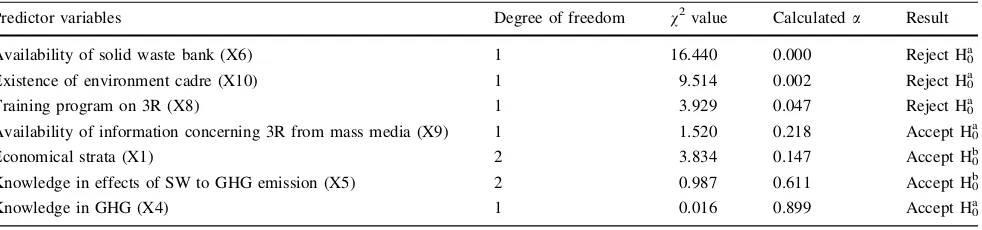
Table 9 Results ofv2correlation test between the treatment of RSW recyclable waste materials and the predictor variables
Predictor variables Degree of freedom v2value Calculateda Result
Availability of solid waste bank (X6) 1 16.440 0.000 Reject H0a
Existence of environment cadre (X10) 1 9.514 0.002 Reject H0a
Training program on 3R (X8) 1 3.929 0.047 Reject H0a
Availability of information concerning 3R from mass media (X9) 1 1.520 0.218 Accept H0a
Economical strata (X1) 2 3.834 0.147 Accept H0b
Knowledge in effects of SW to GHG emission (X5) 2 0.987 0.611 Accept H0b
Knowledge in GHG (X4) 1 0.016 0.899 Accept H0a
a
v2(1:0.10)=2.706
b
been accepted by the community of all strata as part of their involvement in RSW management.
The local government and the NGOs provided composting facilities for the community. These facilities were ‘‘Taka-kura’’ composting baskets, composting drums, and a compost house. Results of the survey showed that 10 respondents from 17, who did composting (58.8 %), performed individual composting process; in which 8 respondents (47 %) used ‘‘Takakura’’ baskets and the two others (11.8 %) used com-posting drums. Seven respondents (41.2 %) preferred to use communal composting in the compost house.
Although the facilities were provided, only limited number of respondents involved in composting. The most probable reasons of this situation were the low selling price of compost, which was only IDR 700/kg or USD 0.05/kg, a lack of market for the compost product, and the lengthy period needed for the composting process [31, 38, 39]. Maeda reported that only about 200 out of 1000 householders practiced composting in 2009 in Surabaya City, where an NGO ‘‘Pusdakota’’ was located. This author also stated that composting was easy, but required extra preparation work (cutting the solid waste into small pieces), and continuous care for moisture and insect control [38].
The results ofv2correlation test (Table8) showed that the composting activity by the community showed strongest correlation with the availability of the composting facilities. Other factors which gave correlations were training program, knowledge in composting, existence of environment cadres, role of mass media, and knowledge in effects of the solid waste to GHG emission. Knowledge in GHG, economic strata, and availability of solid waste bank did not correlate with com-posting activity (acceptH0). The solid waste bank does not
give correlation to the composting activity by the community, because it only accepts non-compostable RSW materials, such as paper, plastics and metals.
The recyclable RSW materials, which comprised waste paper, plastics, and textile were used as raw materials for handcraft product or sold to the solid waste bank and the informal sector. The correlated predictor variables to community activities in treating the recyclable non-com-postable RSW materials were: availability of solid waste bank, availability of environment cadre, and training pro-gram. The mass media, economical strata, knowledge in GHG, and knowledge in effects of the solid waste to GHG emission did not correlate to the recycling activity of non-compostable solid waste (Table9).
Conclusion
The RSW generation rate in Tenggilis Mejoyo District was 0.29 kg/person day, producing a total 16.84 tons of RSW every day. If community participation in the 3R’s program
works optimally, the RSW could be reduced up to 67.92 %. The current data on community participation in RSW reduction in the study area were: 37 % of the respondents separated the RSW into recyclables and biodegradable waste and 17 % performed composting activity. Three main reasons of those who did RSW reduction were self awareness (41 %), instruction of community leader (30 %), and effect of training (11 %).
The community in Tenggilis Mejoyo District has not fully participated in performing the 3R’s activities of RSW, although a number of facilities (composting units, envi-ronment cadres, training program) were provided by the local authority and the NGOs. This proved that the com-munity awareness and participation in 3R’s activities were still low. In such a situation, promotion activities should be addressed on creating better and clear responsibilities among the government agencies and NGOs. Predictor variables, which showed strong correlations with the community activities, should be considered for supporting the promotion program.
Acknowledgments The authors acknowledge the Directorate of Higher Education, Ministry of Education and Culture of the Republic of Indonesia, for the Research Grant Award BOPTN 2013, which supported the implementation of this research.
References
1. Agency for Population and Civil Registration of Surabaya City (2012) Registrasi Penduduk Kota Surabaya Tahun 2012 [Regis-tration of Surabaya City Resident of Year 2012]. Municipal Government of Surabaya City, Surabaya[in Indonesian] 2. Helmy M, Laksono TB, Gardera D (2006) 3R implementation in
Indonesia. Proceeding of Senior Official Meeting on the 3R Ini-tiative. JICA, Tokyo, Japan
3. State Ministry of Environment (2008) Statistik Persampahan Indonesia Tahun 2008 [Indonesian Solid Waste Statistics of Year 2008]. State Government of the Republic of Indonesia, Indonesia [in Indonesian]
4. Puspitarini, HD, Trihadiningrum, Y, Iriawan, N (2013) The evaluation of solid waste transfer and transport facilities in East Surabaya. Proceedings, The 4th International Seminar on Advances in Environmental Engineering, Denpasar, 25–26 June 2013, pp 576–586
5. Board of the Living Environment of Surabaya City (2012) Status Lingkungan Hidup Kota Surabaya [Environmental Status of Surabaya City]. Municipal Government of Surabaya City, Sur-abaya[in Indonesian]
6. Klundert AVD and Lardinois I (1995) Community and private (formal and informal) sector involvement in municipal solid waste management in developing countries. Background Paper for the UMP Workshop. Ittingen: 10–12 April
7. Zhuang Y, Wu SW, Wang YL, Wu WX, Chen YX (2008) Source separation of household waste: a case study in China. Waste Manag 28(10):2022–2030. doi:10.1016/j.wasman.2007.08.012 8. Chakrabarti S, Majumder A, Chakrabarti S (2009)
9. Joseph K (2006) Stakeholder participation for sustainable waste management. Habitat Int 30(4):863–871. doi:10.1016/j.habitatint. 2005.09.009
10. Tai J, Zhang W, Che Y, Feng D (2011) Municipal solid waste source-separated collection in China: a comparative analysis. Waste Manag 31:1673–1682. doi:10.1016/j.wasman.2011.03.014 11. Martin M, Williams ID, and Clark M (2006) Social, cultural and structural influences on household waste recycling: a case study. Resources, Conservation, and Recycling 48(4):357–395. doi:10. 1016/j.resconrec.2005.09.005
12. Trihadiningrum Y (2010) Corporate social responsibility program on community development, an experience of Surabaya City. Pan Pacific Conference XXV on managing and competing in the new world economic order. Nusa Dua, Bali: 31 May-2 June 13. Trihadiningrum Y, Nuririawan (2011) Public participation in
residential solid waste management in Surabaya City, East Java Province. Proceedings international seminar of environmental technology and management conference, Bandung, 3–4 Novem-ber 2011
14. Anonymous (2011) Memorandum program sanitasi Kota Sur-abaya Tahun 2011, program percepatan pembangunan sanitasi permukiman (PPSP) [Memorandum of sanitation program in Surabaya City in 2011, Accelerated development program in human settlement sanitation]. Sanitation Working Group of Surabaya City, Surabaya[in Indonesian]
15. Directorate of Human Settlement Sanitation (2013) Bahan ajar diseminasi dan sosialisasi keteknikan bidang PLP persampahan, Modul 5 [Teaching materials for dissemination and socialization of engineering aspects in solid waste management for human settlement sanitation, Module 5]. Directorate General of Cipta Karya, Ministry of Public Works, Jakarta[in Indonesian] 16. Trihadiningrum Y (2013) Modul 5: TPS3R dan bank sampah,
materi training diseminasi dan sosialisasi keteknikan bidang PLP sektor persampahan [Module 5: 3R transfer station and solid waste bank. Training material for dissemination and socialization of engineering aspects in solid waste management for human settlement sanitation]. Surabaya: 2–5 July 2013[in Indonesian] 17. Nugroho SA (2014) Penduduk Kota Surabaya terus bertambah, sampah masuk TPA malah berkurang [Population of Surabaya City continues to increase, the solid waste being disposed of in landfill is reduced instead]. SWA online http://www.swa.co.id/ businessstrategy. Accessed 26 January 2015[in Indonesian] 18. Dhokhikah Y, Trihadiningrum Y (2012) Solid waste management
in Asian Developing Countries: challenges and opportunities. J Appl Environ Biol Sci 2(7):329–335
19. Kurniawan TA, de Oliveira JAP (2014) Technology adaptation and assimilation of Takakura for promoting environmental pro-tection in Surabaya (Indonesia) through city level cooperation. In: Collaboration for sustainability, a role for sustainability driven by the global south. Springer Science, Business Media, Dordrecht 20. Maeda T (2013) Waste reduction through composting:
applica-tion of Surabaya’s model. JICA Training on Composting Man-agement: 29 July 2013
21. ECO-CSR JAPAN (2011) Case studies: The passion of a Japa-nese researcher who dedicates his life to the dissemination of the ‘‘magic bucket’’. Secretariat of ECO-CSR JAPAN, Tokyo, Japan. www.env.go.jp/earth/coop/eco-csrjapan/en/jpec.html
22. Surabaya Central Bureau of Statistics (2012) Kecamatan Teng-gilis Mejoyo dalam angka [TengTeng-gilis Mejoyo District in Figures]. Municipal Government of Surabaya City, Surabaya [in Indonesian]
23. Anonymous (2012) Peraturan Pemerintah Republik Indonesia No. 81/2012: Pengelolaan sampah rumah tangga dan sampah sejenis sampah rumah tangga [Government Regulations No. 81/2012 of the Republic of Indonesia: Management of residential solid waste and those with similar types to residential solid
waste]. State Government of the Republic of Indonesia, Jakarta [in Indonesian]
24. Almeda J, Capistrano T, Sarte G (2010) Textbook in elementary statistics. UP Press, Quezon City
25. Tejada JJ, Punzalan JRB (2012) On the misuse of slovin’s for-mula. The Philippine Statistician 61(1):129–136
26. Turner GA (2003) Draft: Handbook on Designing of Household Sample Surveys, Chapter Two: Sampling Strategies. United Nations Secretariat,Statistics Division, New York
27. ASTM (2011) Standard test method for determination of the composition of unprocessed municipal solid waste: ASTM D5231-92. ASTM International, West Conshohocken
28. National Standardization Agency of Indonesia (1995) Standar Nasional Indonesia No. 19-3964-1995 tentang metode pengam-bilan dan pengukuran contoh timbulan dan komposisi sampah perkotaan [Indonesian National Standards No. 19-3964-1995 concerning methods for sampling, generation rate measurement, and composition analysis of municipal solid waste]. National Standardization Agency of Indonesia, Jakarta[in Indonesian] 29. Aydamo AA, Nair AS, Zuberi MI (2012) Household solid waste
generation rate and physical composition analysis: case of Hos-a’ina City, SNNPRS, Ethiopia. J Recent Trends Biosci 2(1):22–28
30. Senzige JP, Makinde DO, Njau KN, Nkansah-Gyeke Y (2014) Factors influencing solid waste generation and composition in urban areas of Tanzania: The case of Dar-es-Salaam. Am J Environ Prot 3(4):172–178. doi:10.11648/j/ajep.20140304.11 31. Tchobanoglous G, Theisen H, Vigil SA (1993) Integrated solid
waste management, engineering principles issues. McGraw Hill International Editions, New York
32. Trihadiningrum Y, Wignyosoebroto S, Simatupang ND, Tirawaty S, and Damayanti O (2006) Reduction capacity of plastic com-ponent in municipal solid waste of Surabaya City, Indonesia. Proceedings International Seminar of Environmental Technology and Management Conference. Bandung: 7–8 September 2006 33. Troschinetz AM, Mihelcic JR (2009) Sustainable recycling of
municipal solid waste in developing countries. Waste Manag 29(2):915–923. doi:10.1016/j.wasman.2008.04.016
34. Singhirunnusorn W, Kidanun D, Kaewhanin W (2012) House-hold recycling behaviours and attitudes toward Waste Bank Project: Mahasarakham Municipality. J ASIAN Behav Stud 2(6):35–47
35. Mayor of Surabaya City (2014) Raperda tentang pengelolaan sampah Kota Surabaya [Regulation of Solid Waste Management of Surabaya City]. http://jdih.surabaya.go.id/pdfdoc/raperda_89. pdf. Accessed 7 March 2015[in Indonesian]
36. Visvanathan C, Adhikari R, Ananth AP (2007) 3R practices for municipal solid waste management in Asia. Kalmar ECO-TECH’07 and The Second Baltic Symposium on Environmental Chemistry. Kalmar, Sweden: 26–28 November 2007
37. Zurbrugg C (2002) Urban solid waste management in low-in-come countries of Asia. How to cope with the garbage crisis. Scientific Committee on Problems of the Environment (SCOPE) Urban Solid Waste Management Review Session, Durban, South Africa, November 2002
38. Maeda T (2009) Reducing waste through the promotion of composting and active involvement of various stakeholders: Replicating Surabaya’s solid waste management model. IGES Policy Brief 9 December 2009