Faculty Of Electrical Engineering
HIERARCHICAL SELF ORGANIZING MAP AND FOCUSING
INSPECTION STRATEGY FOR MOBILE ROBOT NOVELTY
DETECTION
Mohd Nurul Al-Hafiz bin Sha’abani
Master of Science in Electrical Engineering
HIERARCHICAL SELF ORGANIZING MAP AND FOCUSING INSPECTION STRATEGY FOR MOBILE ROBOT NOVELTY DETECTION
MOHD NURUL AL-HAFIZ BIN SHA’ABANI
A thesis submitted
in fulfilment of the requirements for the degree of Master of Science in Electrical Engineering
Faculty of Electrical Engineering
UNIVERSITI TEKNIKAL MALAYSIA MELAKA
DECLARATION
I declare that this entitled “Hierarchical Self Organizing Map and Focusing Inspection
Strategy for Mobile Robot Novelty Detection” is the result of my own research except as
cited in the references. The thesis has not been accepted for any degree and is not
concurrently submitted in candidature of any other degree.
Signature :...
Name :...
i
APPROVAL
I hereby declare that I have read this thesis and my opinion this thesis is sufficient in term
of scope and quality for the award of Master of Science in Electrical Engineering.
Signature :...
Supervisor Name :...
DEDICATION
i
ABSTRACT
ii
ABSTRAK
iii
ACKNOWLEDGEMENT
In the name of Allah, the Most Gracious and the Most Merciful, all praises and thanks to Allah as I have finally completed this thesis successfully. First of all, I would like to grab this opportunity to express my appreciation to my supervisor Dr. Muhammad Fahmi bin Miskon for his kindness, wisdom, enthusiasm, and guidance throughout the journey of this research. His willingness to help has tremendously contributed to my progress, and he had inspired me greatly with his encouragement and motivation to carry on with this research. On the other hand, I would like to acknowledge my co-supervisors, En. Norazhar bin Abu Bakar and Dr. Hamzah bin Sakidin who have contributed in accomplishing my research.
iv
1.7 Contribution of the Research 8
1.8 Thesis Outline 8
2. LITERATURE REVIEW 9
2.1 Theory and Issues of Novelty Detection on Mobile Robot Platform 9
2.1.1 Novelty Detection Process 9
2.1.2 Factors that Influence Novelty Detection Performance 11
2.1.3 Sonar Sensor in Novelty Detection 13
2.1.4 Mobile Robot Navigation System 15
2.1.5 Summary of Mobile Robot Novelty Detection Issues 16
2.2 Mapping Subsystem 18
2.2.1 Mapping in Novelty Detection 20
v
2.3 Monitoring Subsystem 27
2.3.1 Related Works on Sampling Strategy 28
2.3.2 Multi Resolution approach in data sampling 32
2.3.3 Summary of Monitoring Review 35
2.4 Performance Analysis - Receiver Operating Characteristics (ROC) 35
2.5 Summary 37
3. RESEARCH METHODOLOGY 39
3.1 Overall System Design 39
3.2 Mobile Platform, Navigation and Motion Control 41
3.2.1 Amigobot Mobile Robot 41
3.2.2 Navigation Parameters 42
3.2.3 Surveillance Condition and Approach 42
3.3 Mapping: Hierarchical Self Organizing Map 44
3.3.1 Mapping Approach 44
3.3.2 Mapping Process 46
3.3.2.1 Mapping Initiation 47
3.3.2.2 Map Expansion 48
3.3.2.3 Updating Map 49
3.3.3 Mapping Validation 51
3.3.3.1 Experimental Environment 52
3.3.3.2 Experimental Description 55
3.3.3.3 Experimental Setup 60
3.3.3.4 Performance Evaluation 63
3.4 Monitoring: Focusing Inspection Strategy 64
3.4.1 Monitoring Approach 64
3.4.2 FIS Modelling 65
3.4.2.1 FIS with step resolution model 68
3.4.2.2 FIS with linear resolution model 69
3.4.3 FIS validation 71
3.4.3.1 Experimental Environment 71
3.4.3.2 Experimental Description 73
3.4.3.3 Experimental Setup 74
3.5 Summary 76
4. RESULTS AND DISCUSSION 78
4.1 Performance of Hierarchical Self Organizing Map 78 4.1.1 Implementation on Inspection in a Normal Situation 78
4.1.1.1 Result 78
4.1.1.2 Discussion 81
4.1.2 Implementation on Inspection in a Novel Situation 82
4.1.2.1 Result 83
4.1.2.2 Discussion 86
4.2 Performance of Focusing Inspection Strategy 88 4.2.1 Performance of Inspection by Implementing FIS 88
4.2.1.1 Result and Discussion 88
4.2.2 Investigation on FIS activation 92
4.2.2.1 Result and Discussion 93
vi
4.2.3.1 Result and Discussion 99
4.3 Summary 103
5. CONCLUSION 104
5.1 Research Overview 104
5.2 Conclusion 105
5.3 Future Work 107
REFERENCES 109
APPENDIX A - AMIGOBOT SPECIFICATIONS 120
APPENDIX B - AMIGOBOT PARAMETERS 122
APPENDIX C - LOCALIZATION PARAMETERS SETTING 124
APPENDIX D - SONAR MODELLING 125
APPENDIX E - HIERARCHICAL SOM PARAMETERS DETERMINATION 128
APPENDIX F - ERROR ELLIPSE 133
APPENDIX G1 – HIERARCHICAL SOM ALGORITHM 135 APPENDIX G2 – FIS WITH STEP RESOLUTION MODEL ALGORITHM 136 APPENDIX G3 – FIS WITH LINEAR RESOLUTION MODEL ALGORITHM 137
APPENDIX H1 - MAPPING CODE 138
APPENDIX H2 - MONITORING CODE 149
vii
LIST OF TABLES
TABLE TITLE PAGE
2.1 4.1
A confusion matrix. 35
FP rate at highest TP rate achieved for all environments tested and
viii
Several examples of novel pattern in different type of data 2
The phases of novelty detection process. 10
General overview of novelty detection system. 11
A typical sonar beam pattern. 13
The assumption of sonar sensor measurement. 14
An example of crosstalk phenomenon. 15
The effect of odometry error which causes (a) translational error,
(b) rotational error and (c) drift error. 16
Arisen issues of novelty detection on mobile robot platform with an
array sonar sensor. 17
The problems of mobile novelty detection. 17
General mapping process in novelty detection. 19 Perception based map. Adapted from Tungadi and Kleeman (2007). 20 The initial and extension of a region in FRM. 21 A form of 3D point clouds of a corridor. Adapted from Nunez et.
al. (2009) 22
Images captured using a panoramic vision system. Adapted from
Chakravarty et. al. (2007) 23
The general system of monitoring strategy for novelty detection. 28 Multi resolution scanning system proposed by Harding and Ross. 33 A classic multi resolution pyramid representation. 34
The ROC curve. 36
Overall system overview. 40
The position and heading of 8 sonar disc on the Amigobot. 41
The Amigobot mobile robot. 42
The condition and approach of the surveillance. 43 Three layers in hierarchical Self Organizing Map. 45 Maps represented in a hierarchical SOM network structure. 46
Initial map structure. 47
ix The modelled sonar sensor beam in MobileEyes and MobileSim. 52
The simulation environment setup. 53
The laboratory environment setup. 53
The actual corridor environment. 54
Data gathered in simulation. 55
Data gathered in laboratory environment. 56
Data gathered in actual corridor environment. 56 The sequence of detected anomaly points during inspection
process. 58
The environmental setup for three novelty cases for mapping. 61 The environmental setup in field test for a presence of new object
case. 62
A construction of true positive boundary. 63
Repetitive Observation Strategy. 64
Frequency of measurement change using FIS. 66
Frequency of measurement change using FS. 68
Sampling distance and focusing rate change using FS. 69
Frequency of measurement change using FL. 70
Sampling distance and focusing rate change using FL. 70 The environment setup in laboratory t for FIS validation process. 72 The environment setup in field test for FIS validation process. 73
Determination of position estimation error. 74
The position of novel object (object A). 75
Result of TP against system sensitivity in simulation. 79 Result of TP against system sensitivity in laboratory experiment. 79 Result of TP against system sensitivity in field test. 80 Sample of inspection result in simulation and laboratory
experiment. 80
Sample of inspection result in field test. 81
ROC curve for simulation result. 83
ROC curve for laboratory experiment result 84
ROC curve for field test result. 84
Inspection results for a presence of new object case at 0.9 of system
sensitivity. 85
TP percentage increment when compared with ROS versus width
object. 89
Detection result of ROS for object width 200mm. 89 Detection result of FIS for object width 200mm 90
Distance error versus width object. 91
False positive rate versus width object. 92
Graph number of TP detection versus width object of different
distance interval cases. 94
x 4.17
4.18
4.19 4.20
4.21
4.22
4.23 4.24
4.25
Example of inspection results between ROS and FL which give an
equal number of TP detection. 96
Example of inspection results between FS and FL which produced
the same result of TP detection. 97
Inspection result at r0 = 300 with width object is 200mm. 98 The unfiltered result of FL in inspecting object with 200mm width
at r0 = 300mm. 98
Percentage of increment on TP detection of FS and FL when
compared with ROS in different initial distance travel, r0. 100 Result of position error for all methods in different initial distance
travel, r0. 101
FP rate for all method in different initial distance travel, r0. 101 Overall result of inspection for all methods in field test when r0
=100mm and 200mm. 102
Overall result of inspection for FIS method in field test when r0
xi
LIST OF ABBREVIATIONS
ARIA - Advanced Robotics Interface for Applications
BMU - Best Matching Unit
FIS - Focusing Inspection Strategy FL - FIS with Linear Resolution
FN - False Negative
FP - False Positive
FRM - Flexible Region Map
FS - FIS with Step Resolution
GMM - Gaussian Mixture Model
ROC - Receiver Operating Characteristics SCT - Spherical Coordinate Transform
SOM - Self Organizing Map
SONARNL - Sonar-based Advanced Robotics Navigation and Localization
TN - True Negative
xii
LIST OF PUBLICATIONS
1. M.N.A.H. Sha'abani and Miskon, M. F., 2011. “The Effect of Anomaly Detection Accuracy in Varying the Angular Resolution of Sonar Using Repetitive Observation Strategy”, in Proceedings of the IEEE Symposium on Industrial Electronics and Applications (ISIEA), Langkawi, Malaysia, 25-28 Sept, IEEE Publisher, pp. 669-674.
2. M.N.A.H. Sha'abani, M.F. Miskon and M. H. Taib. 2011. “A Focusing Inspection Strategy for Recognizing the Presents of an Anomalous” in Malaysian Technical Universities International Conference on Engineering and Technology (MUiCET), Batu Pahat, Malaysia, 13-15 Nov.
3. M.N.A.H. Sha'abani, M.F. Miskon and H. Sakidin. 2013. “Hierarchical Self Organizing Map for Novelty Detection using Mobile Robot with Robust Sensor”, in 5th International Conference of Mechatronics (ICOM’13), Kuala Lumpur, Malaysia, IOP Publishing: IOP Conference Series: Materials Science and Engineering, 012018.
1
CHAPTER 1
INTRODUCTION
1.1 Introduction
Novelty detection is a perception of recognizing changes in an environment based
on previous experience knowledge (Markou and Singh, 2003a, Markou and Singh, 2003b).
It is an important inherent ability of animals for their survival. By detecting a novelty or
unexpected perception, animals can use it as their first approach in hunting preys or
avoiding predators. In animal science, the study of animal nervous systems that influences
their natural behaviour is neuroethology (Hoyle and Graham, 1984). A popular research in
this field, done by Jörg-Peter Ewert et. al. was on the natural behaviour of a toad in
prey-predator situation. They found that a toad responses to a specific cues such as shape,
colour, size and movement of the stimulus. Similar concept is used in novelty detection.
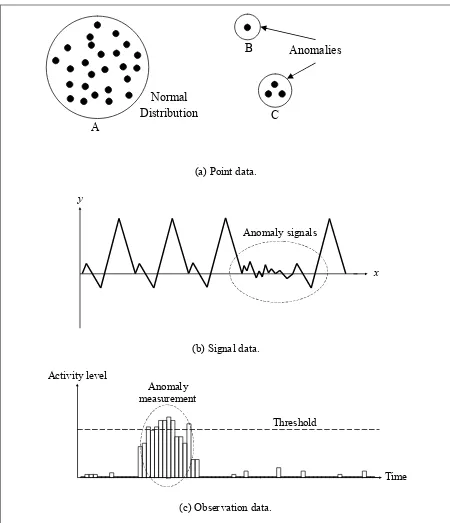
There are several types of data engaged in novelty detection such as data point,
pattern of signals and observation data. Figure 1.1 depicted some examples of novelty
pattern in several types of data. A novelty is usually identified after several processes of
raw data. In this thesis, a novelty is referred as a group of anomaly points.
For the past decade, there have been various fields that benefited from novelty
detection such as aeronautics (Brotherton and Johnson, 2001, Hayton et. al., 2001),
medical (Tarassenko et. al., 1995), robotics (Marsland et. al., 2000b, Marsland et. al.,
2005, Neto and Nehmzow, 2005a, Miskon, 2009, Sofman et. al., 2009), computer
2
forensic (Ratle et. al., 2007). By learning the normal state rather than learning all possible
abnormalities, novelty detection has become practical for surveillance and inspection
applications.
(a) Point data.
(b) Signal data.
(c) Observation data.
Figure 1.1: Several examples of novel pattern in different type of data Anomaly signals
y
x
Threshold Anomaly
measurement Activity level
Time Normal
Distribution
Anomalies B
3
In surveillance system, the most important thing is the ability of a system to
accurately determine the presence of a novelty with a low or zero occurrence of false
alarm. It is an advantage if the system can estimate the position of novelty source; hence an
immediate action for further analysis can be done. To realize this task, a mobile novelty
detection system is required. For this reason, this research is focused on the development
of a surveillance system by implementing a mobile robot as a platform of novelty
detection.
Recently, novelty detection has become popular in mobile robot's field, especially
for surveillance and inspection purposes (Nehmzow and H.V.Neto, 2004, Marsland et. al.,
2005, Miskon and R.Russell, 2008, Di Paola et. al., 2010, Neto, 2011). Training a robot to
learn a normal state and highlighting changes in an environment is an attractive idea.
However, it is not a trivial task to be achieved due to some of the technical challenges. As
it is a machine learning process, there is no guarantee that the robot could learn every
possible problem (Marsland, 2001).
The key idea of mobile robot novelty detection is to achieve an autonomous mobile
robot that can stay alert of any changes in the environment. The ultimate goal is to utilize a
mobile robot capable of performing novelty detection with a high true positive detection
while at the same time minimizing false positive detection. By using an inexpensive and
high noise sensor, the method proposed is expected to be adaptable for other types of
sensors.
In this research, an Amigobot mobile robot attached with an array of eight sonar
sensors was used. The robot is tasked to learn an indoor environment (i.e. corridor) and do
4
potential surveillance activities that may benefit from a mobile novelty detection system.
The motivation of this research will be presented in the next section.
1.2 Motivation
There are many advantages of using a mobile robot for novelty detection. The most
important thing is an appropriate action can be taken immediately. For example, a robot
attached with sonar sensors can be used to preliminary identify an abnormal object. An
immediately action such increasing sampling rate and going close to the object can
increase the reliability of the detection. Once the presence of an abnormal object is
confirmed, further investigation using other available sensors can be taken. This can avoid
the risk of human from becoming a victim of an explosion if the suspected object is a
bomb.
Furthermore, performing novelty detection in mobility platform overcomes the
limitation of a static sensor such sonar sensor. The sensor can be transported to any edge of
covered environment. This will lower the cost of system installation since a single sensor
can cover most of the inspection environment rather than installing many sensors in each
part of the environment (Miskon, 2009).
Another advantage is that a robot is capable of performing its tasks repeatedly with
a constant accuracy and performance (Craig, 2004). In this case, human can easily get tired
or become bored. This is an extremely important characteristic of the inspection system to
get an acceptable result. In order to achieve this, the system should be capable of
distinguishing the perceptions received at a specific location whether it is deviating from
its normal state or not. In the next section, the discussion of constraints and problems
5
1.3 Problem Statement
The main problem of a novelty detection system is the occurrences of false alarm,
especially false positive detection. It happens when the system has wrongly identified a
normal measurement as an abnormal one. This makes a mobile robot perform unnecessary
action, hence wasting robot energy and inspection time. There are two processes that
potentially contribute to the occurrence of false positive detection, which are mapping and
monitoring process.
In order to perform novelty detection in an environment, a robot requires a map that
stores the normal state of the environment. To take advantage of a mobile platform, the
learned normal data should be associated with the robot pose. This is to ensure that it can
determine the position of the novel object. However, due to localization error, the
association of data with its respective robot pose can be misclassified if the process is
carried out directly. Besides that, even if the localization is accurate, the measurement error
can also reduce the accuracy of the map built. These problems disrupt the quality of the
map and the performance of detection during inspection.
Since the mapping built might not always be accurate, there are possibilities on
occurrences of false positive detection in inspection. Although this happens occasionally, it
is hard to determine whether the detection is a false or actually a true positive. Thus, a
novelty is identified by grouping the anomaly points found. However, an inspection with a
fixed distance interval for each measurement can cause the robot to overlook a novel
object. This is especially true when the object exists between reading intervals.
Furthermore, sonar sensor has a limitation on its firing angle which can cause a low
number of true positive detection and in addition, might be rejected by a novelty filter,
6
measurement or with the highest capability of sensor operation can cause excessive data to
be processed. It will be disadvantages to a high dimensional sensor for such vision.
In order to solve the problems, this thesis proposes two solutions. The first concerns
the effect of localization and sonar measurement errors on the quality of map building. A
new mapping technique based on perception based map and hierarchical neural network is
proposed. The method works by adopting both localization and measurement error into
robot learning. The robot should be train by allow it to run several times in a normal state
of an environment so that it can adopt both normal data and the errors. By this method, it is
hypothesized that the robot will recognize the errors as normal during inspection, thus will
reduce the occurrences of false alarm.
The second solution involved sensor measurement errors and monitoring strategies.
A multi-resolution monitoring technique is proposed. It is a technique of changing the
detection rate per area based on detected anomaly points. The idea is to increase the
frequency of measurement only when a suspicious measurement is detected. Combined
with clustering and filtering technique, high number of data in a single cluster will identify
as a novelty, whereas low number of data will be rejected. For example, if novelty is
present, the robot will keep it measurement in high rate so that more data is collected, thus
high number of data can be grouped together. However, when the suspicious measurement
is a false positive, the detection rate per area will back to low in the next measurement
since the occurrence of false positive is very rare. This will leaving the false positive
detection as a single cluster and can be rejected. Through method, it is hypothesized that
this will increase the true positive detection and the accuracy of position estimation of a
7
1.4 Objectives
The general aim of this research is to utilize a mobile robot in detecting novelty
with a low false positive detection, high true positive detection and improve the accuracy
of inspection. To be more specific, the objectives of this research are:
i. To develop a mapping strategy that minimizing the occurrences of false
alarm.
ii. To develop a monitoring strategy that can increase the number of true
positive detection and increase the accuracy of novelty positioning
estimation.
iii. To validate both methods via simulation and experimentation based on
Receiver Operating Characteristics (ROC) curve analysis.
1.5 Scope of Works
The research focuses on implementing and utilizing a mobile robot for novelty detection
purposes. The scope of work includes:
i. Tools that be used is Amigobot mobile robot with an array of sonar sensors.
ii. The environment target is an indoor corridor.
iii. The novel object is static and no obstacle is considered along the robot route.