15
THEORETICAL BACKGROUND AND PREVIOUS RESEARCH
A. Theoretical Background 1. Indonesia Mutual Fund
The first reksa dana introduced in Indonesia was “Sertifikat Danareksa” at
1978 that was issued by the PT.Danareksa which was established at
December 28th, 1976. The company was once announced as the best local
issuer by the ASIAMONEY. The company has the research division which
called the Danareksa Research Institute (DRI) that given a routine result of
the fundamental analysis, technical analysis, and also sectored analysis.
Today, Danareksa is the only local company to offer direct market access
services to clients worldwide and has grown to become the company that
has underwritten the most equity and debt placements in Indonesia. By the
year of 1995, the Government of Indonesia announces a new regulation
related to the mutual fund whereas it covers the regulation of mutual fund.
The regulation was UU No. 8 Year 1995. This new regulation becomes the
starting point of the increasing numbers of mutual funds in Indonesia as the
announcement of the first closed-mutual fund issued by the PT.BDNI Reksa
At the year of 2006 according to the data from Bapepam for December 2006
(Bapepam, 2006) total fund collected from the mutual fund was Rp 52.28
billion and 16% or Rp 8.36 billion was the equity mutual fund. And for the
year of 2011, the equity mutual fund was collected for 36.27% or Rp54.88
billion from total Rp151.33 billion fund raised up to May 2011 (Bisnis,
2011). From this data the writer can take conclusion that the equity mutual
funds which serve at high risk and high income are still the most favorable
investments in Indonesia as the investors in indonesia are the type of risk
seeking.
According to invovesta (invovesta.com, 2011) and bapepam
(bapepam.go.id, 2011) in Indonesia there are various types of the Mutual
Fund:
a. Fixed Income Fund
Income funds are named appropriately: their purpose is to provide
current income on a steady basis. When referring to mutual funds, the
terms “fixed-income,” “bond,” and “income” are synonymous. These
terms denote funds that invest primarily in government and corporate
debt. While fund holdings may appreciate in value, the primary
objective of these funds is to provide a steady cash flow to investors.
As such, the audience for these funds consists of conservative
investors and retirees. Bond funds are likely to pay higher returns than
certificates of deposit and money market investments, but bond funds
bond funds can vary dramatically depending on where they invest. For
example, a fund specializing in high-yield junk bonds is much more
risky than a fund that invests in government securities. Furthermore,
nearly all bond funds are subject to interest rate risk, which means that
if rates go up the value of the fund goes down.
b. Money Market Fund
The money market consists of short-term debt instruments, mostly
Treasury bills. This is a safe place to park your money. You won’t get
great returns, but you won’t have to worry about losing your principal.
A typical return is twice the amount you would earn in a regular
checking/savings account and a little less than the average certificate
of deposit (CD).
This type of investment is really suitable for the investment with
lenght of time less than one year, in where this investment will act as a
complementary of investment beside the deposit or saving. The
purpose of investing in money market fund is to have a capital
insurance and to provide a high liquidity of money. So when we need
money immedietly we can cash out the investment as soon as possible
c. Equity Fund
Funds that invest in stocks represent the largest category of mutual
funds. Generally, the investment objective of this class of funds is
long-term capital growth with some income. This equity funds
represent the high risk high return theory since it is based on the
stocks portfolios. There are, however, many different types of equity
funds because there are many different types of equities.
The performance of the equity mutual fund in the October 2008 has
the decrease pattern as the Global Crisis. Along with the decreasing of
the Indonesia Capital Market Index (IHSG) the price of stock hitted
the lowest point for 1,111 which resulted in the NAV for the year
2008 has a lower point that the other years. For the year 2009, as the
growth of IHSG to the 2,530 point, the NAV were increased along
with it. In December 2009, the total NAB Equity Fund is Rp 35,51
billion (Simamora, 2010)
And for the year of 2011, the equity mutual fund was collected for 36,
27% or Rp54, 88 billion from total Rp151; 33 billion fund raised up to
May 2011 (Bisnis, 2011). Even though this type of mutual fund has
greater risk than the deposit, for the long term this investment is hoped
d. Balance Fund
The objective of these funds is to provide a balanced mixture of
safety, income and capital appreciation. The strategy of balanced
funds is to invest in a combination of fixed income and equities. A
typical balanced fund might have a weighting of 60% equity and 40%
fixed income. The weighting might also be restricted to a specified
maximum or minimum for each asset class.
This type of mutual fund has the best performance in the year 2010
where the combinantion of investing in stock and fixed income give a
very great return. When one of the investment is having the loss for
certain period, the other investment will give the gain to cover up the
loss and sometime give the surplus of gain. For the total of NAV of
Balance Fund at the year 2009 is Rp 15.66 billion and decrease for Rp
13.87 billion for January 2010 (Simamora, 2010).
A similar type of fund is known as an asset allocation fund. Objectives are
similar to those of a balanced fund, but these kinds of funds typically do not
have to hold a specified percentage of any asset class. The portfolio
manager is therefore given freedom to switch the ratio of asset classes as the
economy moves through the business cycle.
The idea is to classify funds based on both the size of the companies
a style of investing that looks for high quality companies that are out of
favor with the market. These companies are characterized by low P/E and
price-to-book ratios and high dividend yields. The opposite of value is
growth, which refers to companies that have had (and are expected to
continue to have) strong growth in earnings, sales and cash flow.
A compromise between value and growth is blend, which simply refers to
companies that are neither value nor growth stocks and are classified as
being somewhere in the middle. For example, a mutual fund that invests in
large-cap companies that are in strong financial shape but have recently seen
their share prices fall would be placed in the upper left quadrant of the style
box (large and value). The opposite of this would be a fund that invests in
startup technology companies with excellent growth prospects. Such a
mutual fund would reside in the bottom right quadrant (small and growth).
According to bisnis.com (2010), in Indonesia the equity fund is still the
most favorite one with contribution up to 36, 27% or Rp54.88 Billion from
total Rp151.33 Billion fund raised up to May 2011. As the major type of
investment which has the most investors, the equity mutual fund
performance should have been analyzed by many economist due to the need
of trustable information of the performance and the results has been
2. Net Asset Value (NAV) orNilai Aktiva Bersih (NAB)
A fund's net asset value or NAV equals the current market value of a fund's
holdings minus the fund's liabilities (sometimes referred to as "net assets").
It is usually expressed as a per-share amount, computed by dividing by the
number of fund shares outstanding. Funds must compute their net asset
value every day. Valuing the securities held in a fund's portfolio is often the
most difficult part of calculating net asset value.
3. Risk and Return
In finance, risk is the potential that a chosen action or activity (including the
choice of inaction) will lead to a loss (an undesirable outcome). The notion
implies that a choice having an influence on the outcome exists (or existed).
Potential losses themselves may also be called "risks". Almost any human
endeavor carries some risk, but some are much more risky than others.
Knight (1921) referred the term "risk," as loosely used in everyday speech
and in economic discussion, really covers two things which, functionally at
least, in their causal relations to the phenomena of economic organization,
are categorically different.
The essential fact is that "risk" means in some cases a quantity susceptible
of measurement, while at other times it is something distinctly not of this
character; and there are far-reaching and crucial differences in the bearings
of the phenomenon depending on which of the two is really present and
we shall use the term, is so far different from an immeasurable one that it is
not in effect an uncertainty at all.
In finance, risk is the probability that an investment's actual return will be
different than expected. This includes the possibility of losing some or all of
the original investment. In a view advocated by Damodaran, risk includes
not only "downside risk" but also "upside risk" (returns that exceed
expectations). Some regard a calculation of the standard deviation of the
historical returns or average returns of a specific investment as providing
some historical measure of risk; as we can see from the modern portfolio
theory.
In finance, risk has no one definition, but some theorists, for example Ron
Dembo, have defined quite general methods to assess risk as an expected
after-the-fact level of regret (Dembo, 2006). Such methods have been
uniquely successful in limiting interest rate risk in financial markets.
Financial markets are considered to be a proving ground for general
methods of risk assessment. However, these methods are also hard to
understand. The mathematical difficulties interfere with other social goods
such as disclosure, valuation and transparency. In particular, it is not always
obvious if such financial instruments are "hedging" (purchasing/selling a
financial instrument specifically to reduce or cancel out the risk in another
investor to catastrophic loss in pursuit of very high windfalls that increase
expected value).
In financial markets, one may need to measure credit risk, information
timing and source risk, probability model risk, and legal risk if there are
regulatory or civil actions taken as a result of some "investor's regret".
Knowing one's risk appetite in conjunction with one's financial well-being is
most crucial. A fundamental idea in finance is the relationship between risk
and return . The greater the potential return one might seek, the greater the
risk that one generally assumes. A free market reflects this principle in the
pricing of an instrument: strong demand for a safer instrument drives its
price higher (and its return proportionately lower), while weak demand for a
riskier instrument drives its price lower (and its potential return thereby
higher).
Market risk is the risk that the value of a portfolio, either an investment
portfolio or a trading portfolio, will decrease due to the change in value of
the market risk factors. The four standard market risk factors are stock
prices, interest rates, foreign exchange rates, and commodity prices:
a. Equity risk
This is the risk that one's investments will depreciate because of stock
market dynamics causing one to lose money. The measure of risk used
in the equity markets is typically the standard deviation of a security's
the normal fluctuations one can expect in that particular security
above and below the mean, or average. However, since most investors
would not consider fluctuations above the average return as "risk",
some economists prefer other means of measuring it.
b. Interest rate risk
It is the risk (variability in value) borne by an interest-bearing asset,
such as a loan or a bond, due to variability of interest rates. In general,
as rates rise, the price of a fixed rate bond will fall, and vice versa.
c. Currency risk
This is a form of financial risk that arises from the potential change in
the exchange rate of one currency in relation to another. Investors or
businesses face an exchange rate risk when they have assets or
operations across national borders or if they have loans or borrowings
in a foreign currency.
d. Commodity risk
This refers to the uncertainties of future market values and of the size
of the future income, caused by the fluctuation in the prices of
commodities. These commodities may be grains, metals, gas,
electricity etc.
While rate of return (ROR), also known as return on investment (ROI), rate
of profit or sometimes just return, is the ratio of money gained or lost
(whether realized or unrealized) on an investment relative to the amount of
interest, profit/loss, gain/loss, or net income/loss. The money invested may
be referred to as the asset, capital, principal, or the cost basis of the
investment. ROI is usually expressed as a percentage.
B. Previous Research
The snail trail method is relatively simpler since it only applies a combination
between risk and return of a mutual fund in 4 plotted quadrants. The horizontal
axis of the quadrant represents risk, while the vertical axis denotes return of the
mutual fund. Additionally, the risk and return of the mutual fund is plotted to
the quadrant from time to time, so that, the mutual fund’s movement can be
observed at the end. By using this method, both investor and investment
managers can monitor the movement of mutual fund’s performance, and
therefore, they can make any related decisions appropriately. Unlike the
traditional risk-return diagram, the snail trail method not only shows results
relative to the median or average fund manager, but is a robust tool for
comparing fund managers’ performance (Keng, 2000). This method is really
suitable for evaluating the performance of mutual fund for the long term
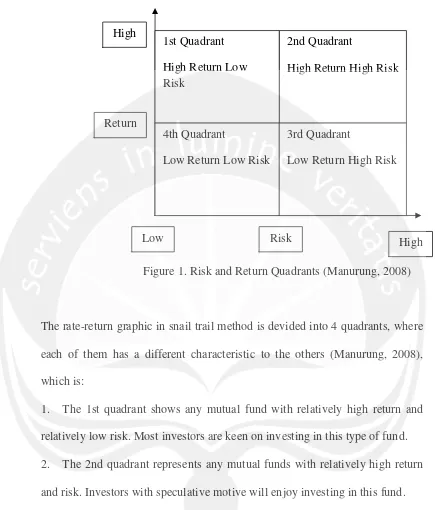
Figure 1. Risk and Return Quadrants (Manurung, 2008)
The rate-return graphic in snail trail method is devided into 4 quadrants, where
each of them has a different characteristic to the others (Manurung, 2008),
which is:
1. The 1st quadrant shows any mutual fund with relatively high return and
relatively low risk. Most investors are keen on investing in this type of fund.
2. The 2nd quadrant represents any mutual funds with relatively high return
and risk. Investors with speculative motive will enjoy investing in this fund.
3. The 3rd quadrant exhibits any mutual fund with relatively low return and
relatively high risk. Almost no investor prefers to invest in this type of fund.
4. The 4th quadrant displays any mutual fund with relatively low return and
relatively low risk. In general, golden-age or new investors have high
preference to invest in mutual fund located in this quadrant. 1st Quadrant
High Return Low Risk
2nd Quadrant
High Return High Risk
4th Quadrant
Low Return Low Risk
3rd Quadrant
Low Return High Risk
Low Risk High
High
According to Mangiring (2009) the research related to the mutual fund
performance has not found a fix answer about the market. Maleaki (2001) had
written in his thesis that the mutual fund can perform better that the market
index as the use of active strategy and passive strategy depend on the
calculation of raw performance.
To add some information related to the topic of snail trail method, here are
some another thesis. In his master thesis, Susilo (2010) wrote that at the
starting of Global Crisis, all of portfolios in Indonesia were in the second
quadrant (high return and low risk). This means that the return of the portfolios
was higher that the market return (IDX) whereas the risk of portfolios was
higher too but the performances of the mutual funds were on the average as on
the second quadrant. Therefore the investment managers ought to increase the
performance of their mutual funds.
Another example is from Simamora (2010). She wrote “Performance Analysis
of Fixed Income Mutual Fund Using the Risk Adjusted Return, Risk Ratio, and
Snail Trail” as her master thesis. She wrote that 10 Fixed Mutual Funds which
were first in the first quadrant and ended at the second quadrant would be the
choice of investors. The investors are the type of risk averse, risk taker, and
risk neutral. At the end of period of her research, most of the fixed income
mutual funds were in the first quadrant (high return and low risk) which made
each of the fixed income mutual fund. The investor were willing to give the
trust to the investment managers along with giving the money that will be used