DETERMINATION OF LAND SUITABILITY FOR GROWTH OF
LEUCAENA LEUCOCEPHALA
AND PREDICTION OF
THE FEED SECURITY IN KUPANG DISTRICT
BOGARTH K. WATUWAYA
GRADUATE SCHOOL
BOGOR AGRICULTURAL UNIVERSITY
BOGOR
STATEMENT
I, Bogarth K. Watuwaya, hereby stated that this thesis entitled:
DETERMINATION OF LAND SUITABILITY FOR GROWTH OF
LEUCAENA LEUCOCEPHALA AND PREDICTION OF
THE FEED SECURITY IN KUPANG DISTRICT
is a result of my own work under the supervision advisory board during the period
February until July 2011 and that it has not been published before. The content of the
thesis has been examined by the advising the advisory board and external examiner.
Bogor, August 2011
Bogarth K. Watuwaya
ABSTRACT
BOGARTH K. WATUWAYA. Determination of Land Suitability for Growth of
Leucaena leucocephala and Prediction of The Feed Security in Kupang District. Under the supervision of IDAT G. PERMANA and HARRY IMANTHO
The availability of forage for ruminant derived from leguminous especially like Leucaena leucocephala to be beneficial to farmers in Kupang district, along with the increasing population of livestock will also increase needs of continuously forage throughout the year; to find a suitable location for development of L.leucocephala, expected that growth and production will be optimum. The objectives of this study were to (1) determine the land suitability for development of L.leucocephala (2) predict feed security and (3) simulate the distribution patterns of L.leucocephala
based on the created scenario. The application of Geographic Information System (GIS), Analytical Hierarchy Process (AHP), ICPRC and LQ were used to process the data to determining the land suitability, Carrying Capacity and livestock base area in a region, Research result was simulated by model based on the principle of Cellular Automata. The research result showed that Kupang district has actual potential suitability land to be developed by L.leucocephala an area of 2,462.69 km2, comprising an area of 36.39 km2 classes S1, 1,890.52 km2 area of S2 class and area 205.78 km2 of class S3; ICPRC result that at least 481.714 AU can be added and LQ resulted 80% location is a livestock base. Simulation model show that both of scenario 2.5% and 5% of growth rate has a same value in carrying capacity although difference in distribution pattern.
ABSTRAK
BOGARTH K. WATUWAYA. Penentuan Kesesuaian Lahan untuk Pengembangan
Leucaena leucocephala dan Pendugaan Ketahanan Pakan di Kabupaten Kupang. Dibawah bimbingan dari IDAT G. PERMANA dan HARRY IMANTHO
Ketersediaan Hijauan bagi ternak ruminansia asal leguminosa khususnya
Leucaena leucocephala sangat penting bagi peternak di Kabupaten Kupang, seiring dengan peningkatan populasi ternak akan meningkatkan pula kebutuhan akan hijauan yang berkesinambungan selama kurun waktu setahun; melalui pengembangan penanaman L.leucocephala pada lokasi yang sesuai diharapkan akan meningkatkan pertumbuhan dan produksi yang optimum. Tujuan dari penelitian ini adalah (1) menentukan kesesuaian lahan bagi pengembangan L.leucocephala (2) memperkirakan ketahanan pakan dan (3) melakukan simulasi pola distribusi pengemabangan L.leucocephala sesuai dengan scenario yang dibuat. Penerapan Sistem Informasi Geografis (SIG), Proses Analisis Bertingkat (AHP), Kapasistas Penambahan Populasi Ternak Ruminansia (KPPTR), Penentuan daerah basis (LQ), dipakai untuk menentukan kesesuaian lahan, kapasitas tampung dan daerah basis ternak, Hasil dari penelitian ini kemudian ditampilkan melalui sebuah model simulasi berdasarkan prinsip Selular Automata. Hasil dari penelitian ini menunjukkan bahwa Kabupaten Kupang memiliki lahan yang sesuai untuk dikembangkan L.leucocephala
seluas 2.462,69 km2 yang terdiri dari 36,39 km2 kelas S1, 1.890,52 km2 kelas S2, dan 205,78 km2 kelas S3; nilai KPPTR menunjukkan kurang lebih 481.714 ST masih dapat ditambahkan pada Kabupaten Kupang, sedangkan hasil LQ menunjukkan bahwa 80% wilayah Kabupaten Kupang merupakan wilayah basis ternak. Model simulasi menunjukkan bahwa baik skenario laju pertambahan populasi sebesar 2,5% atau 5% memiliki nilai kapasitas tampung yang sama, yang membedakan adalah pola sebarannya.
SUMMARY
BOGARTH K. WATUWAYA. Determination of Land Suitability for Growth of
Leucaena leucocephala and Prediction of The Feed Security in Kupang District. Under the supervision of IDAT G. PERMANA and HARRY IMANTHO
This research aims to study and develop a system that can calculate the capacity of the land to sustain life and estimate the resilience of livestock feed from
Leucaena leucocephala and simulate the spatial distribution pattern of development of Leucaena leucocephala in Kupang district. CA Application of GIS and modeling technologies are used to prepare and process spatial data.
Determination of land suitability for development of Leucaena leucocephala
obtained from calculations of the growing conditions used by LREP 1994 which refers to the regulation of FAO (1976). Land suitability classification structure in the framework of FAO (1976) can be distinguished according to its level, namely the level of the Order, Class, Subclass and Unit. The Order is a state of global land suitability. At the level of orders suitability distinguishes between land that is classified as suitable (S) and not suitable (N). The term land suitability used by a lot of land classification system, especially by the Soil Conservation Services, USDA; in the USDA system, the soil mapping units are grouped primarily on the basis of ability or suitability of land for producing agricultural crops and fodder.
Leucaena leucocephala is a forage legume, which contains high protein required for animal growth. L.leucocephala has been used as the main fresh forage throughout the year for Bali cattle in Amarasi Sub District with satisfactory results, the legume has a big impact in supporting the productivity of Bali cattle. (Piggin and Nulik, 2005); Depending on variety, Leucaena is either a tall tree or a branchy bush.
L.leucocephala can be used for timber, firewood, fiberboard, paper, forage, fertilizer, landscaping, soil reclamation, shading for sun-sensitive crops, windbreaks and firebreaks as well as for dye, mucilage, jewelry and even human food. Moreover,
Leucaena seems adapted to many soils too barren for conventional crops and it is one of the fastest growing plants measured. It obtains its own nitrogen fertilizer from air, survives drought, tolerates the salt of costar areas and has a high resistance to pests and diseases. L.leucocephala is very well adapted to the semi-arid climate and the alkaline or relatively neutral soils of the area. The plant is deep-rooted and drought resistant and, being a legume, is adapted to low-N soils. Although its early growth is slow and susceptible to grazing and weed competition, L.leucocephala has proven easy to establish and is very persistent in most situations
known as Multi Criteria Analysis. The data have been obtained subsequently processed using the method of spatial analysis in order to obtain a map of land suitability with respect to areas of constraint. Constraint area is an area that should not be used as a development area L.leucocephala. This area is made up of water bodies, forests, protected areas, agricultural areas of wetland, water body, protected forest, protected areas, forest folk, produced forest, settlement, and wet land farming.
Kupang district has the actual potential area to be developed of
L.leucocephala an area of 2,462.69 km2, comprising an area of 366.39 km2 classes S1, S2 class area of 1,890.52 km2 and S3-class area of 205.78 km2, ICPRC analysis obtained values show a different trend for each sub-district, but the overall figures show that the district ICPRC still able to accommodate 481.714 AU of cattle to rely solely on native grasses and agricultural by product as feed. Location Quotient analysis resulted 10 areas in Kupang District showed that most areas is the livestock base area, except in sub-district Sulamu, Fatuleu, South Amfoang, and Southwest Amfoang are not be the base area, although the difference is only 0.1 compared to other regions.
ICPRC analysis obtained values show a different trend for each sub-district, but the overall figures show that the district ICPRC still able to accommodate 481.714 AU of cattle to rely solely on native grasses and agricultural by product as feed. Location Quotient analysis resulted 10 areas in Kupang district showed that most areas is the livestock base area, except in sub-district Sulamu, Fatuleu, South Amfoang, and Southwest Amfoang are not be the base area, although the difference is only 0.1 compared to other regions
Copyright @2011, Bogor Agricultural University Copyright are protected by law,
1. It is prohibited to cite all part of this thesis without referencing to and mention the source:
a. Citation only permitted for the sake of education, research, scientific writing, report writing, critical writing or reviewing scientific problems b. Citation does not inflict the name and honor of Bogor Agricultural
University.
DETERMINATION OF LAND SUITABILITY FOR GROWTH OF
LEUCAENA LEUCOCEPHALA
AND PREDICTION OF
THE FEED SECURITY IN KUPANG DISTRICT
BOGARTH K. WATUWAYA
Research Title : Determination of Land Suitability for Growth of
Leucaena leucocephala and Prediction of The Feed Security in Kupang District
Student Name : Bogarth K. Watuwaya Student ID : G 051 090 101
Study Program : Master of Science in Information Technology for Natural Resources Management
Approved by, Advisory Board
Dr. Ir. Idat G. Permana, M.Sc.Agr Supervisor
Harry Imantho,S.Si. M.Sc Co-Supervisor
Endorsed by,
Program Coordinator
Dr. Ir. Hartrisari Hardjomidjojo, DEA
Dean of Graduate School
Dr. Ir. Dahrul Syah, M.Sc.Agr
ACKNOWLEDGEMENTS
First of all, I would like to express my highest gratefulness to our Lord, Jesus
Christ, for His blessing, His will, His helps and guidance to me during my study.
The success of this study would not have been possible without various
contributions and support from many peoples and I would like to express my highly
appreciation to all of them.
I would like to express my thanks and sincere appreciations to Indonesian
Ministry of Agriculture for giving me the opportunity to continue my study and
providing the financial support for all expenses during study at Master of Science in
Information Technology for Natural Resources Management, Bogor Agricultural
University.
I wish to thank my supervisor, Dr. Ir. Idat G. Permana, M.Sc.Agr and my
Co-Suppervisor, Harry Imantho, S.Si, M.Sc for their guidance, supporting and kindly
provided me to valuable advice of my research. Moreover, I would like to thanks to
the external examiner Dr.Ir. H. Suryahadi, DEA for giving advices and valuable
correction to make this thesis acceptable.
I would like to thanks all staff at MIT secretariat, that support our
administration, technical and facilities. I would like to thank all MIT lecturers who
taught me with important knowledge.
I would like to thanks for my colleagues in MIT for helping, supporting and
togetherness, especially for Serge C. Rafanoharana for your kindly discuss about GIS.
My deep appreciation is extended to my family members; my lovely wife
Herlistin Watuwaya, my lovely daughter Triphena, Triphosa and Linggawandal, my
CURRICULUM VITAE
Bogarth K. Watuwaya was born in Salatiga, Central Java, Indonesia,
on October 12nd 1976. He spent his elementary school in Salatiga
until finished on 1989, and then continued His higher school level in
Kupang, East Nusa Tenggara. He achieved his undergraduate degree
in 2000 from Nusa Cendana University, Faculty of Animal
Husbandry, Majoring in Nutrition and Animal Feed. In 2009, Bogarth K. Watuwaya
pursued his Master degree at Master of Science in Information Technology for
Natural Resources Management (MSc in IT for NRM), Bogor Agricultural
TABLE OF CONTENTS
Page
3.4.2 Spatial Analysis and Analytical Hierarchy Process (AHP) for
LIST OF TABLES
Page
LIST OF FIGURES
Page
LIST OF APPENDICES
Page
I.
INTRODUCTION
1.1 Background
Land suitability is the degree of suitability of a parcel of land for specific use.
Land suitability can be assessed for the current state (the actual land suitability) or
after a repair (potential land suitability). Land suitability classification structure in the
framework of FAO (1976) can be distinguished according to its level, namely the
level of the Order, Class, Subclass and Unit. The Order is a state of global land
suitability. At the level of orders suitability distinguishes between land that is
classified as suitable (S) and not suitable (N). The term land suitability used by a lot
of land classification system, especially by the Soil Conservation Services, USDA; in
the USDA system, the soil mapping units are grouped primarily on the basis of ability
or suitability of land for producing agricultural crops and fodder.
The increase in of beef demand by society will lead to an increase in cattle
population to meet those needs. The Indonesian government policy to make meat
self-sufficiency by 2014 is expected to become reality by taking into several factor
such as supporting quality and availability of forage throughout a year.
These problems are challenging the government of East Nusa Tenggara
province to return the predicate in year 1970s that is East Nusa Tenggara as a cattle
source, with a policy that Kupang District is either one as center of Bali cattle (Bos
Sondaicus) producers. To be able to support that programs, District Kupang
government must give special attention to the availability of animal feeds, because in
order to develop Bali cattle (Bos sondaicus) on a large scale is needed necessary
availability of adequate and sustainable feeds throughout the year. The given climatic
conditions of the region are relatively dry; it needs a fodder crops which can survive
in poor conditions like this. East Nusa Tenggara is in a good position to encourage
the growth of the livestock sector, especially since the central government looked at
East Nusa Tenggara as one of the two main sources of animal cattle in Indonesia
Leucaena leucocephala is a forage legume, which contains high protein
required for animal growth. L.leucocephala has been used as the main fresh forage
throughout the year for Bali cattle in Amarasi Sub District with satisfactory results;
the legume has a big impact in supporting the productivity of Bali cattle. (Piggin,
2003, Nulik, 2002); Depending on variety, Leucaena is either a tall tree or a branchy
bush. It can be used for timber, firewood, fiberboard, paper, forage, fertilizer,
landscaping, soil reclamation, shading for sun-sensitive crops, windbreaks and
firebreaks as well as for dye, mucilage, jewelry and even human food. Moreover,
Leucaena adapted to many soils too barren for conventional crops and it is one of the
fastest growing plants measured. It obtains its own nitrogen fertilizer from air,
survives drought, tolerates the salt of costar areas and has a high resistance to pests
and diseases (Benge, 1980; Vietmeyer, 1980)
A recent experiments have shown that improved breeds of cattle will gain as
much as 1 kg in weight per day when fed a 100% ration of protein-rich Leucaena for
a 3 month-period prior to slaughter. These tests were conducted by the
Commonwealth Scientific and Industrial Research Organization (CSIRO) in
Australia. The leaves of improved strains of Leucaena contain 23%-30% protein by
dry weight. Cattle can consume a high intake of Leucaena for a period of four months
without any adverse effects, a length of time ideal for the fattening of cattle prior to
slaughter (Vietmeyer, 1980)
A Geographic Information System (GIS) is a system for capturing, storing,
analyzing and managing data and associated attributes which are spatially referenced
to the earth. GIS refers to computer software that provides data storage, retrieval, and
transformation of spatial (field) data. GIS software for digital agriculture will store
by considering many factors such as rainfall, temperature, soil type, topography and
other socio economic factors.
Cellular Automata (CA) is usually associated with synchronous deterministic
dynamics, and their asynchronous or stochastic versions have been far less studied
although significant for modeling purposes. CA has attracted growing attention in
growth simulation because their capability in spatial modeling is not fully developed
in GIS. CA can be extended and integrated with GIS to help planners to search for
potential suitability of L.leucocephala for sustainable development. The cellular
automata model is built within a grid-GIS system to facilitate easy access to GIS
databases for constructing the constraints. The essence of the model is that constraint
space is used to regulate cellular space. Driving force and constraints play important
roles in affecting modeling results. Combination of GIS and CA can be used as a
strong couple to model the L.leucocephala growth to take advantages of both the
technique. In case of GIS, its spatial data analysis capacities may be insufficient to
handle the complex of L. leucocephala growth dynamic.
1.2 Scope of Study
The area of study is restricted to district level. This study is focused to find
land suitability for growth of L.leucocephala in Kupang District, East Nusa Tenggara
Province, It covers suitable area for L.leucocephala growth by considering several
factors such as climate factor, physical factor, social and culture or attractiveness
area is suitable to be developed a L.leucocephala; it will be answered with consider
various criteria such as climatic factors, soil factors, topography factors, driving force
factors and constraints.
1.4 Research Objectives
The objectives of the study are to determining 1). Land suitability for growth
of L.leucocephala and 2). Develop a model that can represent spatial distribution
pattern of L.leucocephala and then 3). Predict the carrying capacity to support feed
security for Bali cattle industry in Kupang District with used integrated of GIS and
II.
LITERATUR REVIEW
2.1 The Amarasi Farming System base on Leucaena leucocephala
Bali cattle (Bos sondaicus) was introduced in 1912 under Dutch
encouragement, adapted well to Timor but did little to solve the problems of feeding
the population. Livestock, including cattle, water buffaloes and horses, were used
mainly for social and ritual purposes and were rarely eaten. Rulers and heads of
villages commonly accepted distributed livestock and sold the offspring for slaughter
in major centre, or for export. Lack of knowledge about livestock and grazing
management systems, or watering systems and improved pastures, resulted in high
mortality and low productivity. Uncontrolled, open range, and indiscriminant grazing
was also a problem to unfenced crops, and for the regeneration of forest areas after
cropping (Ormeling, 1955; Metzner, 1981).
In the 1930s, experimental plantings of Leucaena leucocephala were made
under the guidance of the Dutch administration on abandoned fields around the
The zones were amalgamated and expanded in 1960 and 1967, to include
most of western Amarasi. Any livestock straying onto cropping land could be killed
on the spot. Outside the zones, cattle could graze freely but had to be corralled once a
week. The successful implementation of land use zoning eliminated the need to build
have not been evident in Amarasi for a long time, and crop and livestock activities
require harvesting or cutting the fallow forest of L.leucocephala and associated
Some weaknesses found in Measurements of L.leucocephala in East Nusa
Tenggara, the mineral content of L.leucocephala suggest that low sodium,
phosphorus and copper may limit its nutritive value and, consequently, its role in
animal production. However, farmers in Amarasi already compensate for sodium
deficiency in L.leucocephala by the common practice of adding salt to drinking
Leucaena leucocephala. is a tropical species requiring warm temperatures
(25-30°C day temperatures) for optimum growth (Brewbaker et al. 1985). At higher
latitudes and at elevated tropical latitudes growth is reduced (Brewbaker et al. 1985),
suggest that temperature limitations occur above 1000 m elevation within 10°C
latitude of the equator, and above 500 m elevation within the 10-25°C latitude zone.
L.leucocephala can be found performing well in a wide range of rainfall
environments from 650 to 3,000 mm. However, yields are low in dry environments
and are believed to increase linearly from 800 to 1,500 mm, other factors being equal. Leucaena leucocephala has been one of the foremost tropical fodder trees,
soils and requires good levels of phosphorus and calcium for best growth (Cowan,
1998).
2.2 Increasing Capacity Population of Ruminant Cattle (ICPRC)
The Potential distribution and livestock development area is the capacity of
the territory to accommodate the additional population of ruminants. The increased
potential of ruminant livestock population has understanding of the dynamic,
changing over time, can grow and can be reduced. Rollinson and Nell (1974) was
develop a model called ICPRC or Increasing Capacity Population of Ruminant
Cattle; This method is useful to see how big an area has the potential to increase the
population of ruminants based on ability of forage in a region.
Based on the results of data processing of livestock population analysis with
ICPRC model obtained a values show a different trend for each region. ICPRC
positive value indicates a tendency that relevant districts still allow the addition of
ruminant livestock population of the existing number of livestock units, whereas
negative values indicate a tendency ICPRC concerned that the region needs to be
directed to the development of the area of land that is the carrying capacity of
principal farm businesses, such as grassland and the agriculture area.
Table 1 Conversion value base on wide of forage produce land (Rollinson and Nell , 1974)
No Real Wide Land Available Land for Grass production 1 Pasture / Grassland Whole area
2 Non productive paddy field 20% x paddy field area x 10% 3 Paddy field dike 2,5 x paddy field area
4 Plantation 5% x Plantation area
5 Forest 5% x forest area
6 Side Road 0,5 ha x length of road
2.3.1 Climate Factors
Climate factor is one of the physical and environmental factors that affect the
quality and quantity of growth and development. This factor needs to get a
specific study, because of the climate variables is a variable that can not be
given treatment or modified to make them correspond with the requirements
of growing plants. Even if can be done changes in climate variables, it will
require huge costs and no efficient compared with the results or the production
of agricultural commodities and have been determined. Climate factors consist
of:
· Annual temperature (o Celsius).
The temperature effect in a metabolisms functions as a determinant of
growth and development phase of the plant. Each plant has a certain
temperature limits, so it can grow and develop optimally. Analysis of air
temperature for zoning crop is using the average air temperature taken from
the existing climatologically station data and compare with the topography
of the region using Braak equation.
T = 27,3 - 0,0061h for 0 < h > 2000 asl
A condition called dry months when average monthly rainfall less than
60mm. The availability, timing and distribution of water is the primary
factor shaping the dynamics of the savanna ecosystem. The savanna
experiences recurrent episodes of drought lasting 4-8 months out of the
year. During this periods is plant activities is growing, dying,
decomposing, but at vastly reduced rates. Some studies have shown that
resistance to drought is more important to savanna vegetation than
resistance to fire. The plants that thrive in the savannas employ many
strategies to exploit available water and to survive from this condition. The
mechanisms of survival endow the savanna with its characteristic
appearance.
The primary water recruitment strategy of savanna tree species is to
maintain an extensive root system. The root system may extend deep
underground, sometimes reaching the water table, or it may be a shallow,
lateral system designed to harvest water over a broad area. Most leaves are
lost during the dry period. Seeds grow within thick casings that allow them
to survive until the first rainfall before germinating. And in the midst of
this thorny, corky, leathery protection, delicate, showy flowers bloom
briefly on grasses and shrubs.
In contrast to the grasses, savanna trees may conduct the entirety of
their reproductive cycle during the dry season. Such a strategy would
maximize the amount of foliage available for photosynthesis during the
rainy season.
Soil determines whether the deep roots will grow to their potential length.
Different soils have different moisture-holding and drainage capacities. The soils
underlying savannas cover a wide range of types, and it is thought that at least some
of these soils are inhospitable to tree growth, thereby maintaining the characteristic
physiognomy of the savanna. Soil type and geology bedrock have a major controlling
influence over the plant communities that will grow in them. Depending on their
structure, degree of porosity, and so forth, the major soil types may determine
whether a savanna is classified as moist or arid, independent of the amount of rainfall.
There are usually noticeable disconformities in soil type at the boundary between
forest and savanna, and again at the boundary between savanna and desert. Soil
factors consist of:
· Soil Texture.
Soil texture is an indicator that can indicate the ability of soil to
hold water. By using soil texture data determined the value of field
capacity and permanent wilting points are used to determine the limits of
land to provide water for plants.
· Effective Depth (cm).
Effective depth of soil is soil physical properties that become limiting for
the depth of plant roots. This property is often called the top soil layer
which shows a layer of soil that contain lots of nutrients with high fertility
rates that are necessary for plant growth and development. The more in an
effective depth of soil, then plant the opportunity to get the nutrients are
also getting bigger.
· Soil Acidity (pH).
The nature of soil pH levels to explain about the availability and absorption
of nutrients the soil. Based on the nature of the pH, the soil may be acidic
(pH<7.0), neutral (pH = 7.0) and bases (pH>7.0). Land is often the lowest
water (paddy field or swamp) are generally acid, while the chalky soil or
dry climates are generally alkaline. The nature of the soil pH affects plant
the appropriate pH range and can tolerate a certain pH range. Land can be
classified into classes of land suitability for each crop based on a pH range
where plants can grow and produce normally.
2.3.3 Topography Factors.
Compliance is assessed on the basis of topographic height of a place of sea
level and slope factors are calculated based on the interval contour lines.
Elevation somewhere correlated with average air temperature. Topography
factors consist of:
· Slope (%).
Gradient (slope) is expressed in percent, is impacting on many factors,
other variables such as drainage, cultivation techniques and optimal
planting area. In areas with high slope, Drainage will be fast mainly surface
flow, while on a sloping drainage area will is slower. Related to the impact
on cultivation techniques and the area planted, the areas with low slope
variation would be better if compared with areas with high slope variations
that will require more effective soil treatment.
· Elevation (m).
The average air temperature will decrease with increasing elevation of a
place, so that the elevation would be limiting for plant development
process. Much more appropriate commodities grown in areas with an
elevation of 0 to 700m above sea level, whereas at the higher regions more
suitable for horticultural commodities.
making requires availability of data, and tools to analyze data to be integrated in
complex information systems.
A Geographic Information System (GIS) is integrates hardware, software, and
data for capturing, managing, analyzing, and displaying all forms of geographically
referenced information. GIS allows us to view, understand, question, interpret, and
visualize data in many ways that reveal relationships, patterns, and trends in the form
of maps, globes, reports, and charts (Wyatt, 2003). A GIS application is automated
process that generates a spatially oriented product or result needed by user. GIS
application may include: map update or map production, data query and display,
spatial analysis, or other processes that use GIS software and geographic data (Ogaja,
2011).
Currently, the application of GIS for agricultural purposes has been widely
developed, GIS is becoming a more utilized business management tool for farmers
because of current trends that will continue to the future, GIS will see improvement in
hardware and software, changes in the way companies market and communicate to
their clients, development of full-services precision agriculture providers,
internet-based data access, and the increased use of GIS to ensure environmental compliance
(Pick, et al 2005).
The methodical approach to a GIS system design includes a GIS need
assessment and system architecture design. The system architecture design is based
on user workflow requirement identified in the GIS needs. The most effective system
design approach consider user need and system architecture constraints throughout
the design process (Ogaja, 2011).
2.5 Multi Criteria Evaluation (MCE) with Analytical Hierarchy Process
(AHP)
Land use change is often modeled as function of socio-economic and
(e.g. climatic factors such as rainfall, temperature, humidity and topographic
variables such as altitude, slope) and proximate or accessibility factors (e.g. distance
to roads, distance to settlements and distance to water etc.)
Multi Criteria Decision Making (MCDM) or Multi Criteria Evaluation (MCE)
problems involve a set of alternative that are evaluated on the basis of a set of
evaluation criteria (Jacoba et.al. 2008). Using MCE, different factors or change
drivers can be combined using appropriate weights assigned to the factors. The result
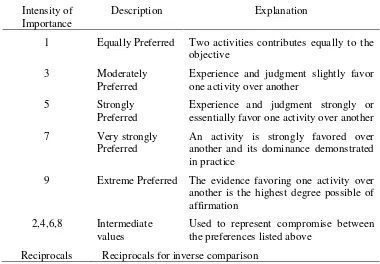
Table 2 Scale of preference between two elements (Saaty, 1991)
Intensity of Importance
Description Explanation
1 Equally Preferred Two activities contributes equally to the objective
3 Moderately
Preferred
Experience and judgment slightly favor one activity over another
5 Strongly
Preferred
Experience and judgment strongly or essentially favor one activity over another
7 Very strongly
Preferred
An activity is strongly favored over another and its dominance demonstrated in practice
9 Extreme Preferred The evidence favoring one activity over another is the highest degree possible of affirmation
2,4,6,8 Intermediate values
Used to represent compromise between the preferences listed above
Reciprocals Reciprocals for inverse comparison
The pair-wise comparison generates a matrix of relative rankings for each
level of hierarchy. The numbers of matrices depend on the number elements at each
level. The order of the matrix at each level depends on the number of element at the
lower level that links to it. After all matrices are developed and all pair-wise
comparison are obtained, eigenvectors or the relative weights, and the maximum
b) Compute the consistency index for each matrix of order n by the formula:
2.6 Cellular Automata (CA) Model
Cellular Automata (CA) are dynamic model that can be employed to simulate
the evolution or dynamic of wide variety of natural and human system. They are
processing algorithms that were originally conceived by Ulam and Von Neumann in
the 1940s to study the behavior complex system. CA model present a powerful
simulation environment represented by a grid of space (raster). In which a set of
transition rules determine the site attribute of each given cell taking into account the
attribute of cell in its vicinities. These models have been very successful in view of
their operationality, simplicity and ability to embody both logic and
mathematics-based transition rules, thus enabling complex global pattern to emerge directly from
the application of simple local rules. A cellular automaton system consists of regular
grid of cell, each of which can be in one of finite number of k possible state, updated
synchronously in discrete times steps according to local, identical interaction
(transition) rule. The state of cell is determined by the previous state of surrounding
neighborhood of cell. The types of spatial problems that can be approached using CA
model, include spatially complex system (e.g. landscape process), discrete entity
modeling in space and time (e.g. agricultural system, population dynamics) and
emergent phenomena. From the application perspective, CA is a dynamic model that
inherently integrates spatial and temporal dimension.
CA is composed of quadruple of elements as defined in the following
equation (White et.al 2000)
CA = {X, S, N, R}
where CA = Cellular Automaton;
X = CA cell space;
S = CA states;
N = CA cell neighborhood;
Cell space: the cell space is composed of individual cell, although these cell may be
in any geometric shape, most CA adopts regular grids to represents such space, which
make CA very similar to the cellular structure of raster GIS
Cell states: the state of each cell may represent any spatial variable, e.g. the various
land-use type. The state transition of a CA is defined by the following relation:
The future state of a cell in CA is dependent on its current state, neighborhood
states, and transition rules which are setup and fine-tuned using transition suitability
or potential score of individual cells. Iterative local interaction between cell within
the neighborhood finally produce the global pattern.
Simulation of land use changes is important for a variety of planning and
management issues as well as for academic research. It can provide the baseline
growth scenario to show the future land development pattern when the current land
development process continues into the future. The simulation of land use changes
can help to assess development impacts, prepare land use plans, and seek optimal
land use patterns. It can forecast the consequences of specific human behavior and
land use policies. It can also identify the possibility of severe land use problems, such
as the encroachment on important environmental areas, including croplands and
wetlands. Strict land use zoning may be required to prevent the potential land use
problems identified by the simulation. The simulation of land use changes will enable
planners to provide the public with necessary facilities and services to sustain the
development (White et.al 2000).
The rapid development of GIS helps to foster the application of CA. Some
researches indicate that cell-based GIS may indeed serve as a useful tool for
implementing cellular automata models for the purposes of geographical analysis
(Itami, 1994). It is amazing to see that real land suitability can be modeled based on
III.
METHODOLOGY
3.1. Time and Location
The research was conducted from February to May 2011. The area concerns
in Kupang District, East Nusa Tenggara. It is bounded between longitude
The topographical conditions of Kupang District are almost dominated by the
elevation between 0-100 meters above sea level covering almost half the area of
Kupang District (24 sub districts). Some sub districts are at an elevation of 100 to
1000 m above sea level (asl). Several sub districts in the area of Amfoang for
example be between 500 - 1000 above sea level, and some areas such as Semau, West
Kupang and Nekamese had altitude 0-100m asl. Based on the state of rock, in
Kupang District the dominant soil type alluvial, regosol, andosol, glei humus,
mediterranean red yellow, latosol, podzolic red yellow and rendzina. This soil texture
are from fine to coarse.
This district has dry climates and according to Oldemam divide to type D4,
and E4, this climatic conditions has very short wet season of 3-5 months, while the
dry season of 7-8 months. Short wet season occurs only in December to March.
These climatic conditions are certainly affects the pattern of cultivation and farming
communities in Kupang District where 3% of the area is a dry rice field soil and 97%
is dry soil in the yard or swidden cropping (Piggin, 2003).
3.2. Data Sources
The data Mainly has been used for this research acquired from government
institution, as in the table below
Table 4 Data Type and Sources
No Data and Information Type Sources
1 Base map of Kupang Vector BAKOSURTANAL
2 Geology Database Vector BPDAS N-B Kupang
3 Climate data Vector, Tabular BMG Kupang, NOAA
4 Supported data Tabular BPS Kupang
3.3 Tools Requirements
The processing data of this research was done at laboratory of Master of
Science in Information Technology for Natural Resources Management (MSc in IT
for NRM) at SEAMEO BIOTROP. Supporting software were used in this research
are listed below.
Table 5 Supporting Software
No. Tools Functions
1. Microsoft Office Documentation
2. ArcGIS 9.3 Spatial Analysis Process
3. Microsoft Visual Studio 2008 Model Simulation
4. ArcGIS Engine 9.3 Model Simulation
3.4 Methodology
There are some important stages of working with our data: the first one is data
preparation and entry in which data about the study area is collected and prepared to
be entered and/or used into the system, data analysis and the last part is a model
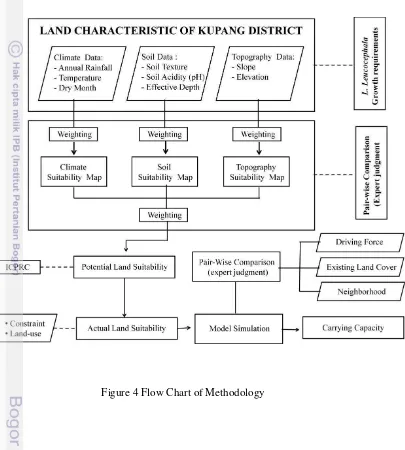
simulation (Figure 5). To build the model, different processes have been conducted.
Figure 4 are the criteria to be fulfilled in order to reach the objective which is to
identify the land suitability for growth of L.leucocephala in Kupang District and to
determine the carrying capacity to support feed security.
3.4.1 Determine Goal and Objectives
Goals and objectives to be achieved is obtained through a method of
interviewing and filling questionnaires by experts who are competent in the field of
their own. The questions raised are expected to provide important input in
determining land suitability class. In order to reach the goal, there are some sets of
objective that also should be considered as stated follows:
· What are the more important factors between criteria (climate, soil and topography) and sub-criteria for obtaining the land suitability for growth of
· What factors are a greater influence in determining the proper location for the development of L.leucocephala, such as how much influence the one driving
[image:42.612.95.500.151.601.2]force compare one to another driving force.
3.4.2 Spatial Analysis and Analytical Hierarchy Process for Determining
Potential Land Suitability
Assessment of land potential is often done with agro-ecological zone
approach with the physical environment as a supporting and limiting factors for
planting of a commodity plant at a specific region. If only this approach, then the
only plant zoning based on land capability class is not consider other factors such as
social, economic and cultural. It is therefore necessary developed a method that can
include all the factors affect plant zoning. In this research used the stages modified
from agro-ecological zoning method to include attractiveness elements (driving
forces) and constraints.
Prior to conducting the analysis to every stage, were first carried out
weighting based on expert judgment that is very competent in this field. Analysis of
agro-ecological zones; this analysis was based on suitability to grow of
L.leucocephala on the condition of the physical environment consisting of climate,
soil, and topography of the region. Analysis of the attractiveness (driving force) of
this space were analyzed the results of agro-ecological zoning by adding a factor of
closure, roads, livestock market and the existing land use, like a folk forest, protected
forest, protected area, produced forest, industry area, water body, and wetland
farming.
Land suitability criteria used in this research based on the Second Land
Resources Evaluation and Planning Project (LREP II) in 1994; where the system
itself refers to the land suitability criteria issued by FAO (1976). According to the
basic concept of Land Evaluation Framework (FAO, 1976) the land suitability was
distinguished on the physical land suitability (qualitative) and land suitability in the
economic (quantitative). Land suitability was physically divided into 4 classes,
namely: highly suitable (S1), moderately suitable (S2), marginally suitable (S3), and
is not suitable (N). While economically differentiated into 5 classes, namely: Class 1
is very suitable (S1), its use is very profitable; Class 2 moderately suitable (S2), its
use is beneficial; Class 3 according to the marginal (S3) use the marginal benefit;
and by improving the management to raise its class, Class 5 is not as permanent,
economically (N2) usage is not possible, and this class is physically derived from the
class N. Predicting the suitability of land for agricultural commodities are necessary
criteria for land suitability class of the most suitable (S1) to inconsistent (N). The
criteria for land suitability of L.leucocephala shows on Table 6.
Table 6 Criteria for Land Suitability of L.leucocephala (LREP II 1994; FAO, 1976)
Quality/ land characteristics
Land Suitability Classification
Unit S1 S2 S3 N1 N2
Annual Temperature
(oC) 21-30 >30-34 19-<21
- -
- >34 <19 Annual Rainfall (mm) >750-1000 >1000-2000
600-<750
- - >2000 <600 Texture L, SCL, SiL, Si,
CL, SC, SiCL
LS, SL, SiC, C
Massif Clay, Str C
- Gravel, Sand Effectiveness
Depth
weight distribution is more objective than setting the weight for individual factors.
The steps of the analysis are described as follows:
A. Establishment of the Hierarchical Structure.
After the final goal of establishing the hierarchical framework is achieved, a
mutually independent hierarchical relationship is built by interviewing experts
and doing surveys (secondary goal), and analyzing the elements that might
affect the secondary goal. The elements of similar importance are collected on
the same level in this step.
B. Weight between the Elements on Different Levels
The calculation of the weight between the elements on different levels is
completed though the following four steps:
Ø Establishment of Pair-wise Comparison Matrix: The element
comparison is conducted in this step. The parent element of an element
on a lower level is used as an evaluation criterion for the pair-wise
comparison.
Ø Calculation of Priority Vector. Divided each comparison value by the
sum of the values in Corresponding fields for the aggregation of the
rows; namely, the sum of the percentage each comparison value
occupies in its corresponding row.
3.4.3 Calculation of Increasing Capacity Population of Ruminant Cattle
(ICPRC)
This analysis is used to determine cattle population cattle can be added in
every sub-district in Kupang District by calculate the availability of potential forage
using Rollinson and Nell, (1974) approach. Secondary data used is the data in year
2009 from BPS of Kupang District. Based on the results of data processing of
livestock population analysis with ICPRC model obtained a values show a different
trend for each region. ICPRC positive value indicates a tendency that relevant
districts still allow the addition of ruminant livestock population of the existing
number of livestock units, whereas negative values indicate a tendency ICPRC
concerned that the region needs to be directed to the development of the area of land
that is the carrying capacity of principal farm businesses, such as grassland and the
agriculture area. The potential forage capacities predicted as follows:
Total Potential Forage = Forage Production + Straw Production (Total)
= (Total Potential Forage, DM Tons / Year) (DM consumption Ton / AU / Year)
TFP = 3.75 ∑ + ∑
Where;
TFP = Total forage production of a district in one year (ton DM / year).
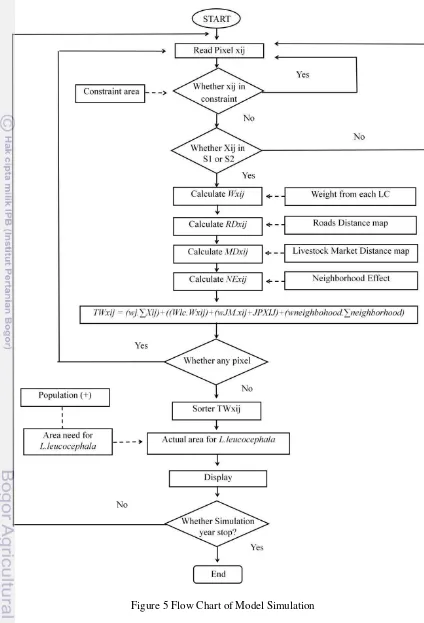
that can be set by the user using different assumptions or scenario. The simulation
model of L.leucocephala development are very influenced by 2 main factors, namely
driving force and constraint.
Driving force and constraints are the key factor in the of L.leucocephala
development context. Driving force can be defined as causes or factors influence for
L.leucocephala growth modeling. In this research, road network, animal market, and
Neighborhood Effect were selected as a driving force input in modeling of
L.leucocephala growth in Kupang District. Whereas, protected forest, folk forest,
protected area, production forest, industry area, wet land farming, swamp, weir/ water
body, settlement and mining area were selected as a constraint factor in this study
area.
Driving force of L.leucocephala can be simply defined as cause for factors
influence for growth modeling and in the opposite, whereas constraint is a limitation
imposed or by nature or by human being that do not permit certain action to be taken
(Keeney, 1980). Definition for each driving force and constraints for L.leucocephala
development in this study was explained below:
A. Neighborhood Effect
Location has very large influence on the growth development of
L.leucocephala. at a small scale, L.leucocephala tends to growth in the areas
nearby the development agriculture area. Neighborhood, in another word,
transition from non- L.leucocephala to L.leucocephala was much affected by
the adjacent area. if the vicinity of a cell is developed area, this cell has much
higher potential to change to L.leucocephala form if it was
non-L.leucocephala before.
the location from main roads, the land has higher probability to becoming
developed to other purposes then to growth L.leucocephala.
Transport is a very important role in the success of development especially in
support of economic activities, no exception in rural areas. Existing
transportation system intended to improve mobility services and other
resources that can support the growth of economics of rural areas. With the
hopes of transport can relieve isolation and provide a stimulant to the
development in all areas of life, whether trade, industry and other sectors in
rural areas.
C. Distance to Location of Livestock Market
The existence of animal market has a very important function in the
development of a suitable location for the planting of L.leucocephala. For
folk forest, produced forest, settlement, and wet land farming is not allowed to
develop the L.leucocephala growth area.
There are two kinds of spatial default scenario that is designed to look at the
distribution pattern of L.leucocephala. The default scenario is:
1. Business as usual, in this scenario, the state is considered normal running as it
should.
2. Spatial plan as constraints, in this scenario mining site plans will be a
constraint.
Both the two scenarios mentioned above have default values in accordance
with the current state, but those values can be set in accordance with the needs to be
achieved.
Microsoft Visual Studio 2008 and ArcGIS Engine 9.3 is used to build
simulation models for prediction the feed security of L.leucocephala to support Bali
cattle during a certain period. The scheme of simulation model chart can be seen in
IV. RESULTS AND DISCUSSION
4.1 Spatial Analysis Results
Management of spatial data is essential in the Geographical Information
System data management. Geographic Information Systems (GIS) not only serves to
move / transform the map of conventional (analog) into digital form (digital map),
furthermore this system has the ability to process and analyze data based on
geographic location into valuable information. Spatial analysis in this research is
overlaying process of the spatial data based on certain criteria. Those criteria are
taken from literature and interview data with 8 (eight) experts from BPTP
(Assessment Institute for Agricultural Technology), Indonesian Agriculture Ministry.
The spatial analysis resulted in three most suitable candidate areas for developing
Leucaena leucocephala based on growth suitability from climate, soil and
topography. At the last spatial plan is used for a criterion to avoid using the restricted
area to plantation L.leucocephala. The most suitable condition for growth of
L.leucocephala based on climate, soil and topography are listed below:
Table 7 Physical requirement for growth factors of L. leucocephala
Climate factors Soil factors Topography factors
Temperature (oC)
Annual Rainfal
l (mm)
Dry Months
Texture Soil Acidity (pH) Effective Depth (cm) Slope (%) Altitude (m asl)
21-30 >750-1000
3 - 4
L, SCL, SiL, Si, CL,
SC,SiCL
7.0-8.0 >100 < 8 0 - 750
4.1.1 Climate Suitability
Climate factor is one of the physical and environmental factors that affect the
quality and quantity of growth and development. This factor needs to get a specific
study, because the climate variables are a variable that cannot be given treatment or
4.1.1.1 Temperature Suitability
4.1.1.2 Annual Rainfall Suitability
Most species of Leucaena leucocephala grow in their native range in
seasonally dry forest. Mean annual precipitation and length of dry season vary across
species from 550-700 mm with 7 month dry season. Most species lie in between with
annual rainfall 750-1500mm and dry season of 4-5 months (Karachi et al, 1997).
L.leucocephala does not perform well in drier environments, with less than 650 mm
4.1.1.3 Dry Months
The long period of dry months is closely linked to the availability of water
during the dry season, water is essential to plant. To survive, plants need water, as
well as nutrients, which are absorbed by the roots from the soil. Plants containt 90
percent water. Water is transported throughout the plant almost continuously to keep
its vital processes working. Roots absorb water from the soil, which is then carried
through the plant. Much of the water is taken up through the root hairs, which are tiny
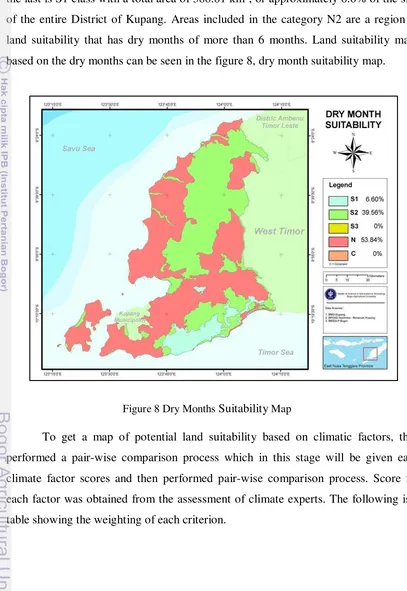
Kupang District or an area of 2,763.7 km2 obtaining land suitability value N2, the
second sequence followed by the S2 class at 39.56% or an area of 2,032.37 km2, and
the last is S1 class with a total area of 388.81 km2, or approximately 6.6% of the size
of the entire District of Kupang. Areas included in the category N2 are a region of
land suitability that has dry months of more than 6 months. Land suitability maps
based on the dry months can be seen in the figure 8, dry month suitability map.
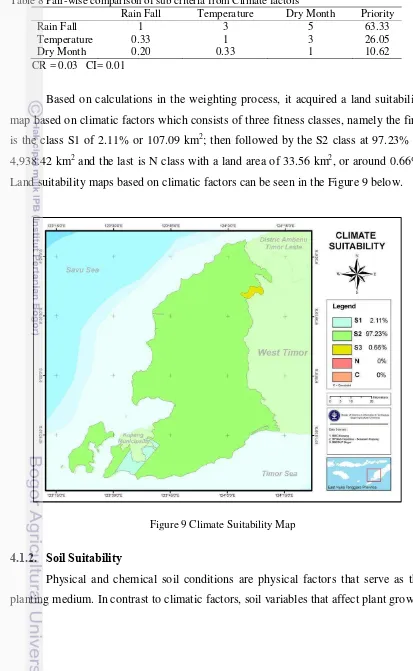
To get a map of potential land suitability based on climatic factors, then
performed a pair-wise comparison process which in this stage will be given each
climate factor scores and then performed pair-wise comparison process. Score for
each factor was obtained from the assessment of climate experts. The following is a
[image:57.612.107.514.135.726.2]table showing the weighting of each criterion.
Table 8 Pair-wise comparison of sub criteria from Climate factors
Rain Fall Temperature Dry Month Priority
Rain Fall 1 3 5 63.33
Temperature 0.33 1 3 26.05
Dry Month 0.20 0.33 1 10.62
CR = 0.03 CI= 0.01
Based on calculations in the weighting process, it acquired a land suitability
map based on climatic factors which consists of three fitness classes, namely the first
is the class S1 of 2.11% or 107.09 km2; then followed by the S2 class at 97.23% or
4,938.42 km2 and the last is N class with a land area of 33.56 km2, or around 0.66%.
and development can be given a treatment that can alter soil conditions to conform to
the requirements of growth and development of plants. Soil treatment is relatively
more efficient than modifications to the climate.
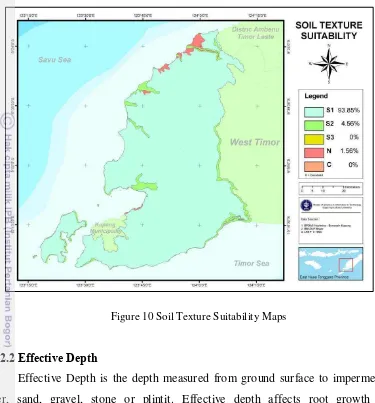
4.1.2.1 Soil Texture
Soil texture shows a comparison of the relative fraction of clay, dust and sand.
This property affects the water binding capacity, cation exchange capacity, porosity,
infiltration, hydraulic conductivity and soil aeration. Indirectly, soil texture affects
root growth.
Based on the results of spatial data processing, Kupang District divided into 3
categories of soil texture suitability namely N, S1, and S2. At least 93.85% of
Kupang District or an area of 4,837 km2 obtaining land suitability value S1, the
second sequence followed by the S2 class at 4.56% or an area of 235.23 km2, and the
last is N class with a total area of 81.7 km2, or approximately 1.56% of the size of the
entire District of Kupang. Areas included in the category N are a region of land
suitability that has sandy or gravels land. Land suitability maps based on the soil
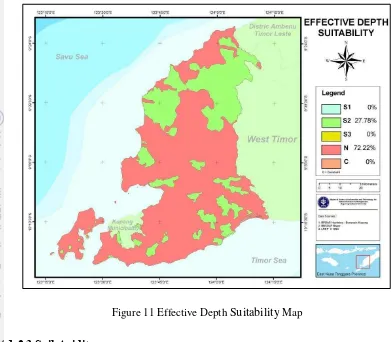
4.1.2.2 Effective Depth
Effective Depth is the depth measured from ground surface to impermeable
layer, sand, gravel, stone or plintit. Effective depth affects root growth and
development of L.leucocephala. Soils with a shallow effective depth of root cause
inhibition of growth of plants, otherwise the soil with an deep effective depth of the
shall have good aeration and drainage, and able to support the development of roots
and plant it better.
[image:60.612.103.478.79.482.2]
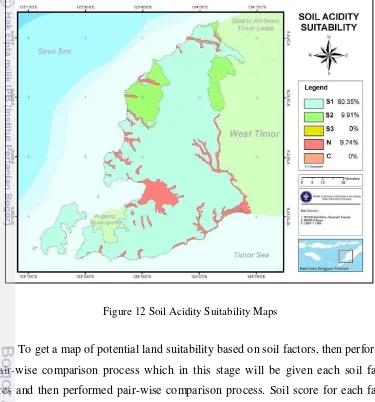
4.1.2.3 Soil Acidity
Leucaena leucocephala is known to be intolerant of soils with low pH, low P,
low Ca, high salinity, high aluminum saturation and water logging (Brewbeker, 1987)
and has often failed under such condition (Hutton, 1981, Oakes and Foy, 1984,
Brewbeker, 1987; Shelton, 1994; Blemmy and Hutton (1995). The possible
approaches to use of L.leucocephala on acid soil were reviewed by Hutton (1995) and
Blemmy and Hutton (1995) who conclude that high production is not possible
without significant selection and breeding. Recent testing of a wide range of species
and seed sources has confirmed the poor survival and low acid soil tolerance of
L.leucocephala species in several sites in Asia (Khoa et al., 1997; Castillo et al.,
1997)
Based on the results of spatial data processing, Kupang District divided into 3
categories of land suitability namely N, S1 and S2. At least 80.35% of Kupang
[image:61.612.114.505.82.424.2]sequence followed by the S2 class at 9.91% or an area of 521.13 km2, and the last is
N class with a total area of 512.24 km2, or approximately 9.74% of the size of the
entire District of Kupang. Areas included in the category N are a region of land
suitability that has pH value less than 4. Land suitability maps based on the
temperature can be seen in the Figure 12.
To get a map of potential land suitability based on soil factors, then performed
a pair-wise comparison process which in this stage will be given each soil factor
[image:62.612.103.478.201.603.2]Table 9 Pair-wise comparison of sub criteria from Soil factors
Texture pH Effective Depth Priority
Texture 1 0,3 1 22.90
pH 2 1 5 60.08
Effective Depth 2 0,20 1 17.02
CR = 0.04 CI=0.08
Based on calculations in the weighting process, it acquired a land suitability
map based on soil factors which consists of three fitness classes, namely the first is
the class S1 of 78.29% or 3,976.18 km2; then followed by the S2 class at 12.09% or
613,93km2 and the last is N class with a land area of 488.71 km2, or around 9.62%.
Land suitability maps based on soil suitability factors can be seen in the figure below.
4.1.3 Topography Suitability
Compliance is assessed on the basis of topographic height of a place of sea
level and slope factors are calculated based on the interval contour lines. Elevation
somewhere correlated with average air temperature.
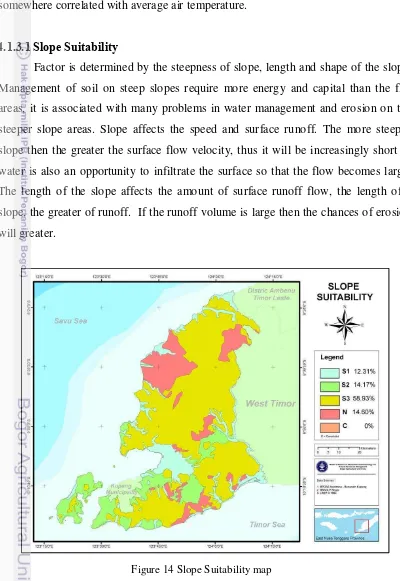
4.1.3.1Slope Suitability
Factor is determined by the steepness of slope, length and shape of the slope.
Management of soil on steep slopes require more energy and capital than the flat
areas, it is associated with many problems in water management and erosion on the
steeper slope areas. Slope affects the speed and surface runoff. The more steep a
slope then the greater the surface flow velocity, thus it will be increasingly short of
water is also an opportunity to infiltrate the surface so that the flow becomes large.
The length of the slope affects the amount of surface runoff flow, the length of a
slope, the greater of runoff. If the runoff volume is large then the chances of erosion
[image:64.612.87.487.149.730.2]The length and slope index can be determined by measuring the density of
contour lines per unit length. Various types of soil have different erosion sensitivity.
Soil content that affect the sensitivity of soil erosion in the nature of that influence
infiltration rate, permeability, water holding capacity, soil characteristics that affect
the resistance of soil structure on the dispersion and erosion by rain falls and runoff
water.
Based on the results of spatial data processing, Kupang District divided into 4
categories of land suitability class namely S1, S2, S3 and N. At least 58.93% of
Kupang District or an area of 3,026.6 km2 obtaining land suitability value S3, the
second sequence followed by the S2 class at 14.17% or an area of 727.57 km2, then
followed by S1 class at 12.31% or an area 632.15 km2 and the last is N class with a
total area of 749.9 km2, or approximately 14.6% of the size of the entire District of
Kupang. Areas included in the category N are a region of land suitability that has a
slope more than 30 percent. Land suitability maps based on the temperature can be
seen in the Figure 14.
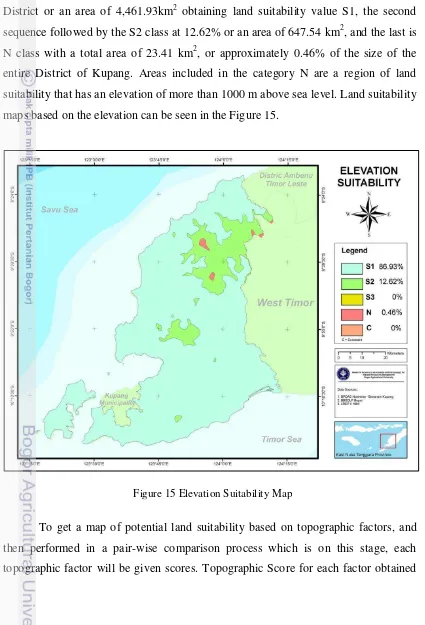
4.1.3.2 Elevation Suitability
The elevation of a place is affected the air temperature and intensity of light
received by plants. The higher a place, have lower in temperature of that place,
similarly, the intensity of the sun will be minor. Temperature and radiation is what
will be used to classify plants according to what the highlands or lowlands. Elevation
also is critical of flowering plants, plants grown in the lowlands bloom earlier than
those grown in highlands. Environmental factors will affect physiology processes in
plants. All physiology process temperature may be affected and some processes will
depend on the light. The optimum temperature required for plants can be best utilized
by plants. Temperatures that are too high will inhibit plant growth and vice versa too
Based on the results of spatial data processing, Kupang District divided into 3
categories of land suitability class namely N, S1, and S2. At least 86,93% of Kupang
District or an area of 4,461.93km2 obtaining land suitability value S1, the second
sequence followed by the S2 class at 12.62% or an area of 647.54 km2, and the last is
N class with a total area of 23.41 km2, or approximately 0.46% of the size of the
entire District of Kupang. Areas included in the category N are a region of land
suitability that has an elevation of more than 1000 m above sea level. Land suitability
[image:66.612.82.507.122.747.2]from the assessment of experts. The following is a table showing the weighting of
each criterion.
Table 10 Pair-wise comparison of sub criteria from Topography factors
Slope Elevation Priority
Slope 1 3 76.9
Elevation 0,3 1 23.1
CR = 0.00 CI=0.00
Based on calculations in the weighting process, it acquired a land suitability
map based on topographic factors which consists of three fitness classes, namely the
first is the class S1 of 12.21% or 620.33 km2; then followed by the S2 class at
73.09% or 3712.20 km2 and the last is N class with a land area of 746.73 km2, or
around 14.70%. Land suitability maps based on soil factors can be seen in the figure
[image:67.612.106.531.318.689.2]below.
4.2 Potential Land Suitability for Development of Leucaena leucocephala
The Land Suitability Analysis is a Geographic Information Systems (GIS)
based tool for evaluating the relative suitability of land for development in Kupang
District, East Nusa Tenggara Province. The end product is a generalized map
showing areas of the district that are categorized as having either least, not suitable
(N), suitable (S1), moderate suitable (S2) and marginal suitable (S3) for development
of L.leucocephala. The following is a table that contains the pair-wise