DETERMINATION OF AGRICULTURAL POTENTIAL AREA
BASED ON LAND SUITABILITY AND REVENUE-COST
ANALYSIS
Case study in Bantul Regency, Yogyakarta
ARRY AGUNG HANANTO
GRADUATE SCHOOL
DETERMINATION OF AGRICULTURAL POTENTIAL AREA
BASED ON LAND SUITABILITY AND REVENUE-COST
ANALYSIS
Case study in Bantul Regency, Yogyakarta
ARRY AGUNG HANANTO
A Thesis submitted for the degree of Master of Sciences of Bogor Agricultural University
MASTER OF SCIENCE IN INFORMATION TECHNOLOGY
FOR NATURAL RESOURCES MANAGEMENTGRADUATE SCHOOL
Research Title : Determination of Agricultural Potential Area Based on Land Suitability and Revenue Cost Analysis. Case study in Bantul Regency, Yogyakarta
Name : Arry Agung Hananto
Student ID : G.051040161
Study Program : Master of Science in Information Technology for Natural Resources Management
Approved by, Advisory Board
Dr. Ir. Hartrisari Hardjomidjojo, DEA Ir. M. Arief Syafi’i, M.Eng.Sc Supervisor Co-supervisor
Endorsed by,
Program Coordinator Vice Dean of the Graduate School
Dr. Ir. Tania June, M.Sc Prof. Dr. Ir. Khairil A. Notodiputro, M.S
i
STATEMENT
I, Arry Agung Hananto, here by stated that this thesis entitled:
Determination of Agricultural Potential Area Based on Land Suitability and Revenue Cost Analysis
(Case Study in Bantul Regency, Yogyakarta)
is result of my own work during the period of May until November 2006 and that
it has not been published before. The content of the thesis has been examined by
the advising committee and external examiner
Bogor, February 2007
ii
ACKNOWLEDGMENT
There area many people I should thank in regard to this work and so doubt I
will not be able to name them one by one. To these I would beg forgiveness. I
wish to thank to:
1. Dr. Hartrisari Hardjomidjojo, DEA and Ir. M. Arief Syafi’i, M.Eng.Sc as my
supervisor and co-supervisor for their guidance, technical comments and
constructive criticism through all month of my research.
2. BAKOSURTANAL for financial support during two years of my study.
Without this support, this research would not be possible.
3. SEAMEO-BIOTROP management and staff, and also IPB post graduate
directorate that support our administration, technical and facility.
4. Our lecturer from IPB and all other lecturer from BAKOSURTANAL, ITB
and BPPT, who taught us the very important knowledge for our future.
5. My friends in MIT, I really appreciate our togetherness, and how we support
each other to finish our study in MIT.
6. My wife Irma Novitasari for her moral support and patience during
accompany in my study.
7. And ‘Ndut’ (Najla Lulu Nuraini), which was her naughtiness, could entertain
me during my study.
I dedicated this thesis to Bantul Regency local government, my office
BAKOSURTANAL, and my country Indonesia. I hope this thesis can give a
value for developing of agricultural area in Indonesia especially in Bantul
CURRICULUM VITAE
Arry Agung Hananto was born in Malang, East Java,
Indonesia, at January 26, 1965. He received his
Engineer Diploma in Agriculture from Faculty of
Agriculture, Bogor Agricultural University, Bogor in
1988. From 1989 till now he has been working for
National Coordinating Agency for Surveys and Mapping (BAKOSURTANAL),
Cibinong Bogor, West Java.
In 2004, Arry Agung Hananto received a financial support from the Center
for Marine Natural Resource Surveys – BAKOSURTANAL to pursue his
graduate study. His thesis entitled “Determination of Agricultural Potential Area
Based on Land Suitability and Revenue Cost Analysis (Case study in Bantul
Regency)”.
ABSTRACT
ARRY AGUNG HANANTO (2007). Determination of Agricultural Potential Area Based On Land Suitability and Revenue Cost Analysis, A Case Study of Bantul Regency Yogyakarta Province. Under the supervision of HARTRISARI HARDJOMIDJOJO and M. ARIEF SYAFI’I.
Nowadays, the population of the world is growing dramatically. Under present situations, where the land is a limiting factor, it is impossible to bring more area under cultivation (extensive farming), so farming community should tackle this challenge of producing more and more food with the available land only (intensive farming).
Bantul regency which one of the food source in Yogyakarta has undergone rapidly tremendous economic growth during last few years. This condition caused the decreasing of agricultural areas to industrialized, tourism and settlement areas.
The objective of this research is to explore the geographic information systems on defining potential agricultural area based on land suitability and revenue cost analysis in Bantul Regency.
Land suitability analysis is a prerequisite for sustainable agricultural production. It involves evaluation of the criteria ranging from soil, terrain to socio-economic, market and infrastructure. Many of these factors are vaguely defined and characterized by their inherent vagueness. Multicriteria decision-making techniques like weighting, ranking, rating etc. are employed for suitability analysis. Simple Additive Weighting (SAW) or Weighted Linear Combination (WLC) is the most often used technique in multi-criteria decision making. As this process incorporates expert knowledge and judgment by decision makers at various levels, it is very much subjective in nature. Revenue cost analysis is needed in this research for determining agricultural potential area, in order to get the maximum benefit out of the land in the research area which had several land suitability level of several crops.
The result of this research showed how land suitability and revenue cost analysis approach were very useful to determine the agricultural potential area in Bantul Regency. The agricultural potential area consists of potential area for corn, rice, soybean, and peanut.
Keyword: Agricultural Potential Area, Land Suitability, Revenue Cost Analysis, GIS
v
TABLE OF CONTENTS
STATEMENT ... i
ACKNOWLEDGMENT... ii
CURRICULUM VITAE ... iii
Table of Contents ... v
1.5. Thesis Structure... 5
II. LITERATURE REVIEW... 6
2.1. Land Suitability... 6
2.2. Need for Land Suitability Analysis... 6
2.3. Land Suitability Analysis... 7
2.4. Geographical Information Systems (GIS)... 7
2.5. Remote Sensing... 10
2.5.1. Definition of Remote Sensing... 10
2.5.2. Digital Image Processing ... 11
2.5.3. Geometric Correction... 12
2.5.4. Radiometric Correction... 13
2.5.5. Supervised Classification ... 13
2.6. Role of GIS and Remote Sensing ... 14
2.7. Weighted Method Analysis... 15
2.7.1. Simple Additive Weighting ... 15
III. RESEARCH METHODOLOGY... 17
3.1. Description of Research Area ... 17
3.2. Research Materials and Tools ... 18
3.3. Research Methodology ... 19
3.3.1. Data Collection ... 19
3.3.2. Data Preparation... 19
3.3.3. Spatial Processing and Analysis ... 25
vi
4.4. Temperature Map ... 35
4.5. Rainfall Map ... 38
4.6. Overlay Process and Weighting Analysis ... 41
4.7. Agricultural Potential Area ... 49
V. CONCLUSION AND RECOMMENDATION ... 54
5.1. Conclusion ... 54
5.2. Recommendation ... 55
vii
LIST OF TABLES
Table 3.1. Data Requirement ... 18
Table 3.2. The human factor value from expert for Environmental factors ... 26
Table 3.3. Factor and Class value of Overlay Weighted Method ... 26
Table 4.1. Land Suitability Area for Corn on the Existing Condition ... 43
Table 4.2. Land Suitability Area for Mungbean on the Existing Condition ... 45
Table 4.3. Land Suitability Area for Peanut on the Existing Condition ... 46
Table 4.4. Land Suitability Area for Rice on the Existing Condition... 48
Table 4.5. Land Suitability Area for Soybean on the Existing Condition ... 49
Table 4.6. Ratio Revenue-Cost Comparison of Commodities... 51
viii
LIST OF FIGURES
Figure 3.1. Map of Bantul Regency ... 17
Figure 3.2. Scheme / flowchart of the research... 20
Figure 3.3. Description of Image Processing ... 21
Figure 3.4. Generating of Slope Process... 22
Figure 3.5. Generating Temperature Map... 23
Figure 3.6. Digitizing Soil Map ... 24
Figure 3.7. Digitalizing Rainfall Map ... 24
Figure 4.1. Land Use Map of Bantul Regency... 29
Figure 4.2. Land Map Unit of Bantul regency. ... 30
Figure 4.3. Suitability map of Land Map Unit for each crop... 31
Figure 4.4. Slope class suitability map for Corn... 32
Figure 4.5. Slope class suitability map for Rice... 33
Figure 4.6. Slope class suitability map for Mungbean... 33
Figure 4.7. Slope class suitability map for Soybean ... 34
Figure 4.8. Slope class suitability map for Peanut ... 34
Figure 4.9. Temperature suitability map for Peanut ... 35
Figure 4.10. Temperature suitability map for Corn ... 36
Figure 4.11. Temperature suitability map for Mungbean ... 36
Figure 4.12. Temperature suitability map for Rice ... 37
Figure 4.13. Temperature suitability map for Soybean ... 37
Figure 4.14. Water available suitability map for Mungbean ... 38
Figure 4.15. Water available suitability map for Rice ... 39
Figure 4.16. Water available suitability map for Corn... 39
Figure 4.17. Water available suitability map for Peanut... 40
Figure 4.18. Water available suitability map for Soybean... 40
Figure 4.19. Land Suitability Area for Corn in Bantul Regency ... 42
Figure 4.20. Land Suitability Area for Corn on existing condition in Bantul Regency... 42
Figure 4.21. Land Suitability Area for Mungbean in Bantul Regency ... 44
Figure 4.22. Land Suitability Area for Mungbean on existing condition in Bantul Regency... 44
Figure 4.23. Land Suitability Area for Peanut in Bantul Regency ... 45
Figure 4.24. Land Suitability Area for Peanut on existing condition in Bantul Regency... 46
Figure 4.25. Land Suitability Area for Rice in Bantul Regency... 47
Figure 4.26. Land Suitability Area for Rice on existing condition in Bantul Regency... 47
Figure 4.27. Land Suitability Area for Soybean in Bantul Regency ... 48
Figure 4.28. Land Suitability Area for Soybean on existing condition in Bantul Regency... 49
Figure 4.29. Land Suitability Area for Crop on existing condition in Bantul Regency... 50
ix
LIST OF APPENDIX
Appendix 1. Land Suitability Criteria for Corn (Zea mays)……….58 Appendix 2. Land Suitability Criteria for Mungbean (Phaseolus radiatus LINN)
………...59 Appendix 3. Land Suitability Criteria for Peanut (Arachus hypogea) ………….60 Appendix 4. Land Suitability Criteria for Rice (Oryza sativa)……….61 Appendix 5. Land Suitability Criteria for Soybean (Glycine maximum)………..62 Appendix 6. Average Yearly Rainfall in Yogyakarta Province……….63 Appendix 7. Average of Revenue Cost Analysis for Corn in Bantul Regency...64 Appendix 8. Average of Revenue Cost Analysis for Mungbean in Bantul Regency
………..65 Appendix 9. Average of Revenue Cost Analysis for Peanut in Bantul Regency.66 Appendix 10. Average Revenue Cost Analysis for Rice in Bantul Regency...….67 Appendix 11. Average of Revenue Cost Analysis for Soybean in Bantul Regency
1
I. INTRODUCTION
1.1. Background
Agriculture, being the most primitive profession of the civilized society,
draws much on its development starting from shifting cultivation to advanced
precision farming. With the advancement in the civilization, people came to
know about more crops and started to cultivate many crops. Population increase
and advancement in the civilization made man to settle at one place and to
cultivate the same area year after year. Now, agriculture became a profession is
given the name commercial agriculture, and precision agriculture and sustainable
agriculture as being the part of it.
Nowadays, the population of the world is growing dramatically. In order to
meet the increasing demand for food, the farming communities have to produce
more and more their agricultural yields to meet the food demand. Under present
situations, where the land is a limiting factor, it is impossible to bring more area
under cultivation (extensive farming), so farming community should tackle this challenge of producing more and more food with the existing available land
(intensive farming).
The importance of land as a resource cannot be overemphasized. Land
issues have become a concern not only locally or nationally but also globally.
There are several agenda of international conferences and treatises that have
placed land at the center of development issues. They have underscored the fact
2
promoting food security, advancing social equity and improving economic
growth.
However, latter the current technologies have the potential to increase the
productivity of food production and profit. One of the technologies is by using
geographical analysis of land resource base, to analyze suitable land area for
agricultural crops. By selecting the crop that should be planted on the area that is
most suitable for that crop, it is expected the higher productivity and profitability
can be achieved.
Land suitability is a function of crop requirements, climate and soil/land
characteristics. Matching the land characteristics and climate with the crop
requirements gives the suitability. So, suitability is a measure of how well the
qualities of a land unit match the requirements of a particular form of land use
(FAO, 1976). Besides all factors above; socio-economic, market and
infrastructure characteristics are the other driving forces that can influence the
crop selection.
Land suitability information alone is sometimes not enough, if we want to
involve in agricultural investment. Other problems will occur when one
investigated area fulfill land suitability criteria for several kinds of crops, for
instance one investigated area is suitable for corn, soybean and ground peanut. To
obtain the information about which crop that will give higher profit among others,
revenue cost analysis of each crop is needed and then crop, which has the higher
3
Revenue cost analysis is a method of comparing alternative by analyzing the
monetary income that each alternative would generate in relation to its cost. It
means that crops that have high revenue cost ratio, will give the high return.
1.2. Statement of the problem
Bantul regency in Yogyakarta province was area which had the wide
agricultural areas, so it could be said that Bantul Regency was one of food
producer area, especially for fulfilling the food demand in Yogyakarta province.
According to the data from Dinas Pertanian Bantul (Bantul Agricultural Office),
in Bantul Regency there were five kinds of crop that became superior
commodities. Those crops were corn, rice, mungbean, peanut, and soybean. The
superior commodities mean the crops that had the high yield compared with other
crops which were planted in Bantul Regency areas.
And as the area which located near the central of Yogyakarta province
capitol and tourism area of Yogyakarta city, Bantul regency which one of the food
source in Yogyakarta, has undergone rapidly tremendous economic growth during
last few years. This condition caused the decreasing of agricultural areas to
industrialized, tourism and settlement areas.
Therefore to maintain the sustainable agriculture sector and to increase the
farming community income in Bantul regency, its need the exact agricultural
operation by selecting the proper crop and land. Selecting proper crops means to
select the crop which would gave the highest income compared other crops; and
4
For getting the proper crop and land on agriculture operation, it is needed
the analyzing of land suitability and revenue cost for each superior crop.
1.3. Scope of Research
This study intended to integrate together remote sensing and GIS to
investigated the land suitability of superior commodity in Bantul Regency. The
criteria of land suitability which used in this research were based on Land
Suitability Criteria which was published by Center for Soil and Agro Climate
Research (Puslittanak) Bogor.
The investigated areas were not on all of Bantul Regency, but only on the
areas which from image classification were classified as areas that could be
operated as crop fields like rice field, dry land, grass and rice dependent of rain
filed.
In this research the revenue cost analysis was applied to monoculture
practice of agriculture operation.
1.4. Objectives
The aim of this research is to explore the geographic information systems on
defining potential agricultural area based on land suitability and revenue cost
analysis. More specific objectives are:
1. to provide information about potential area for a certain agricultural
crop in Bantul Regency using land suitability analysis, and
2. to determine the most potential area for a certain agricultural crop
5 1.5. Thesis Structure
This research work is explained in five chapters. In chapter 1 a brief
background is given to introduce the topic and raise preliminary issue on land
suitability and revenue cost. Statement of problem structures real condition issue
into a workable research topic.
Chapter 2 describes what available literature has said about land suitability,
Geographical Information System, remote sensing, role GIS and remote sensing,
and weighted method analysis. Chapter 3 describes how the research is conducted.
It first gives a profile of study area, which is Bantul Regency and to implement
the methodology thus developed. Chapter 4 presents analyze and discuss the
results thus obtained. Chapter 5 gives conclusions on the present study and
recommendations
6
2.
II. LITERATURE REVIEW
2.1. Land Suitability
Land suitability analysis is to estimate the environment condition in order to
determine the crop types that are suitable to be planted on a given area.
Generally, factors that can be considered for land suitability analysis are soil,
slope, climate, and water availability. Land suitability analysis is intended to
determine suitable land for cultivating specific crops or other utilization relating to
agricultural activities (FAO, 1976). Analysis of the criteria for land
characteristics should be done to get information on land suitability, usually by
conducting the land evaluation.
Land suitability is a description of compatibility level of a land for certain
utilization. Land suitability evaluation is related to evaluation for certain
utilization like rice, corn, etc.
Carter (1988) reported that land evaluation is only part of land use planning.
Its precise role varies in different circumstances. In the present context, it is
sufficient to represent the land use planning process by following generalized
sequence: recognition of a need for change, identification of aims, and selection of
a preferred use for each type of land, decision to implement, implementation and
monitoring of operation.
2.2. Need for Land Suitability Analysis
Land suitability analysis is needed for various purposes in the context of
7
The concept of sustainable agriculture or farming (SA / SF) involves
producing qualityproducts in an environmentally benign, socially acceptable and
economically efficient way (Addeo et al. 2001), i.e. optimum utilization of the
available natural resource for efficient agricultural production. In order to comply
these principles of SA one has to grow the crops where they suit best and for
which first and the foremost requirement is to carry out land suitability analysis
(Nisar Ahamed et al. 2000). So, land suitability analysis has to be carried out in
order to keep the sustainable agriculture.
2.3. Land Suitability Analysis
As stated above, land suitability is the ability of a given type of land to
support a defined use. The process of land suitability classification is the
evaluation and grouping of specific areas of land in terms of their suitability for a
defined use. The main objective of the land evaluation is the prediction of the
inherent capacity of a land unit to support a specific land use for a long period of
time without deterioration, in order to minimize the socio-economic and
environmental costs. Land suitability analysis is an interdisciplinary approach by
including the information from different domains like soil science, crop science,
meteorology, social science, economics and management.
2.4. Geographical Information Systems (GIS)
One of common geographical information system definition is a computer
base software/tool for collecting, storing, retrieving, transforming and displaying
8
from several diverse backgrounds such as computer-based mapping, database,
remote sensing, and design packages. As a result of this diverse background, GIS
have the ability to answer a number of spatial questions that are not possible or
very time consuming, using traditional methods.
A geographic information system is a power tool for handling spatial data
(Aronoff, 1991). Large quantities data of data can also maintained and retrieve at
greater speeds and lower cost per unit when computer-based systems are used.
The ability to manipulate the spatial data and corresponding attribute information
and to integrate different types of data in single analysis and at high speed is
unmatched by any manual method. The ability to perform complex spatial
analyses rapidly provides quantitative as well as qualitative advantages. Planning
scenarios, decision models, change detection and analysis, and other type of plans
can be developed by making refinements to successive analyses.
Geographic data are now identified clearly as that required for geographic
information systems. Many researchers claim that between 75% and 90% of
information used every day by most organizations are geographically based. For
planner and decision makers, geographic information is especially important. The
geographic information system (GIS) is one of the most powerful tools in
planning and decision making today (Juppenlazt and Tian, 1996).
A geographical information system has four functional components (Marble
& Amundson, 1988):
- A data input subsystem: collect and/or processes spatial data derived
from sources, such as existing maps, remote sensed data and direct
9
- A data storage and retrieval subsystem: organizes spatial data in a
topologically structured form, which permits it to be quickly retrieved on
the basis of either spatial or non spatial queries for subsequent
manipulation, analysis or display
- A data manipulation and analysis subsystem: performs a number of
tasks, such as changing the form of the data through user-defined
aggregation rules, or producing estimates of parameters for transfer to
external analytical type model.
- A data-reporting subsystem is capable of displaying all or selected
portions of the spatial database in terms of standard reports or in a
variety of cartographic formats.
The data input component converts data from their existing form into one
that can be used by a GIS.
Data to be entered in a GIS are of two types: spatial data and associated
non-spatial attribute data. Spatial data represent the geographic location of
features. Points, lines, and areas are used to represent geographic features. The
non-spatial attribute data provide descriptive information like the name of a street,
the salinity of a lake, or the composition of a forest stand. During data input the
spatial and attribute data must be entered and correctly linked (i.e. the attributes must be logically attached to the features they describe). Suitable verification
procedures are needed to check that data quality standards are met (Aronoff,
10
As most geographic information systems in the developing countries are
regional and resource and environment based, they are especially useful for
implementing the sustainable development strategy.
2.5. Remote Sensing
2.5.1. Definition of Remote Sensing
According to Juppenlantz and Tian (1996), remote sensing is technology
that collects data relating to the earth’s surface without contacting with it, through
a sensor mounted in a satellite or high-flying aircraft.
The Earth’s surface and atmosphere emit individual characteristic signatures
within the visible light and electromagnetic radiation spectrum. The spectrum is
divided into spectral bands ranging from short gamma rays to long radio waves.
The Earth Resources Technology Satellite (ERS-1, later renamed
Landsat-1), was the first unmanned satellite designed top provide systematic global
coverage of earth resources. Launched by the United States on July 23, 1972. It
was designed as an experimental system to test the feasibility of collecting earth
resource data from satellites (Aronoff, 1991).
The kind of Landsat that are useful for image interpretation for a much
wider range of applications is Landsat Thematic Mapper (TM). The characteristic
of Landsat Thematic Mapper (TM) which first loaded on Landsat 4 in 1982 was
designed to provide improved spectral and spatial resolution over the Multi
Spectral Scanner (MSS) instrument. Landsat TM is designed to capture
electromagnetic in 7 spectral bands. It has three bands in visible region (band 1,
11
and 7), and one in thermal infra red (band 6). Geometrically, TM data are
collected using a 30 m IFOV/ Instantaneous Field of View (for all but thermal
band which has a 120 m IFOV) (Lillesand and Kiefer, 1987).
2.5.2. Digital Image Processing
Digital image processing involves the manipulation and interpretation of
digital images with the aid of a computer. The central idea behind digital image
processing is quite simple. The digital image is fed into a computer one pixel at a
time. The computer is programmed to insert these data into an equation, or series
of equations, and then store the result of computation for each pixel (Lillesand and
Kiefer, 1987).
The procedures of digital image processing are following four broad types of
computer assisted operations: image rectification and restoration, image
enhancement, image classification, and data merging.
Image rectification and restoration are operations aiming at correcting
distorted or degraded image data, which stem from image acquisition; to create a
more faithful representation of original scene. The procedures of image
rectification and restoration consist of geometric correction, radiometric
correction, and noise removal.
Image enhancement is procedures that are applied to image data in order to
effectively display or record the data for subsequent visual interpretation. Steps
that most commonly applied digital enhancement technique can be categorized as
12
The objective of image classification is to replace visual analysis of the
image data with quantitative technique for automating the identification of
features in a scene.
2.5.3. Geometric Correction
Raw digital images usually contain geometric distortions so significant that
they cannot be used as maps. The geometric correction process is normally
implemented as two-step procedure. First, those distortions that are systematic, or
predictable, are considered. Second, those distortions that are essentially random,
or unpredictable, are considered (Lillesand and Kiefer, 1987).
As systematic distortions are constant and predicable they do not constitute a
problem to the user of satellite imagery. The agencies that supply the imagery do
the corrections. The main systematic distortions are: panoramic (or scanner)
distortion, scan skew, and change in scanning velocity (Meijerink, et.al., 1994).
Systematic distortion are well understood and easily corrected by applying
formulas derived by modeling the sources of the distortions mathematically.
Random distortions and residual unknown systematic distortions are corrected by
analyzing well-distributed ground control point s (GCPs) occurring in an image.
As with their counterparts on aerial photographs, GCPs are features of known
ground location that can be accurately located on digital imagery. Some features
that make good control points are highway intersections and distinct shoreline
13 2.5.4. Radiometric Correction
As with geometric correction, the type of radiometric correction applied to
any given digital image data set varies widely among sensors. Other things being
equal, the radiance measured by any given system over a given object is
influenced by such factors as changes in scene illumination, atmospheric
conditions, viewing geometry, and instrument response characteristics.
2.5.5. Supervised Classification
In image classification there are two classification technique kinds that
commonly known, Supervised classification and Unsupervised classification. The
fundamental difference between these techniques is that supervised classification
involves a training step followed by classification step. In the unsupervised
approach the image data are first classified by aggregating them into natural
groupings or clusters present in the scene (Lillesand and Kiefer, 1987).
In supervised classification this is realized by an operator who defines the
spectral characteristics of the classes by identifying sample areas (training areas).
Supervised classification requires that the operator be familiar with the areas of
interest. The operator needs to know where to find the classes of interest in the
area covered by the image. This information can be derived from general area
knowledge or from dedicated field observations (Janssen and Goerte, 2000).
Supervised classification is the procedure most often used for quantitative
analysis of remote sensing data. It rest upon using suitable algorithm to label the
pixel in an image as representing particular ground cover types, or classes. A
14
probability distribution of models for the classes of interest to those in which the
multi spectral space in partitioned into class-specific using optimally located
surfaces (Richards, 1993).
2.6. Role of GIS and Remote Sensing
GIS is a tool for input, storage and retrieval, manipulation and analysis, and
output of spatial data (Marble et al. 1984). GIS functionality can play a major role
in spatial analysis. Considerable effort is involved in information collection for
the suitability analysis for crop production. GIS has the ability to perform
numerous tasks utilizing both spatial and attribute data stored in it. It has the
ability to integrate variety of geographic technologies like GPS, Remote Sensing
etc. The ultimate aim of GIS is to provide support for spatial decisions making
process (Foote and Lynch 1996). In multi-criteria evaluation many data layers are
to be handled in order to arrive at the suitability, which can be achieved
conveniently using GIS.
Remote sensing provides information about the various spatial
criteria/factors under consideration. Remote sensing can provide us the
information like land use/cover, drainage density, topography etc. Many of the
non-spatial parameters can also be inferred by looking at the various spatial
parameters. Remote sensing in combination with GIS will be a powerful tool to
integrate and interpret real word situation in most realistic and transparent way.
Research by Leingsakul et al. (1993) showed that integrated GIS and remote
sensing technologies apart from saving time and yielding good data quality have
15 2.7. Weighted Method Analysis
The basis of this research is a classification problem in which class
definition is done through training samples for a particular class of interest. For
labeling samples, it is necessary to define all of the class’s existent in a given data
by collecting ground truth or existing data.
Typically multiple criteria have varying importance. To illustrate this,
each criterion can be assigned to a specific weight that reflects its importance
relative to other criteria under consideration. The weight value is not only
dependent the importance of any criterion, it is also dependent on the possible
range of the criterion values. A criterion with variability will contribute more to
the outcome of the alternative and should consequently be regarded as more
important than other criteria with no or little changes in their range. Weights are
usually normalized to sum up to 1, so that in a set of weights (w1, w2, w3, … wn),
∑ wi = 1. There are several methods for deriving weights, among them
(Malczewski, 1999): ranking, rating, pair wise comparison and trade-off.
The simplest way is the straight ranking (in order of preference: 1 = most
important, 2 = second most important, etc). Then, the ranking is converted into
numerical weights on a scale from 0 to 1, so that they sum up to 1
(http://journalofvision.org/2/1/6/).
2.7.1. Simple Additive Weighting
Simple Additive Weighting (SAW) or Weighted Linear Combination
(WLC) is the most often used technique in multi-criteria decision making (Fisher,
16
the product of weight and factor multiplied with all constraints at any location,
and then summing up all products yields a total overall score. The score for each
alternative A is:
A = SUM (wi * xi) or
A = SUM (wi * xi) * SUM (cj) if a constraint is part of the decision
xi = criterion score of factor i,
wi = weight of factor i,
3.
III. RESEARCH METHODOLOGY
3.1. Description of Research Area
The research area is located in Bantul Regency, Yogyakarta, Indonesia.
Geographically the area is located between 110° 12 34 - 110° 31 08 East, and
07° 44 04 - 08° 00 27 South. The breadth of Bantul Regency has an area of
about 50,685 Ha or 506.85 square km and consist of 17 (seventeen) districts.
Figure 3.1 shows a map of Bantul Regency.
Figure 3.1. Map of Bantul Regency
Topographically, most of Bantul areas are flat land and some parts are
infertile hilly areas. In western part, stretching from north to south is low and
some hilly lands of about 89.86 square km. The middle part is flat and low land,
but is fertile, covering about 210.942 square km. The eastern part varies from
low, undulated to steep areas covering about 206.05 square km. The southern
18
part, which is actually part of middle area, is sandy and lagoon area, from
Srandakan, Sanden, and Kretek Districts.
The area of Bantul is classified into wet tropical area. The wet season
occurs between November – April and the dry season between May – October. In
2004, it was recorded that the number of rainy days of 30 days happened in
January. But normally the highest average monthly rainfall occurs in December
of about 316 mm and the highest rainy days of 14 days.
3.2. Research Materials and Tools
The data used in this research consist of remotely sensed data, topographic
data, soil data, and climate data (Table 3.1). The tools are softwares that required
for image processing, spatial preparation process, and spatial analysis.
Table 3.1. Data Requirement
Data Description
River and seasonal river Relief
Vector and raster data Soil type in research area Landsat TM
Temperature in research area Data and distribution of rainfall
The tool/software that required consists of:
- ER Mapper 6.3 for image process
- Autodesk Map 5 for spatial preparation process
19
The hardware requirement for processing data at least has to fulfill the
specification: PC Pentium III, 256 MB RAM and 40 MB Hard disk.
3.3. Research Methodology
The procedures of this research consist of data compilation, data preparation,
spatial analysis, modeling approach, and data validation. The flowchart of
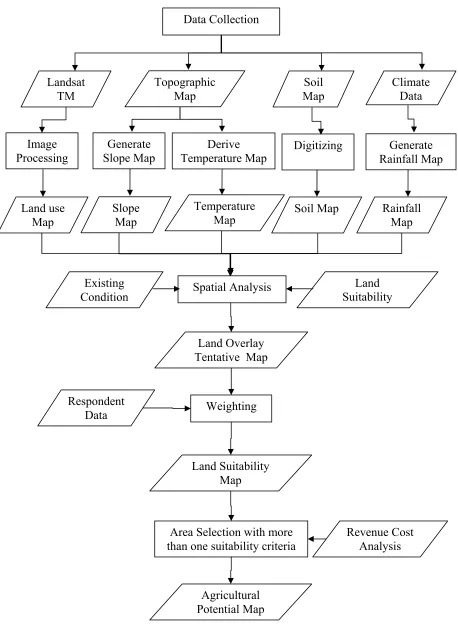
research procedure is represented in Figure 3.2.
3.3.1. Data Collection
The data input is collected from various sources, e.g.:
- Topographic data which is obtained from National Coordinating
Agency for Surveys and Mapping (BAKOSURTANAL),
- Information of soil type is derived from regional soil maps produced
by Center for Soil and Agro Climate Research (PUSLITANAK),
- Climate data were obtained from Bureau of Meteorology and
Geophysics (BMG) and Puslittanak Bogor,
- and Imagery data.
3.3.2. Data Preparation
1. Image Processing
The first step of data preparation is to process the satellite image of research
area, while the activities comprise of image processing and vector data processing
and analysis. In image processing the activities consist of identifying the data
source (coordinate system, format conversions), radiometric correction, geometric
Figure 3.2. Scheme / flowchart of the research
Tentative Map
Land Suitability Map Weighting
Area Selection with more than one suitabilitycriteria Existing
Condition Spatial Analysis
Land
Figure 3.3. Description of Image Processing
The image was then classified by using Supervised Classification technique
into several types of land uses. The classification processed was completed by
landuse data, which obtained from the Bantul local government.
One of main steps in image classification is the ‘partitioning’ of the feature
space. In supervised classification the process is realized by defining the spectral
characteristic of the classes by identifying sample areas (training areas). A sample
of a specific land use class like rice field, comprising of a number training pixels,
form a cluster in feature space.
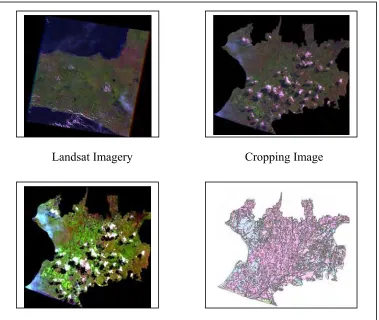
Classification Result Data Image Enhancement
Cropping Image Landsat Imagery
After that, all vector data required were extracted using spatial processing
software. The landuse data result will be used for the next spatial processing and
analysis steps.
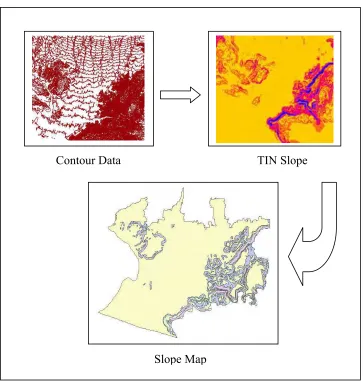
2. Generated Slope Map
The topographic data provide varying altitude of the research area. A slope
map was derived from the contour of topographic map and was classified into
several classes. The topographic data that used in this research were already in
digital format, so for generating slope map only took the contour data and
processing by 3D analysis tool in ArcGIS 9 application.
Figure 3.4. Generating of Slope Process Contour Data
Slope Map
TIN Slope
The slopes were classed or grouped depending on the rank that each crop
requires (this was done based on available literature). The detail slope class of
each crop can be seen in appendix.
3. Generated Temperature Map
Temperature data were required to determine the distribution of
temperature area. The temperature data was estimated using a formula with the
input of altitude polygon derived from altitude of topographic data. Same with
soil and altitude, plant need certain temperature condition to grow optimally. The
formula that is used to estimate the temperature data is the Braak formula, and
the equation is given below:
T = 26.3 °C – (0.01 * altitude in meters * 0.6 °C)
Contour Data Temperature Map
Braak Formula
Figure 3.5. Generating Temperature Map
In this case, temperatures were divided into 3 classes, based on the
limitation of the temperature that can influence to the growth of plants.
4. Soil Map Digitizing Process
Soil type data that was obtained from Puslittanak was a paper map. For
further process is needed to change the format of soil type data from hardcopy
data to digital. This process can be done by digitizing the paper map with
Autodesk Map 5 application, and then the digital data result will used for
analyzing process by using ArcGIS 9.
Figure 3.6. Digitizing Soil Map Digitized
5. Generated Rainfall Map
Rainfall map of investigated area was generated from digitized process of
rainfall map which was obtained from Puslittanak Bogor. Digitalizing process
was carried out by using Autodesk Map 5 and the result was used for next spatial
analyzing process.
Figure 3.7. Digitalizing Rainfall Map Digitalized
25 3.3.3. Spatial Processing and Analysis
1. Modeling Approach
There were several criteria involved to determine the growth factor.
Multiple criteria typically, have varying importance; each criterion can be
assigned to a specific weight that reflects how big each criterion influence to the
plant growth relative to other criteria. The principle of weighted method is to give
value to each factor, which influence to the land suitability for crops growth. The
value of factor can be divided into two kinds of value, they are environmental
factor value and human value. The environment factors consist of soil type, water
availability, slope, and temperature.
Each crop, which will be investigated in this research, has its own growth
requirement. Optimum growth of crop could be reached if the requirements are
met. Based on crop tolerance to the environmental value, the degree of suitability
can be divided into 4 classes: highly suitable, suitable, marginally suitable, and
not suitable.
While the environment factor value depend on the condition of the
environment, which meet to the optimum growth of crops; the human factors,
which contribute to the assessment of environment factors, are obtained from the
questioners that are distributed to experts. The expert in this case consists of
policy makers, farmers, and researcher, which have experience or expertise on the
land suitability for each investigated crop. The human factor values are set from 0
up to 100 percent. The human factor values applied to each crop is described in
26
Table 3.2. The human factor value from expert for Environmental factors
Crops Slope
Source: Respondent data
After getting the result of human factors values from respondents above, the
weighting method will process all data with the formula that have created. The
formula describes the relationship between all factors i.e. environmental factor and human factor in weighted method analysis.
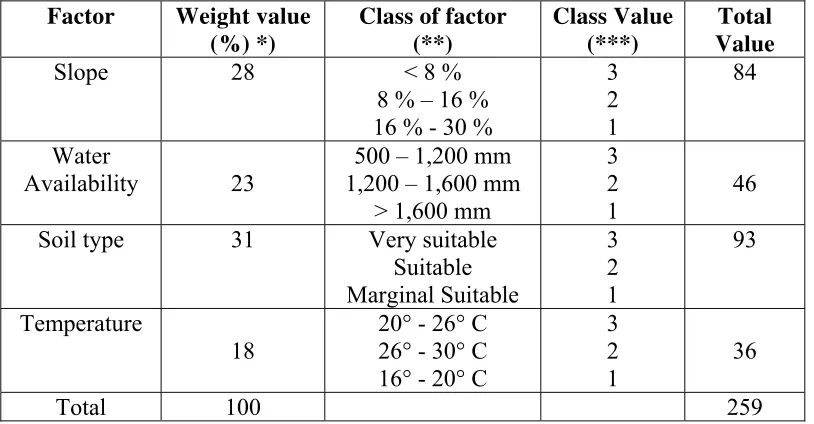
As mentioned before, there are two values for the overlay processed of
weighted method i.e. value for each environmental factor (altitude, water
availability, soil, and temperature), which were given by experts above, and value
for the class of each environmental factor that depend on literature. For instance,
the values of overlay weighted method for corn are shown in Table 3.3.
Table 3.3. Factor and Class value of Overlay Weighted Method
Factor Weight value
(%) *)
Class of factor (**)
Availability 23
27 Note:
*) factor value : from expert
**) Class of environment factor : from literature
**) class value : 1= marginally suitable, 2 = suitable, 3 = highly suitable
The land suitability value is summing up of all factor total values that were
applied, and the total value itself is obtained from human factor value multiplied
by the environment class value. The minimum and maximum values of land
suitability can be calculated as:
a) The maximum value: if all factors have maximum class value.
The maximum value: 100 * 3 = 300
b) The minimum value: if all factors have minimum class value.
The minimum value: 100 * 1 = 100
As mentioned before, the land suitability areas were divided into 3 classes
that are very suitable, suitable, and marginal suitable. Therefore, the range value
between land suitability classes is the maximum value minus minimum value
divided by number of classes. So, the range value is (300 - 100) / 3 = 66.67, or
rounded up to 67. The interval values for each class are:
- Marginally suitable area having value between 100 up to 167;
- Suitable area having value between 168 up to 235; and
- Highly suitable area having value between 236 up to 300.
If one or more factors or classes have 0 (zero) value, the result becomes a
not suitable areas.
28 2. Revenue Cost Analysis Approach
Revenue cost analysis is needed in order to get the biggest profit in the area
that is suitable for several crops.
The procedure to get the potential area is done by overlaying all of suitable
land area for each crop; from this activity the areas that have the suitable criteria
for more than one crop in the same suitable criteria level can be found. By
inputting revenue cost analysis data for each crop, the potential crop, which could
give the maximum return, can be obtained.
For the areas that have the ‘suitable’ criteria for more than one crop in the
different suitable criteria levels, for instance: the area is suitable for corn in level
S3 and also suitable for rice field but in level S1; this area should be as a potential
4.
IV. RESULT AND DISCUSSION
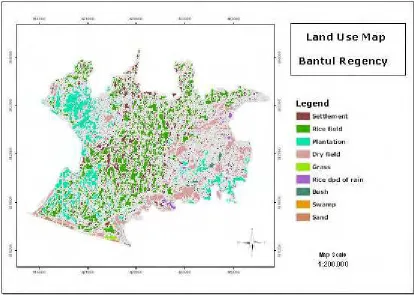
4.1. Land Use Map
The existing condition of research area that was obtained from the
classification process and completed/validated by secondary and field data, shows
that land cover consists of settlement, agriculture area, dry land, bush, and sand.
Depending on the source data, land use in research area can be divided into
several land uses (see Figure 4.1).
Figure 4.1. Land Use Map of Bantul Regency.
Based on the land utilization data from land use map above shows that
areas which could be processed refer to scope of research were rice field, dry land,
grass, and rice dependent of rain field.
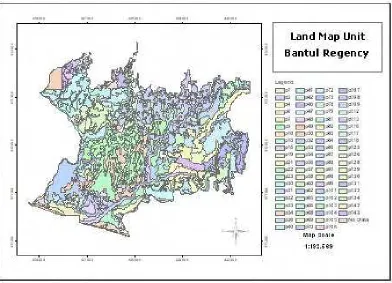
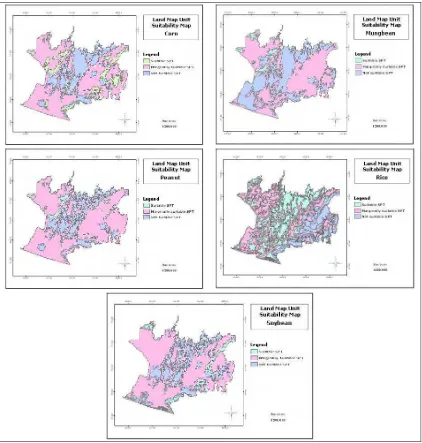
4.2. Soil Type Map
The Peta Tanah Semi Detail map from Puslittanak classified the soil types
as Satuan Peta Tanah (SPT) or Land Map Unit. SPT is the smallest unit of soil
type, which had the same characteristics and distinguished element from other
SPT.
From the available data used in this research, the research area consists of
78 SPT’s.
Figure 4.2. Land Map Unit of Bantul regency.
Then the 78 SPT’s were analyzed one by one to get the level of suitability
of each SPT to the investigated crops. The results of analyzed process for each
crop were grouping into highly suitable SPT group, suitable SPT group,
marginally suitable SPT group, and not suitable SPT group.
The suitability classification of SPT group for each investigated crops are
shown in Figure 4.3.
Figure 4.3. Suitability map of Land Map Unit for each crop
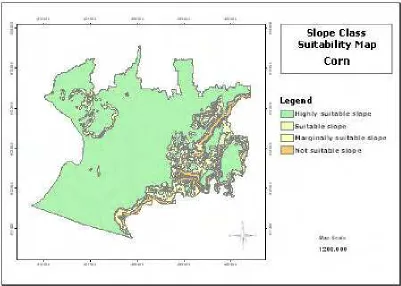
4.3. Slope Map
Most of Bantul Regency are flat plain areas with slope of less than 2 %, and
the distribution of plain area are in the northern, middle and southern parts of
Bantul Regency covering an area of about 31,421 Ha (61.99 %). Most of the
eastern and western areas have slope from 2.1 up to 40 % and cover about 15,148
Ha (30 %), and the rest of the area have slope of more than 40 %.
Based on the criteria of land suitability that published by Puslittanak, some
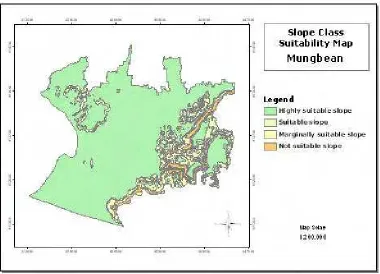
investigated crop have the same the classification as slope suitability. The crops,
which have same classification were corn, mungbean, peanut, and soybean. Rice
need more flat area for its growth, so the areas, which have slope more than 8 % is
classified as not suitable area.
Figure 4.4. Slope class suitability map for Corn
Figure 4.5. Slope class suitability map for Rice
Figure 4.6. Slope class suitability map for Mungbean
Figure 4.7. Slope class suitability map for Soybean
Figure 4.8. Slope class suitability map for Peanut
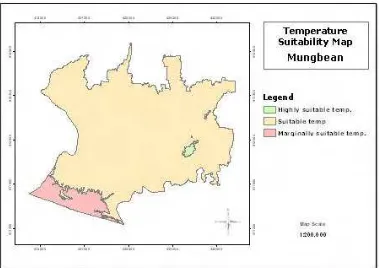
4.4.Temperature Map
Temperature zone in research area is made by using Braak formula with
contour data as an input. The classification of temperature is based on the
temperature suitability classification for each crop which issued by Puslittanak.
Generally, the temperature of Bantul Regency is suitable for all crops
investigated. According to Puslittanak land suitability classification, the suitable
temperature needed for almost all investigated crop are between 16° C up to
34° C, except Mungbean needed the temperature cooler than others that is
between 8° C up to 30° C for its optimum growth. The temperature suitability
map for all investigated crops can be seen in Figure 4.9 to 4.13.
Figure 4.9. Temperature suitability map for Peanut
Figure 4.10. Temperature suitability map for Corn
Figure 4.11. Temperature suitability map for Mungbean
37
Figure 4.12. Temperature suitability map for Rice
4.5.Rainfall Map
The water availability zones were obtained from the isohyet line of rainfall
average data of several rainfall observation stations (rainfall data can be seen in
Appendix 6). Based on average hydrological data series, it shows that the water
availability were not become a limitation factor for growing the investigated
crops. There were no unsuitability areas of water availability level in the research
area, the water availability level for all investigated crops at least on marginally
suitability level.
According to Puslittanak Land Suitability Criteria and discussion result with
expert from Puslittanak, water availability level for rice was not based on rainfall
but more from the wet area (rice field irrigation areas). The areas outside the wet
area were classified as marginally suitable areas. Areas that are suitable for
mungbean were found in the area where water availability has marginally suitable
level. Suitability map of water availability for all crops can be seen in Figures
4.14 to 4.18.
Figure 4.14. Water available suitability map for Mungbean
Figure 4.15. Water available suitability map for Rice
Figure 4.16. Water available suitability map for Corn
40
Figure 4.17. Water available suitability map for Peanut
41 4.6. Overlay Process and Weighting Analysis
After all suitability data of investigated crops for each factor are ready, the
next step was cropping to overlay all suitability data for slope, water availability,
temperature, and soil. As mentioned before, all unsuitable data for this area were
not processed further, but others will be processed for the next step.
Unsuitable areas were not inputted to the overlay process due to need the
high effort to increase the level from not suitable to marginal suitable level. And
in this research, the determination of suitability level was assumed on the
operationally level that usually done by farmer.
The results of overlay process are parcels that are obtained from intersecting
between suitability levels of each factor. The overlay process was done to each
crop, and the results of this process were used for the weighting process.
In weighting process, land suitability level was generated from summing up
of all factor total values that were applied, and the total value itself is obtained
from human factor value multiplied by the environment class value.
The results from overlay process above were processed by weighting
method to get the land suitability level of each crop. The areas were divided into
four parts: highly suitable, suitable, marginally suitable and not suitable area
(Figure 4.19).
As mentioned before in the scope of research, the investigated areas were
areas, which was obtained from classification process and completed by
secondary data that were classified as agricultural area like rice filed, dry land,
rice dependent rain field, or area that could be converted into agricultural area
Figure 4.19. Land Suitability Area for Corn in Bantul Regency
Figure 4.20. Land Suitability Area for Corn on existing condition in Bantul Regency
Table 4.1. Land Suitability Area for Corn on the Existing Condition
And from overlying process of the land suitability area of each crop with
the existing condition on the investigated area, it could be seen that ‘suitable area’
were located on the areas, which were could classified into four existing land
utilization.
The areas were: mixed plant areas, rice plant areas, dry field rice areas, and
grass areas. Mixed plant areas mean the existing conditions of those areas were
already planted by several kind of crop, which were planted in dry field areas.
Rice plant areas mean the existing condition areas were already planted by rice
plant. Dry field rice areas mean the existing condition were already planted by
dry field rice. And the grass areas mean the existing condition was grass.
The land suitability areas for mungbean in Bantul Regency were shown in
Figure 4.20, and referred to the scope of research the suitable areas were also
applied only on the investigated areas as shown in Figure 4.21.
Figure 4.21. Land Suitability Area for Mungbean in Bantul Regency
Figure 4.22. Land Suitability Area for Mungbean on existing condition in Bantul Regency
Table 4.2. Land Suitability Area for Mungbean on the Existing Condition
Figure 4.23 below showed the land suitability areas for peanut in Bantul
Regency, and the intersecting area between suitable area and the existing
condition was shown in Figure 4.24.
Figure 4.23. Land Suitability Area for Peanut in Bantul Regency
Figure 4.24. Land Suitability Area for Peanut on existing condition in Bantul Regency
Table 4.3. Land Suitability Area for Peanut on the Existing Condition
Land suitability area for rice in Bantul Regency could be seen in figure 4.25.
Most of the suitable areas for rice in investigated area were located in the proper
place, which were rice plant areas as can be seen in Figure 4.26.
Figure 4.25. Land Suitability Area for Rice in Bantul Regency
Figure 4.26. Land Suitability Area for Rice on existing condition in Bantul Regency
Table 4.4. Land Suitability Area for Rice on the Existing Condition
As other investigated crop, the land suitability for soybean in Bantul
Regency can be seen in Figure 4.27. Location of suitable area on the existing
condition area was shown in Figure 4.28.
Figure 4.27. Land Suitability Area for Soybean in Bantul Regency
Figure 4.28. Land Suitability Area for Soybean on existing condition in Bantul Regency
Table 4.5. Land Suitability Area for Soybean on the Existing Condition
4.7. Agricultural Potential Area
Data about ‘suitable area’ of each crop on the investigated area above,
indicated that there were several condition which can described the relation
between the suitable areas of each crop and the existing condition.
The conditions were: suitable area and the existing condition was already
match, suitable area and existing condition was not match, and the areas were
already suitable but have not managed yet. The instance of first condition can be
described as the areas that were suitable for rice and existing condition were rice
plant or areas that were suitable for peanut and existing location were in dry land.
Second condition was described as the areas that were suitable for soybean and
the existing condition were rice plant (rice field) or dry field rice. And the third
condition was described as the areas that were suitable for corn and the existing
conditions were grass.
Description of suitable areas of all crop that fulfilled the conditions above,
were generated by overlaying the suitable areas of all crops that have been
obtained before (Figure 4.29).
Figure 4.29. Land Suitability Area for Crop on existing condition in Bantul Regency
51
To determine the agricultural potential areas was carried out by
investigating all land suitability level of areas that belonging of the conditions
which is described above.
Agricultural potential areas means the areas that will give the higher profit if
it is operated by a certain crop, which is suitable in those areas, compared other
crops that are also suitable in that areas in the same level of crop land suitability.
And for determining a certain area for the most profitable agricultural
operation, is by looking to value of revenue cost analysis of each crop. A certain
commodity which had the higher revenue cost analysis value was more profitable
than others. The areas which are suitable for several crops but have different land
suitability level; the agricultural potential area is determined by looking for the
crop which has the higher land suitability level.
In Table 4.6, it can be seen the revenue cost analysis of each crop. And the
utilization of area for agricultural operation of corn gave the most profitable value.
The detail item of revenue cost analysis of each crop can be seen in appendices 7
to 11.
Table 4.6. Ratio Revenue-Cost Comparison of Commodities
No Commodities R/C Ratio
For the area, which is suitable for several crops but have different land
suitability level; the agricultural potential area is determined by looking for the
crop which has the higher land suitability level.
Figure 4.30. Agricultural Potential Area in Bantul Regency.
And the agricultural potential area in Bantul Regency, which was generated
from revenue cost and land suitability analysis, can be seen in Figure 4.30.
Potential areas for rice were only grouped into one potential criterion that
was areas which were suitable for rice and located in rice field. Other areas, which
were suitable for rice but located on the outside of rice field, can not be
categorized as potential areas for rice because it needed a lot of effort to irrigate
water to those areas.
Table 4.7. The Area and Location for Agricultural Potential Area of Investigated Crops
And as mentioned before, the areas which have not managed were areas,
which were located in grass areas.
Table 4.7 showed that potential areas for rice, which is match with the
existing condition, had the highest areas among others. On the other hand, there
were no areas which were potential for mungbean. Even though mungbean had
enough suitable area, but compared with other crops, agricultural operation by
mungbean economically was not profitable enough.
And the data also indicated that there were areas, which still can explored
more in order to get more food or benefit, especially for areas that potential for
certain crop but were located in other land use areas or areas which have not
managed yet.
Grass area as area which potentially can increase the production of food, in
this case economically was not significant because the areas was not too wide.
Totally area of grass was only 1.1 % of total potential areas.
54
5.
V. CONCLUSION AND RECOMMENDATION
5.1. Conclusion
Exploring of geography information system can be applied to provide the
information about potential areas of investigated crops in Bantul Regency.
Determination of agricultural potential areas was based on land suitability and
revenue cost analysis, which is from this analyzing resulted agricultural potential
area for corn, rice, soybean, and peanut respectively.
Suitable lands for investigated crops were obtained by overlay process to all
environment factors that used, which have been classified according to the land
suitability criteria of each environment factor. And by using weighted method for
analyzing, suitable area can be classified into four classes: highly suitable,
suitable, marginally suitable areas, and not suitable areas.
The result of Agricultural Potential Area in Bantul Regency indicated that
the most potential areas for corn were already located in the proper area (dry
field), with the areas about 66.8 % of total potential area of corn. The same like
corn, 90.9 % of total potential areas of peanut were also already located in the
proper area (dry filed). For mungbean, 50.1 % of total potential area of mungbean
were located in rice plant area, and only 42.9 % of total potential areas of
mungbean were in the proper area (dry field). For rice, all of potential area for
rice were located in rice field arera, which were about 79.7 % of total areas of rice
field.
However, the revenue-cost analysis could be used as consideration to
55
profit of agricultural investment in Bantul Regency is corn with revenue cost ratio,
of 3.45, followed by rice (R/C = 2.54), soybean (R/C = 2.30), peanut (R/C =
1.87), and mungbean (R/C = 1.46).
Overall, it can be said here that remote sensing and GIS as tools have proven
useful to obtain the potential areas for agricultural operation.
5.2. Recommendation
Information about agricultural potential area and land suitability area can be
used by local government as a tool for land use planning, and for investor this
information can be used to determine which crop would be planted.
The recommendation to local government if want to assess this research, is
the local government should take inventory to the land resource area which is
included to the agricultural potential area, then suggesting the farmer to plant their
land with the suitable potential crop of their land.
The accuracy of data is needed to support the user to get the accurate
information about land suitability and agricultural potential area.
Further study need to be carried out to develop spatial database to complete
the database in spatial form, and developing the facilities to manage, analyze and
56
6.
REFERENCES
Addeo, G., G. Guastadisegni and M. Pisante. 2001. Land and water quality for sustainable and precision farming. I World Congress on Conservation Agriculture, Madrid.
Aronoff, S. 1991. Geographic Information Systems: A Management Perpecstive, WDL Publications, Ottawa, Canada.
Carter, R.W.G. 1988. Coastal Environment. An Introduction to the Physical, Ecological, and Cultural Systems of Coastlines. Academic Press. Toronto. Djaenudin, D, et all. 2005. Petunjuk Teknis Evaluasi Lahan Untuk Komoditas
Pertanian. Balai Penelitian Tanah. Pusat Penelitian dan Pengembangan Tanah dan Agroklimat. Bogor.
ESRI, Arc ViewGIS, 32. Software, Help. Weighted Method.
ETSU, 1999.What is GIS?. URL: www.etsu.com/gis/html/what is gis.html.
FAO Soils bulletin 32. A framework for land evaluation. 1981, Soil resources development and conservation service land and water development division, FAO AND AGRICULTURE ORGANIZATION OF THE UNITED NATIONS, Rome 1976
http://www.fao.org/docrep/X5310E/x5310e00.htm#Contents
FAO, 1976. A Framework for Land Evaluation. FAO Soil Buletin 32. Soil Resources Management and Conservation Service Land and Water Development Division.
Fisher, P.F. 1994. Probable and Fuzzy Models of The Viewshed Operation Innovations in GIS 1,pp. 161-175.
Foote, K. E. and M. Lynch. 1996. Geographic information systems as an integrating technology: context, concepts and definition. Austin, University of Texas.
http://journalofvision.org/2/1/6/
Janssen, L.L.F. and B.G.H. Gorte. 2000. Digital Image Classification. In Principle of Remote Sensing. ITC, Enschede, The Netherlands.
57
Leingsakul, M., S. Mekpaiboonwatana, P. Pramojanee, K. Bronsveld and H. Huizing. 1993. Use of GIS and remote sensing for soil mapping and for locating new sites for permanent cropland - a case study in the highlands of northern Thailand. Geoderma 60(1-4): 293-307.
Lillesand, T.M. and R.W. Kiefer.1987. Remote Sensing and Image Interpretation. Second Edition. John Wiley & Son. Inc, New York.
Malczewski, J. 1999. GIS and Multicriteria decision Analysis. USA and Canada, John Wiley & Sons.
Marble, D. H., H. W. Calkins and D. J. Pequet. 1984. Basic Readings in Geographic Information Systems. Williamsville, NY., SPAD Sysems Limited.
Meijerink. A.M.S., H.A.M. de Brouwer, C.M. Mannzerts, and C.R. Velenzuela. 1994. Introduction to the Use of Geographic Information System for Practical Hydrology. ITC and UNESCO International Hydrological Programme Netherlands.
Mujihono, R. 2005. Pengkajian Uji Adaptasi Variestas Unggul Baru Padi, Jagung dan Kedelai: Laporan Kegiatan Penelitian dan Pengkajian TA 2005. BPTP Yogyakarta. Yogyakarta.
Nisar Ahamed, T. R., K. Gopal Rao and J. S. R. Murthy. 2000. GIS-based fuzzy membership model for crop-land suitability analysis.. Agricultural Systems 63(2): 75-95.
Ricard, J.A. 1993. An Introduction to Remote Sensing Digital Image Analysis. Second Edition. Spinger-Verlag. Berlin.