xiv
Acknowledgements
This report was prepared by Karen Programme Coordinator and Senior \Vater Resources Management Officer, and Cecilia Spottorno, AQUASTAT consultam, both from the Land and Water Division ofFAO.
Several resource people contributed to the preparation of the coumry profiles: Lutfor Rahman Khan (Bangladesh), P.BS Sarma (Bhutan and India), Yusman Syaukat (Indonesia), Shahid Ahmad (Pakistan), Roger Concepcion (Philippines), Sacha Sethapmra (Thailand), Phong Nguyen (Viet Nam).
The authors wish to acknowledge the assistance of Facon, FAO Regional Office for Asia and the Pacific, and Jacob Burke, Land and Water Division, in reviewing the report. The assistance of Jean Margat in reviewing the information related to the water resources was highly appreciated. Francesca Greco and Jippe Hoogeveen comributed to the coumry profiles of India, Indonesia, Philippines, Thailand and Viet Nam in their earlier stages. Special thanks go to Pasquale Steduto, Deputy Director, and to Parviz Koohafkan, Director, of the Land and Water Division, fOr theif cominuous support during the preparation of the report.
English proofreading was done by Rosemary Allison. The coumry, river basin and regional maps were prepared with the assistance of Emelie Healy.
281
CLIMATE AND
Indonesia is a tTopical archipelago composed of 1 504 islands. It extends over aboLlt 1.9 million k1112 and the coastline exceeds 54 000 km, which is more than the circumference of the globe making it the coumry with the second coastline after Canada. The major islands are SumatLl, Java, Nusa Tenggara (including Bali), Kalimantan, Sulawesi, Maluku, and Papua (previously Irian Jaya). セャッウエ@ of the major islands have a mOllmain range running their entire length. The mOllnrains are of volcanic origin and some are still active. The elevations on the islands range from 0 to 5 030 I1l above sea level. Since 2005 the country has been divided
administratively into 33 provinces. In 200(), the provinces were subdivided into 349 regencies and 91 cities (kota), 5 656 subdistricts and 71 563 villages (desa!
Jakarta is the capital city of the COllntry, located 011 the island ofJava.
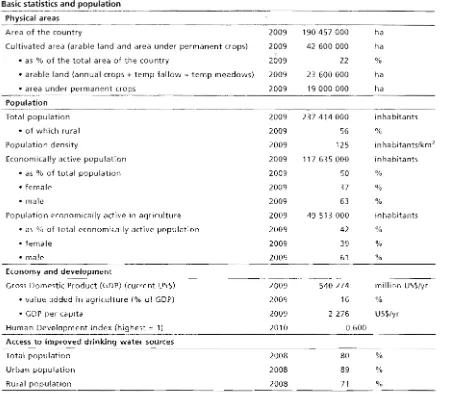
The total cultivated area in 2009 was 42.6 million ha, which is around 22 percent of the total area of the country. Arable land was an estimated 23.6 million ha and the area under permanent crops 19.0 million ha (Table 1). Eum holdings in Indonesia are small: 34 percent are less than 0.25 ha and a further 25 percent are between 0.25 and 0.50 ha.
Climate
Indonesia is located in a wet tropical region with an average annual rainfall of about 2 700 mm, varying from 1 300 mm in East Nusa Tenggara to 4 300 mm in parts of Papua (Table 2) (Bappenas, 2004).
There are two seaS011S: the dry and the wet. The dry season is influenced by the Australia conrinemai air masses and lasts from March to August. The wet season is influenced by the Asia Continental and Pacific air masses passing over the oceans and lasts from September to March. The heaviest rainfall is usually from November to February.
Temperatures range from 21°C to 33 DC, but at higher altitudes the climate is Humidity
is beC\veen 60 and 80 percent.
Population
In 2009, the total population was almost 237 million, of which 56 percent was rural (Table 1). There are four people in an average household. Population growth rate decreased sharply, from 2.1 percent per year during the period 1979-1989 to 1.2 percent per year from 1999 to 2009. Over time, Indonesia's population has been concentrated on Java Island, which contains 59 percent of the total population, while its land area is only 7 percent of the total land area of the country. Therefore, population density in Java was 1 019 people/km2 in 2009, while population density at the national level was 125 inhabitants per km2.
INDONESIA
Legend
Lセ@ International Administrative
••• Capital, Regional Capilal, Town
River
o
Lake>0< Dam
Zone of Irrigation Deveiopment " Irrigation Scheme
0
0 125 250 500 750 kmMセZMZ[MMGMMN]ZZGZBGI@
_ A!l'lE!lS Equal Area Projection, WGS 1984
FAO .. AQUASTAT, 2011
Disclaimer The design, material oresentation of /"'v -I. NAM
South China Sea
/ / " , /'';.;):0'
,GAPOaE/ \'PonH.naiV" 1 r セlャ@
Celebes Sea Pacific Ocean PAPUA NEW GUINEA
BGゥNB⦅LNZセLN@
16 , /セ。ャゥD。ョQエ。セONLZIL
kッエoLセェ。L_ヲセセセzjセゥZセNBBBNN@
' _··....·'c:, /"ilI11b ,_ --. • . . • . .,:1")\12....,,.; 14 {<, \_ "BcセGLZ@
_'fl?..
L。、Nョ|ャBBヲNOセBjjZGNャZN
。ョァャゥAャャA^ゥセNイゥァ@
'\ lーIセョァォNイ
.•y 13)' !:;'.1 <,3 1\' 8 Y;'_,,""M,,n ." """\"" '''?-.:'' ,2"."" i j ) c"',."", ',.
Bセ⦅GB@
' .... ""Rlam.:Kan.no 'I'"'. , ' ' ' "
p。ャNBL「。ョァLセ@
, ' / Banjarm••, n : : ; Ujongpa2da f9
Mセョァセオセ@
' ",\..セ@
32/"",, {" \ . 6 Java Sea .'4
»,'
17i
djiikarta ,...BᄋMセセGj_ャケセーオイ。|@
""c... 5
il',.
-'" .セイGォ@XG[セ、jk@ Lampu セ@ LNセ@ _. ,
Indian Ocean
Provinces of Indonesia
1 Ball
2 Bangka Belitung
3 Banten 20 N angme Ac
4 Bengkulu 21 West Nusa TI
5 Daerah Ist!mewa Yogyakarta 22 East Nusa Ta
e Ok! Jakarta 23 Papua
7 Goront910 24 Wast Papua
. 8 Jambi 25 Rlau
9 WestJava 26 WasfSulawBsl
10 Central Java 27 South Sulawesi
11 East Java 28 Cential Sulawesi
12. WastKlllimanmn 29' SoutHeast Sulawesi
13 South KalimanllIn 30. North. Sulawesi
14 Central Kalimantan 31 Wast Sumatra '
15 'East Kalimantan 32 South Sumetra
16 Kepula uan Riau 33 North Sumatra
17 LlImpung
TimOl' Sea
JUlJ(l Sea
" , Belli Sea
• I " ' " . , " ' " /
・NセセセイlNュセ[イセ。セセG[BZMjセbBGBL@
0c[[NュBGNNNNNNNセN[[BB
0..
/
BLmLBセLBセ@
,;.I., • ," ,.''','''''•.•セ@
0" ,," ,
BGセBNNNN@
_ ._
/".>,,!" ..
セj@
*.Cff8t. ,lc J JAVAセセZヲエZ@
"
ャH|ゥG\セセs、GッゥBェッGoNiヲN@
BG⦅セLO
MI,l 'I')"">,.j'• , ' ' ' ' , ' , ",I P
セ セL@
X", "セN@
' _••••Indonesia Z83
TABLE 1
Area of the country 2009 190457000 ha
Cultivated area (arable land and area under permanent crops) 2009 42600000 ha
• as % of the total area of the country 2009 22 %
• arable land (annual crops + temp fallow + temp meadows) 2009 23600000 ha
• area under permanent 2009 19000000 ha
Population
Total population 2009 237414000 inhabitants
• of which rural 2009 56 %
Population density 2009 125 inhabitants/km2
Economically active population 2009 117 635 000 inhabitants
• as % of total population 2009 50 %
• female 2009 37 %
• male 2009 63 %
Population economically active in agriculture 2009 49513 000 inhabitants • as % of total economically active population 2009 42 %
• female 2009 39 %
• male 2009 61 %
Economy and development
Gross Domestic Product (GDP) (current US$) 2009 540274 million US$/yr
• value added in agriculture (% of GOP) 2009 16 %
• GOP per capita 2009 2276 US$/yr
Human =1) 2010 0.600
2008 80 %
Urban population 2008 89 %
Rural 2008 71 %
37 percent for urban and rural population respectively}. About 60 percent of households have their own toilet facilities. In 2006, there were aboU[ 30 million poor, which is equal to 18 percent of the total population. The level of urban poverty (13 percent) is lower than that of rural areas (22 percent).
ECONOMY, AGRICULTURE
AND
FOOD SECURITYThe toml economically active population in 2009 was 118 million, of which 37 percent were women. The population that is economically active in agriculture is an estimated 50 million, approximately 42 percent ohhe economically acdve population. Of the population economically active in agriculture, 39 percent are women and 61 percent are men. In 2009, the gross domestic product (GOP) was US$540 274 million, with a value added in agriculture that was 16 percent of the GOP (lable 1).
[image:5.612.83.545.101.495.2]-284 Irriglltion in Southern and Eastern Asia in figures -AQUASTAT Slim,,)! - 2011
TABLE 2
rainfall and renewable water resources (Source: from Bakosurtanal, 2001)
Internal renewable surface
Area Precipitation water and
Island resources
1000 km2 IRSWR IRGWR
Sumatra 464 2600 1 206.4 481.4 85.8
Java 132 2600 343.2 125.6 25.6
Nusa Tenggara 73 1 500 109.5 37.1 1.5
Kalimantan 572 2800 1 601.6 594.2 125.1
Sulawesi 168 2100 352.8 177.1 16.6
Maluku 75 2200 165.0 63.5 5.9
421 3200 1 347.2 493.7 196.9
Total 1905 2700 5125.7 1972.6 457.4
between IRSWR and IRGWR 411.7
TotallRWR 2018.3
Productivity of dryland (rain/ed) rice is just little bit more than half of the productivity of wetland rice: 2.56 ronnes/ha against 4.78 rollnes/ha.
Though Indonesia produces a quancity of rice, it is still a rice importer. In the past, it was the largest rice importer, reaching 1.8 million tonnes of rice in 2002. However, in 2006 import rates reduced significantly, to as little as 438 000 tonnes. Besides food crops, Indonesia is also producing a large number of perennial crops, including rubber, coconut, palm oil, coffee, cocoa, and tea, which are currently exported.
In terms oHood security, national rice production is relatively safe and stable. In 2000, surprisingly, Indonesia had a rice surplus of more than 2 million ronnes (Suprapro, 2001). This surplus resulted from favourable weather, increased cropping intensity and rice planting area, and from a decline in the national per capita rice consumption. The domestic food availability has fulfilled the needs of the popularion; the average available calories are 2 200 kcal per capita per day.
WATER RESOURCES AND USE
Water resources
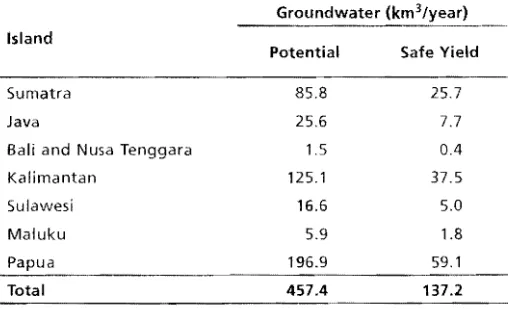
Total internal natural renewable water resources are around 2 018.3 km3/year (Table 2). Surface water resources are an estimated 1 972.6 km3/year and groundwater resources .4 km3/year.
Most of the groundwater, an estimated 90 percent or 411. 7 km3fyear, returns as
TABLE 3
baseflow to the rivers. It is assumed that
Safe yield of groundwater by Island (Source: Bakosurtanal, 2001)
only 30 percent of groundwater resources,
Groundwater (km3/year) or 137.2 km3fyear, are consumable,
Island
Potential Safe Yield called 'safe yield' (Table 3) (Bakosurtanal,
2001). Over-abstraction of groundwater
Sumatra 85.8 25.7 in Jakarta has caused saline groundwater
Java 25.6 7.7 to reach about 10 Ian inland from the
Bali and Nusa Tenggara 1.5 0.4 coastline and has led to land subsidence
Kalimantan 125.1 37.5 at a rate of 2-34 emf year in east Jakarta.
Sulawesi 16.6 5.0
Maluku 5.9 1.8 Although water resources are abundant,
196.9 59.1 the seasonal and spatial variation in the
rainfall pattern and lack ofadequate storage
[image:6.612.80.522.109.300.2] [image:6.612.86.340.628.783.2]indonesia 285
create competition and conflicts among users. Municipal and industrial wastewater is discharged virtually untreated into the waterways causing rapid deterioration in the quality of river water.
Most of the lakes in Indonesia are of volcanic origin. Lake Toba is the largest volcanic lake in the
world with an average surface area of 1 100 km2 and an average volume of 1 258 km3.
In 2006, total dam capacity reported ,vas 22.49 km3, but total capacity is higher because the
capacity was unknown for some dams. In 1995 total dam capacity was an estimated 15.83 km3.
The dams with a capacity of over 1 km3 are Jatilulmr (2.89 km3), Siruar (2.82 km3), Cirata
(2.17 km3), Pongkor (1.95 km3), Batu Bokah 0.67 km3), Kotopanjang (1.55 km3) and Riam
Kanan 0.20 km3).
By developing large dams, Indonesia has progressively been able to extend its water resources
utilization to support 2 200 MW of hydropower generation, representing 20 percent of the
national generating capacity.
International water issues
Based on a recent river territory inventory, Indonesia has 14 rivers that exceed state boundaries:
five rivers with Malaysia in Kalimantan island (Baram, Lupar, Sebuku, Sembakung, and Serundong), three rivers with Timor Lorosae in Timor island (Loes, Nitibe, and Willi), and six rivers with Papua New Guinea in Papua island (Bewani, Fly, Merauke, Sepik, Tami, and Tari) (\\'litoelar, undated). There are no records of major issues related to these transboundary rivers.
Water use
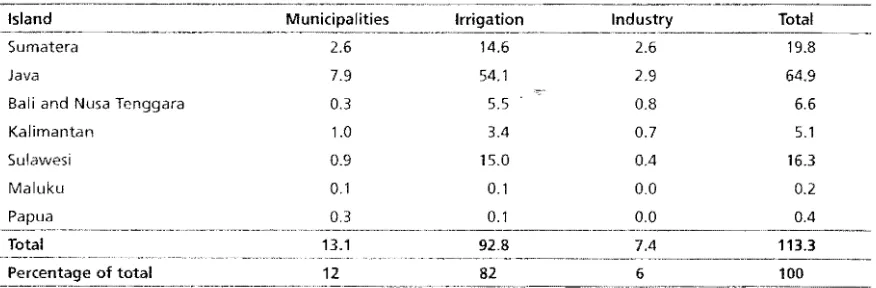
In 2000, total water withdrawal was 113 km3 (Table 4 and Table 5). Water withdrawal for
agriculture accounted for 93 km\ or 82 percent, municipalities and industries accounted for
TABLE 4
Water: sources and use
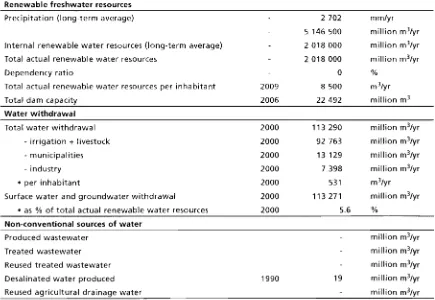
Renewable freshwater resources
Precipitation (long-term average) 2702 mm/yr
5 146500 million m3/yr
Internal renewable water resources (long-term average) 2018000 million m3/yr
Total actual renewable water resources 2018000 million m3/yr
Dependency ratio 0 %
Total actual renewable water resources per inhabitant 2009 8500 m3/yr
Total dam capacity 2006 22492 million m3
Water withdrawal
Total water withdrawal 2000 113 290 million m3/yr
- irrigation + livestock 2000 92763 million m3/yr
- municipalities 2000 13 129 million m3/yr
- industry 2000 7398 million m3/yr
• per inhabitant 2000 531 m3/yr
Surface water and groundwater withdrawal 2000 113 271 million m3/yr
• as % of total actual renewable water resources 2000 5.6 %
Non-conventional sources of water
Produced wastewater million m3/yr
Treated wastewater million m3/yr
Reused treated wastewater million m3/yr
Desalinated water produced 1990 19 million m3/yr
[image:7.612.83.518.485.785.2]-15.54%
286 Irrigation in Southern and };futern Arid AQUASTAT Sur",,), 2011
TABLE 5
Total water withdrawal Island in 2000 (km3/year)
Island Municipalities Irrigation Industry Total
Sumatera 2.6 14.6 2.6 19.8
Java 7.9 54.1 2.9 64.9
Bali and Nusa Tenggara 03 5,5 0.8 6.6
Kalimantan 1.0 3.4 0.7 5.1
Sulawesi 0.9 15.0 0.4 16.3
Maluku 0,1 0.1 0,0 0,2
Papua 0,3 0.1 0.0 0.4
MMセ ..--.,•.----.-.-...MMMNセNMNMM •.. GセMMMセMGMBGGGGセGGMMMMMMMMGMGセセGMGGGMMMMGGGGMMGGMMMMM
Total 13.1 92.8 7.4 113.3
...""rt>,nT",n .. of total 12 82 6 100
FIGURE 2
Water withdrawal by source Total 113.29 km3 in 2000
,..--- Desalinated water
0.02%
Industrial water demand has gradually increased over time. Since piped and open surface water supplies are relatively limited, where the industries are located, most use groundwater for their water source, particularly in the large cities ofJava.
Both national and ゥウャ。ョ、M「ケセゥウャ。ョ、@ water
balances are positive, meaning that water availability is higher than consumption level. However, in Java and Nusa Tenggara a water
deficit occurs during the dry season (July to
October, varying by the province). Even some significantly large river areas in Java, including Bengawan Solo, Branras, Ciliwung, Cimanuk,
Citanduy, and Ciujung, are estimated to face
water deficit problems during the dry season.
Surface water
84.44%
FIGURE 1
Water withdrawal by sector Total 113.29 km3 in 2000
, - - - Industry
7%
Municipalities
12%
81%
13 km3 (12 percent) and 7 km3 (6 percent)
respecrively (Figure 1). In 1990, rotal water
withdrawal was about 74 kIn''' of which 93 percent for agriculture, 6 percent for municipalities and 1 percent for industrial use.
In 2000 surface water and groundwater withdrawal was 84.4 percent and 15.5 percent respectively of total water withdrawal (Figure 2). In 1990 desalinated water was an
estimated 19 million m3.
Groundwater is used by percent of
[image:8.612.87.525.106.250.2]r
;Indonesia 281
IRRIGATION
AND
DRAINAGE
DEVELOPMENT
Evolution of irrigation development
The development of community irrigation systems started more than two thousand years ago. Modern irrigation systems were introduced in the middle of the nineteenth century. Small irrigation systems developed by the communities in Java covered a.total of 1.1 million ha in 1880. This asset was very significant at that time since the total population of Java was only 19.5 million. The developmem of irrigation systems grew at a rare of 1.21 percent per year in the period 1880-1915, covering 1.62 million ha in 1915. The Dutch colonial government developed the first large irrigation system, 34000 ha, in Sidorajo delta in East Java by lIsing the Bramas river water Hows.
A full-technological irrigation and drainage system was first developed during the 18805 in Demak, Central Java, on 33 800 ha. This system was developed to address the famine caused by dtought and floods in the area. 'The Bllrgcrlijke Openbare \l?{;rken, which later became the Department of Publi<.: Works, was developed ill 1885, among other tasks, it was to develop irrigation systems. The Dcpartcment van Landbou{)), which later became the Dcparnnent of Agriculture,)was developed in 1905 in Bogor, \'(!CSt Java.
The developmcnt of irrigation systems became one of the priorities of the newly created Republic ofIndonesia after the Second \Vorld \'(Iar. The first multi-sector project was proposed in 1948 to
develop Jatiluhur dam at Citarum river in \Xlest Java to allocate water for irrigation, hydropower, and domestic use. In 1969, Indonesia launched its first development programme (Repdita l). Since then, there have been other ricc intensiflcation programmes, their main self-sufficiency in rice. This includes supply ofirrigation water, use of
high-and pesticides, high-and is supported by agricultural extension programmes. The irrigation development programme includes rehabilitation of irrigation works, expansion of service areas in existing schemes, construction of new irrigation systems, upgrading of the existing irrigation systems, implementation of efficient operation and management programmes, strengthening of water user associations (\x'UAs), and many other initiatives.
In the first 25 years of development, spanning five Repelitas (1969-1993) termed 'Pembangunan Jangka Panjang
r
(PJP 1) or first phase of long-term development, water resources policies were directed to supporting the development of different sectors with the primary emphasis being on agriculture. Abom 1.44 million ha were provided with new irrigation systems and 3.36 million ha of irrigation systems were either rehabilitated or upgraded through special maintenance.The second development period (1994-2019), termed PJP II, started in April 1993 with Repelita VI. The emphasis was on sustainable development and management of water resources. Water resources have been elevated to a full secror level and policies are to promoting a more effective and efficient management of water resources in an integrated manner. Greater emphasis is placed on sustaining self-sufficiency in rice and on the operation and maintenance of water resources infrastructure. In addition, the Government is implementing a crash programme in Repelita VI to improve one million ha of village irrigation systems and to develop a 600 000 ha rice estate by swamp reclamation in central Kalimantan.
-288 frrig'ltion ill Southern fmd Eastern Asia in figures - AQUASTAT -2011
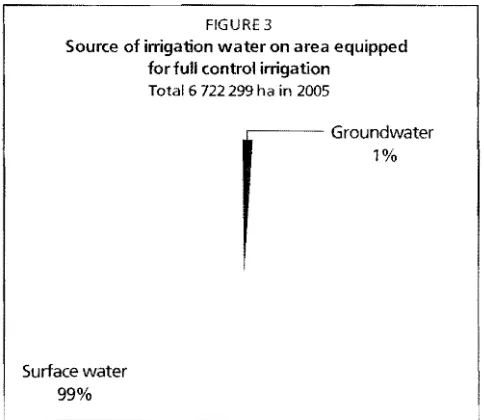
water to 4 600 000 ha. In 1995, irrigation from groundwater teportedly covered 44 209 ha, of which 36 784 ha were served by 834 deep tubewells, 4 204 ha by 363 intermediate tubewells and 14 807 ha by 1 shallow tubevvells. In 2005 it was estimated that 99 percent of the total equipped area was irrigated by surface water and 1 percent by groundwater (Figure 3).
Total water managed area covered 9 855 616 ha iri2005 (Table 6). Full control irrigation areas covered 6 722 299 ha (68 percent), comprising technical, semi-technical, and simple irrigation, while non-equipped cultivated wetlands covered 3 133 317 ha (32 percent), of which 2088622 ha were village managed and 1 044695 cultivated by the state. Ofthe total equipped area for irrigation 100 percem is irrigated using surface irrigation techniques.
Fields under water management are classed under five types: technical, semi-technical, and simple irrigation, and village-managed wetlands and cultivated swamps (Table 7). Usually the first three types belong to the public works system.
Technical irrigation is an irrigation system in which distribution of water can be fully controlled from the source to the field. It is characterized by permanent canals, control structures, and measuring devices. This irriga[ion system consists of primary, secondary, and tertiary canals, which are fully controlled by the government. In 2005 they served 4 781 860 ha while in 1996 they served 3328016 ha,
Semi-technical irrigation systems are characterized by permanent canals and few control or measuring devices. The government usually controls the primary canals, which are equipped with measuring devices, while the distribution systems next to those canals are not equipped with measuring devices. This system sen'ed 1 257 987 ha in 2005 and 1 099906 ha in 1996.
Simple irrigation systems are characterized by ollly a few permanent control or distribution structures and may be managed by farmers. The government may provide a part of the system, for example building the required dam. Simple irrigations systems were serving 683 242 ha in 2005 and 697 194 ha in 1996.
[image:10.612.79.321.541.751.2]Village-managed wetland cultivation is a basic wetland water control system, developed and managed spontaneously by farmers. This system served 2 088 622 ha in 2005 and 1 961496 ha in 1996.
FIGURE 3
Source of irrigation water on area equipped for full control irrigation
Total 6 722299 ha in 2005
, - - - - Groundwater 1%
Surface water 99%
Cultivated swampland is wetland where its watering mechanisms depend on river water, which is affected by seawater tides. Indonesia has an estimated 39 million ha of coastal and inland swamps. The extent of arable swampland has not been assessed in detail but is estimated to be 7.5 million ha, In 2005, the tidal and non-tidal swamp area mainly used for rice was about 1 044695 ha and in 19% 1 182760 ha in 19%.
indonesia 289
TABLE 6
Irrigation and drainage
Irrigation potential 10 886 000 ha
Irrigation
1. Full control irrigation: equipped area 2005 6722299 ha
- surface irrigation 2005 6722299 ha
- sprinkler irrigation ha
- localized irrigation ha
• % of area irrigated from surface water 2005 99 %
• % of area irrigated from groundwater 2005 %
• % of area irrigated from mixed surface water and groundwater %
• % of area irrigated from mixed non-conventional sources of water %
• area equipped for full control irrigation actually irrigated ha
- as % of full control area equipped %
2. Equipped lowlands (wetland. ivb. flood plains. mangroves) ha
3. Spate irrigation ha
Total area equipped for irrigation (1+2+3) 2005 6722299 ha
• as % of cultivated area 2005 18 %
• % of total area equipped for irrigation actually irrigated %
• average increase per year over the last 10 years 1996-2005 4.3 %
• power irrigated area as % of total area equipped %
4. Non-equipped cultivated wetlands and inland valley bottoms 2005 3 133317 ha
5. Non-equipped flood recession cropping area ha
Total water-managed area (1+2+3+4+5) 2005 9855616 ha
• as % of cultivated area 2005 26 %
Full control irrigation schemes Criteria
Small-scale schemes < ha ha
Medium-scale schemes > ha and < ha ha
Large-scale schemes < ha ha
Total number of households in irrigation Irrigated crops in full control irrigation schemes
Total irrigated grain production (wheat and barley) metric tons
• as % of total grain production %
Harvested crops
Total harvested irrigated cropped area 2005 13 388358 ha
• Annual crops: total 2005 13 388 358 ha
- Rice 2005 10 733 600 ha
- Rice-one 2005 4541 200 ha
- Rice-two 2005 3869200 ha
- Rice-three 2005 2323200 ha
- Maize 2005 1 269100 ha
- Soyabeans 2005 279900 ha
- Vegetables 2005 244388 ha
- Tobacco 2005 198200 ha
- Potatoes 2005 65420 ha
- Sweet Potatoes 2005 178300 ha
- Groundnuts 2005 324 000 ha
- Sugarcane 2005 95450 ha
• Permanent crops: total ha
Irrigated cropping intensity (on full control irrigation equipped area) 2005 199 %
Drainage - Environment
Total drained area 1990 3350 000 ha
- part of the area equipped for irrigation drained ha
- other drained area (non-irrigated) ha
• drained area as % of cultivated area %
Flood-protected areas ha
Area salinized by irrigation 1999 400 000 ha
[image:11.612.84.519.98.790.2]
-290 Irrigation in SoutlJiTn find Eastem Asia セ AQU4STAT Survey - 2011
TABLE 7
Role of irrigation in
Distribution of water managed areas by types, 2005 (ha)
agricultural production,
Irrigation 6722299
economy and society
Technical 4781 860 One of the main objectives of irrigation
Semi technical 1 257 197 <!e\'e!opment in Indonesia is ro achieve
683242 food self-sufficiency, panicularly
Cultivated wetland 3 133 317 since 1969 rice cultivation has been
- Village management 2088622 expanding. By promoting this kind of
- Cultivated 1 044695 rice production, combined with land
Total 9855616 development, irrigation rehabilitation
and crop intensification programmes, the country achieved rice self-sufficiency in 1984. Howeyer, because of the rapid rate of fertile agricultural land conversion ro non-agricultural lise (at an average rate of 50 000 ha/year), a prolonged period of drought and flood, precipitous environmental degradation, reduced subsidies for agricultural inputs and extension activities, rice self-sufficiency became unstable.
Since 1994, Indonesia has been importing rice to meet demand or to maintain a national buffer srock, which is managed by the Bureau of Logistic (BULOG) for market operation, if there is a rice scarcity, especially during the season. However, as a result of continuous efforts to
increase food production, Indonesia could achieve almost 100 percent of its rice requirements, The import level is significalldy lower (about 2 percent of total national rice production) compared to the past records.
[image:12.612.81.335.104.222.2]\'Vater resources and related infrastructure development have contributed to agricultural, local and national development through their contribution to increasing farmers' average income and consequent alleviating poverty.
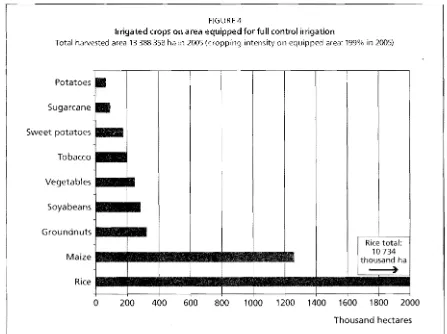
FIGURE 4
Irrigated crops on area equipped for full control irrigation
Total harvested area 13 388 358 ha in 2005 (cropping intensity on equipped area: 199% in 2005)
Potatoes
•
!Sugarcane
Sweet potatoes
セ@
Tobacco
Vegetables
1
Soyabeans
1
IGroundnuts
I
Rice total:10734
Iエィッオウ。ョ[セ。 Maize
Rice
I ...-.
o
200 400 600 800 1000 1200 1400 1600 1800 2000 [image:12.612.74.521.441.775.2]Indonesia 291
In 2005, the roul harvested area of paddy was 11.84 million ha (90.7 percem irrigated and 9.3 percent rainfed) which produced 54.15 ronnes of paddy.
In 2005 the rotal harvested irrigated cropped area was 13.39 million ha (Table 6 and Figure 4). The major crops cultivated under full control irrigation are paddy, which account for 10.73 million ha, followed by maize, groundnuts and soybeans, which account for 1.3 million ha, 0.32 million ha and 0.28 million ha respectively.
Most irrigated areas are planted with rice twice a year and are left fallow or planted with secondary crops (such as maize or Oiher) in the third season. Typical cropping patterns are rice-rice-fallow or rice-fice-secondary crop. In other areas, particularly those close to irrigation channels, rice can be planted lip to three times. In general, rice is always available in the field, but in a smaller area in the third season.
Status
In 1990 the total drained area was an estimated 3 350 000 ha.
Institutions
The Constitution of the Republic of Indonesia (Undang-Undang Dasar 1945) Article 33 states that, "production branches which are important to the counrry and which provide for the needs of the people must be controlled by the State. Earth and warer and all natural resources contained in their bodies are managed under authority of rhe State and utilized in the interests of the welfare of the nation". This enshrines the concept that Indonesia's natural resources belong to the state and are to be used for the welfare of the Indonesian people. Operational policy of this basic rule is explained in Law (Undang-Undang) number 7 of 2004.
This law reiterates the constitutional principle that water resources have a social function: water exploitation should be used for the highest prosperity of the people and should be controlled by the state. This law promulgates the institution of t\vo departments in association with water resources. The Department of Public Works is authorized to coordinate all efforts and activities for the planning, detailed supervision, business development, maintenance, as well as legislation and utilization of water resources, which also includes water springs. The Department of Mining and is authorized to manage groundwater resources, which also includes thermal spring waters. The institutional framework is, in fact, relatively complex, because it involves many and each agency might produce individual regulations (including Government Regulation, Presidential Decrees and Decisions, Ministerial Regulations, Directorate Regulations, Governor and District Regulations) to control water resources (Syaukat, 2000).
Water management
Issues of water resources management, both quantitative and qualitative, are increasingly important on Java and on other islands, including Kalimantan, Sumatra, Sulawesi, Papua, but with different types of problems and hence different approaches to be undertaken. Problems in Java are characterized by overpopulation, as well as water and other natural resources degradation and depletion. The other islands are mainly characterized by water and other natural resources degradation because of widespread deforestation and improper open mining practices and new plantations.
292 lrrigation ill Southern and Eastern Asia - AQUAST,1T Sur!Jey - 2011
is mainly the result of a strong decrease in the levels of deep groundwater in areas with high groundwater extraction. Over-extraction of groundwater resulrs in external costs including those related to the lowering of the shallow gtoundwater table and the table in deep wells, and costs related ro land subsidence and pollution of shallow groundwater (Syaukat, 2000).
These conditions require an improvement in water resources management in Indonesia. There should be an integrated management and treatment of both surface water and groundwater. \\lith this approach, a better water resources planning, development and management could be attained.
Finances
From the end of the 19605, the government made large investments in land and water resources development to achieve food self-sufficiency. However, as Indonesia gained confidence in securing its national food supply, attention gradually began to include the industrial sector, to
support export promotion and import substitution. Therefore, since the beginning of 1990, government investments in land and water resources have gradually decreased. In this period, investments in land and water resources focused on improved operation and maintenance of irrigation infrastructure and facilities.
Funding for the development of this sectOr came from national budgets and imernational donors. These includied the International Bank for Reconstruction and Development (IBRD), Japan International Cooperation Agency OICA), Japan Bank for International Cooperation UBIC), and the Asian Development Bank (ADB). For example, IBRD financed groundwater development projects in 11 provinces from 1993 to 1999, and integrated tidal s\vamp development in three provinces from 1994 to 2000. The ADB fll1anced irrigation sector projects in four provinces in Sulawesi from 1994 to 2000. The main objective of all these projects is to increase land productivity and food crop production.
Policies and legislation
During the government period 2004-2009, the following five strategic policies on water resources management were determined:
\Vater resource conservation: This policy is designed to conserve and maintain the availability and functions of water resources in order to meet the water needs not only for current genetation, bur also for the furure generations. The efforts are directed towards increasing water availability, to improving water quality, as well as ro recovering and improving the capacity of the environment.
• Optimal use of water resources: This policy includes various efforts in the provision, use, development and management of water resources to meet the various water demands: household, agriculture, municipalities, industries, electricity, tourism and environment. • Control of potential water-destructive capacity: This policy aims to reduce and copw with
the potential impacts of flood, drought, erosion and abrasion on the area of agricultural and industrial production, human settlement and other infrastructure. The efforts include preventive measures to protect production and settlement areas, and public infrastructure from floods, to recover environmental conditions, and to improve community alertness on the issues of floods and other potential damage caused by water.
293
Indonesia
Increasing transparency and availability of data and information on water resources management: This policy intends to push democratization in water resource managemenr. Transparency in the processes of water resource management should be improved to provide more access to all stakeholders to participate in the implementation of water resources development programmes.
The laws and regulations concerning water resources and their management are as follows:
, Indonesian Law Number 7, year 2004: water resources laws y Government Regulation Number 77, year 2001: irrigation
'r Government Regulation Number 82, year 2001: water quality management and ,vater pollution control
y Government Regulation on water resource management
'Y Government Regulation on management of water resources in river system .,. Government Regulation on financing water resource development
;,. Government Regulation on rivers 'Y Government Regularion on groundwater
>
Government Regulation on drinking waterY Government Regulation on Perum Jasa Tina I .,. Government Regulation on Perum Jasa Tifta II
'Y Presidential Instruction Number 3, year 1999: policy reformation on irrigation management
.,. Presidential Decree Number 9, year 1999: coordination team on river water use and development policies
, Presidential Decree Number 123, year 2001 (renewed by President Decree Number year 2002): coordination team on water resources management
y Decision of the Coordinator Ministry on Economy, and Industry
>
Decision of the Coordinator Ministry on Economy>-
Decision of the Ministry of Settlements and Regional Infrastructures (Dept of Public Works)y Decision of the Ministry of Internal Affairs
>-
Decision of the Ministry of Environment>-
Provincial Regulations on formation of the agencies for water resources development (8 provinces)Y Provincial Regulations on water pollution control (4 provinces)
>-
Governor Decisions on development of the Coordination Teams for Provincial Water Resources Management (8 provinces)>-
District and Municipality Regulation concerning water resources for domestic, agricultural and industrial use.ENVIRONMENT AND HEALTH
The strategic geographical location, accompanied by high rainfall, mountainous geography, as well as large forest resources, have led Indonesia to be rich in water resources. However, environmental changes are influencing the water cycle, which causes uneven distribution of water supply. The imbalanced water supply is a serious problem, since it might lead to a number of natural disasters. Flooding occurs during the rainy season, while drought is frequent in the dry season.
Massive deforestation and environmental degradation have been caused by these extreme conditions. Massive deforestation in the upper parts of the watershed has caused the rainfall
-294 IrrigatioJ/ in Southern and Eastern Asia in figures -AQUASFAF Survey 2011
seriously polluted. It has nor been possible (0 quantify the costs of pollution to the economy, but
major COStS have been identified in sickness and the resulting loss of work; pollurion is so severe in major cities, such as Jakarta and Surabaya, that industries have been forced to dose during dry years because of raw \vater shortages. Costs have also been accounted by calculating the losses in fisheries and aquaculture, and by the damage suffered by mangroves and fragile coastal areas.
\Yater pollution poses an immediate threat (0 human welfare and industrial growth. This problem
is exacerbated by water shortage in the dry season, which prevents waste from being flushed away from the inhabited centers. The most excessive pollutant in Indonesian rivers is faecal coliform from human waste. This element exceeds the recommended standards in key citics by a thousand-fold or more. \'Vater-bornc diseases such as cholera, dysentery, gastroenteritis, typhoid, paratyphoid, hepatitis A, and parasitic intestinal infection, are transmitted
by
the ingestion of water contaminated with human feces. The transmission of these diseases is frequently related(0 lack of available safe water. Improvement of water and sanitation can be expected to reduce diarrheal mortality and morbidity.
The number of people with AIDS and HIV infection is reported to have increased over time. In 2004, the number of people witb AIDS was 2 682, of tbese 700 people have died. This showed that the AIDS rate was about 1.33 cases per 100 000 people. In 2005, there were 5 560 people infected with HJV/AIDS.
PROSPECTS fOR AGRICULTURAL
MANAGEM
Issues of water resources management will be increasingly important in the vears ahead, especially in Java, which covers only 7 percent of the total area of the country, but has 59 percent of tbe population, 70 percent of irrigated agriculture, and 75 percent of the industry. Issues of water quantity include emerging conflicts between competing uses (agricultural, industrial and municipal), and between surface water and groundwater in rapidly growing urban areas. While Java is endowed with rainfall, it is highly seasonal. Dry season flows in the main rivers are only 20 percent of the annual flows. River basins on Java are relatively steep and short, and most of the wet season water runs unused inro the sea. Reservoirs hold less than 5 percent of total river flows.
During the wet season, river flows bring high rates of sedimentation resulting from excessive erosion in the upstream part of the basin. This causes very fast sedimentation rates in reservoirs and lakes, making the lifetime of reservoirs shorter than planned, as well as reducing storage capacities. Most of the reservoircapacity of major river basins in Java (Bengawan Solo, Brantas, Citarum, Serayn-Bogowonro) was planned to meet the water demand for various uses up to
2010. While additional sites have been identified for future dams, implementation will be constrained by high population densities and the social and economic costs of resettlement.
Though industrial and municipal water use is still relatively low, it will increase over time. Meeting this demand will require a transfer of water in dry season from agriculture to municipal and industrial use. Minimizing the social and economic cOSts for farmers and potential disruption to agricultural output will require that water resources will be managed according
to the integrated river basin principle. The challenge of meeting the water demand during the dry season is becoming even more complex if the pollution from growing urban and industrial waste is considered.
-Indonesia 295
effort. The policy is addressing water quamit)' and quality for both surface water and groundwater in the comext of river basins, including the upper parts of the basins and estuarine areas. A specific 」セIューッョ・ョイ@ of the policy is dealing with environmentally and socially sensitive swampland development issues.
The future of irrigation should be considered as an integral framework to increase human welfare,
to provide social justice, and to maimain ecosystem sustainability. Along with overcoming water and land resources problems, some national action should be taken, including: improving agricultural infrastructure, increasing the quality of intensification, improving the institutions, conducting reforestation and re-greening programmes.
MAIN SOURCES OF INFORMATION
Bakorsurtanal. 2001. Nemctz Sumberdaya Air Sptlsil1i fv:1sional (N1tional !:-'patial \{/(zter Balance).
Bappenas. 2004. Sumberd{qa Alam dan Lingkungtln Hidup Indonesia: Altura Krisis elm Pelutll1g (Natuml I'csources and environments Indonesia: between crisis and Bappenas, Jakarta.
Department of Public Works. 2006. Buku Induk Kestatistikan Pekeljtlili1 Umum lahun 2006. Sekretarian Jenderal Pusdata, Departemen Pekerjaan U1l1Ull1, Jakarta.
FAO. 1999. Irrigation in Asia in figures. FAG i¥ft1ter Report 18. FAO, Rome.
FAO. 2003. Review of world water resources by country. FAG W't1ter Report 23. FAO, Rome.
Irianto, Gatot. 2007. Pe1'Ubahan lkfim Terhadap Ketersediaan Air (Bahim Presentasi). Direktorat Jenderal Pengelolaan Lahan Dan Air, Departemen Pertanian RI, Jakarta.
Ministry of Public Works. 2006. Rekapitulasi Daerah Tahun 2005. (Available at: http:// W\vw. pu.go.idl publiklind!produk/info_statistik! _index. asp, accessed August 19, 2009). Pasandaran, Effendi. 2006. Politik Ekonomi Sumberdaya Air (Political economy of water
resources)' Ch,1pter I in: Effindi Pasandaran, Bambang Sayaka, and Tri Pranadji 2006, Pengelolaan Lahan dan Air di Indonesia (Land and water mantlge1l1ent in Indonesia). Badan Penelitian dan Pengembangan Perranian, Departmen Pertanian, Jakarta.
Statistics Indonesia. 2005. Agricultural survey: land area by utilization in Indonesi,1 2005. Statistics Indonesia, Jakarta.
Statistics Indonesia. 2006. Environmental statistics of Indonesia 2005. Statistics Indonesia, Jakarta.
Statistics Indonesia. 2007. Statistical year book ofIndonesia 2007 Statistics Indonesia, Jakarta.
Suprapto, Ato. 2001. Land and water resources development in Indonesi{l in FAG (2002). Investment in Land and \Vater, Proceedings of the Regional Consultation, Bangkok, Thailand, 3-5 October 2001.
Syaukat, Yusman. 2000. Economics ofintegrated surface and ground water use management in the jakarta region, Indonesia. PhD Dissertation, University of Guelph, Ontario, Canada.
Witoelar, Erna. Undated. "Water in the twenty-first century Looming the aisis: integrated water management in Indonesia. Ministry of Settlements and Regional Infrastructure, Jakarta.