DOI:
10.12928/TELKOMNIKA.v13i4.2047
1133
Fundamental Review to Ozone Gas Sensing Using
Optical Fibre Sensors
Michael David
1*, Mohd Haniff Ibrahim
2, Sevia Mahdaliza Idrus
3, Tay Ching En Marcus
4 1,2,3,4Lightwave Communication Research Group, Innovative Engineering Research Alliance, Department of Telecommunication Engineering, Faculty of Electrical Engineering,
Universiti Teknologi Malaysia, 81310 Skudai, Johor, Malaysia
1
Department of Telecommunication Engineering, School of Engineering and Engineering Technology, Federal University of Technology, Minna. Nigeria
*Corresponding author, email: [email protected]; [email protected]
Abstract
The manuscript is a review of basic essentials to ozone gas sensing with optical methods. Optical methods are employed to monitor optical absorption, emission, reflectance and scattering of gas samples at specific wavelengths of light spectrum. In the light of their importance in numerous disciplines in analytical sciences, necessary integral information that serves both as a basis and reference material for intending researchers and others in the field is inevitable. This review provides insight into necessary essentials to gas sensing with optical fibre sensors. Ozone gas is chosen as a reference gas. Simulation results for ozone gas absorption cross section in the ultraviolet (UV) region of the spectrum using spectralcalc.com simulation have also been included.
Keywords: Absorption spectroscopy, Beer- Lambert law, optical fibre, optical method, ozone gas, sensors
Copyright © 2015 Universitas Ahmad Dahlan. All rights reserved.
1. Introduction
In the field of analytical sciences, optical methods have become very relevant to
numerous disciplines [1]. Optical methods are employed to monitor optical absorption, emission,
reflectance and scattering of gas samples at specific wavelengths of light spectrum [2].
Newton’s discovery of the solar spectrum in 1966 is considered to be the beginning of
spectroscopy [3]. The entire spectrometric methods solely rely on emission or absorption of
electromagnetic radiation [4]. Optical method relevance to science and other disciplines has
made it necessary to put together in one piece essential fundamentals which could be a ready
guide for all users. The necessity of a review manuscript which is intended to be a reference
material is inevitable. This review provides insight into vital fundamentals to gas sensing with
optical fibre sensors. It is comprised of optical sensor mechanism [5], advantages of optical
sensors [6, 7], optical sensor classification [8], optical gas cells classification [9], Beer-Lambert
law [10] and ozone gas and its research challenges [11-13]. Ozone is a trace gas in the
atmosphere [14] and is discovered in 1839 [15]. Ozone is a useful gas, but it is a threat to
human life [16-19]. Ozone gas relevance has been previously emphasised by the authors [13].
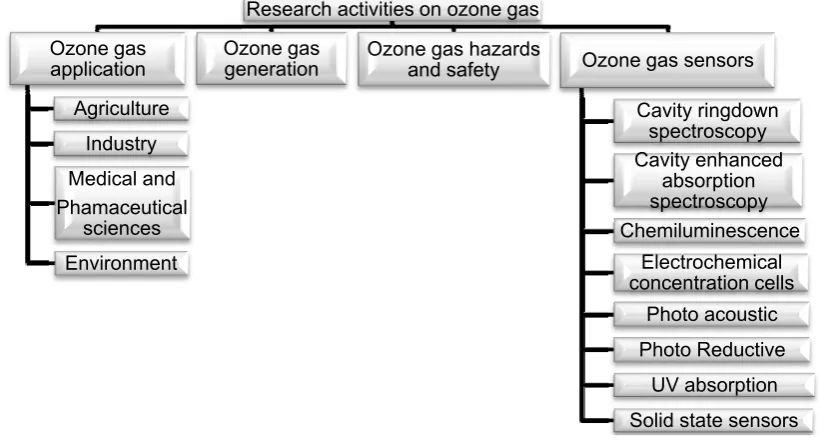
Significant volume of research activities which are not just limited to detection and monitoring
are devoted to ozone gas [20-28]. These activities are summarised in Figure 1. Relevant
simulation software (spectracalc.com) was used to obtain simulation results for ozone gas
absorption cross section.
2. Mechanism of Optical Sensors
Figure 1. Research Activities on Ozone gas
The interaction of light with matter can be in any one of the following ways: absorption,
diffraction, dispersion, reflectance, and interference [1]. Electromagnetic radiations are
absorbed by chemical compounds containing covalent bonds. This is as a result of different
mechanisms whose effects are seen throughout the electromagnetic spectrum [5]. Absorption of
light by a molecule at a given frequency is caused by electron resonance at that given
frequency [5, 30]. Light absorption by ozone gas in ultra violet (UV) region (200 to 400 nm, 6.2
to 3.0 electron volt ((eV)) as well as in the visible region (400 to 780 nm, 3.1 to 1.6eV) of the
light spectrum [5, 31] is caused by excitation of valence electrons in the atoms of molecules.
Light absorption in microwave region (0.3 to 300 cm,) is due to a change in rotation of the bonds
in a molecule. Absorption of light in the infrared region (3 to 50
μ
m, 0.4 to 0.025 eV) and near
infrared (0.78 to 3
μ
m, 1.6 to 0.4 eV) occurs due to the vibration of the bonds of a molecule [32].
While discussion of this paper is focus on absorption spectroscopy, there are other
classes of optical sensors such as:
Reflection spectroscopy [33, 34]
Luminescence intensity spectroscopy [35]
Fluorescence
lifetime
spectroscopy [36]
Refractive index spectroscopy [37]
Surface Plasmon resonance or ellipsometric spectroscopy [38]
The classifications are meant to give a clear picture and are not discussed further.
Ozone, the gas of interest in this article, absorbs light intensity and hence absorption
spectroscopy is dwelled upon in other sections of this article.
Measurement of radiation absorbed by atoms is described as atomic absorption
spectroscopy (3). The history of optical sensors can be traced back to when pH indicator strips
were developed by immobilizing pH-sensitive indicators on cellulose. The absorption spectrum
of each species is unique and can be used to identify and quantify presence of that specie.
3. Merits of Fibre Sensors
The authors have previously [13] highlighted quite a number of different methods for
detecting ozone gas such as: cavity enhanced absorption spectroscopy (CEAS) [39, 40], cavity
ring down spectroscopy [41], chemiluminescence [42, 43], electrochemical concentration cells
[44], photo-acoustic sensors [45, 46], photo reductive [47], solid state sensors [48] and UV
absorption [49]. Authors of reference [50] have shown the compatibility of fibre sensors with
optical communication systems and their application in electrical noisy systems and explosion
Research activities on ozone gas
Ozone gas
application
Agriculture
Industry
Medical and
Phamaceutical
sciences
Environment
Ozone gas
generation
Ozone gas hazards
and safety
Ozone gas sensors
Cavity ringdown
spectroscopy
Cavity enhanced
absorption
spectroscopy
Chemiluminescence
Electrochemical
concentration cells
Photo acoustic
Photo Reductive
prone scenarios. They offer good resistance to corrosion prone environments and high-voltage
and high-temperature environments. In Table 1, we compare the performance of optical
spectroscopy with other sensing methods.
Table 1. Gas sensors comparison
Sensor Type Merits Demerits
Photo acoustic Spectroscopy
High sensitivity
Response time is fast
Measurement is free from background noise
Requires no reference as a result of noise(51)
Selectivity is poor for photo acoustic system that utilises infrared light sources (52)
Photo reductive gas sensor
Good sensitivity
Short response time
Inexpensive
Temperature requirement is high
Energy dissipation is high (53, 54)
Electro-chemical Sensors
They are portable
Exhibits high sensitivity.
They are inexpensive (55)
There is the depletion of electrolyte when used for sensing high ozone concentrations.
It requires frequent maintenance (56, 57)
Metal oxide ozone sensors
Broad range of application (58) High temperature requirements of detectors which translate into:
High energy consumption.
High cost
Fabrication and size limitations
(55, 56, 59) Solid State Consumes less energy
Good sensitivity
Fast response time
Inexpensive
Light weight
Characteristic activity is high
Film sensor thickness requirement is large when applied for ozone sensing (56, 60, 61)
Chemilumines-cence.
Fast response time (43)
Requires to be calibrated within every one hour (every 1 to 60 minutes) (43). It is not absolute.
Optical spectroscopy
It is a rapid and direct means of sensing gases with good cross sensitivity (57) Require no consumables either for
calibration or operation
Anti-electric magnetic interference, Excellent electrical insulativity, and
Suitability of long-distance online measurement
Gas sample must be able in a distinct manner to either absorb, emit, or scatter transmitted light rays at specific region of the light spectrum (7, 57, 62);
Expensive
Large in size (6)
4. Sensor Classification
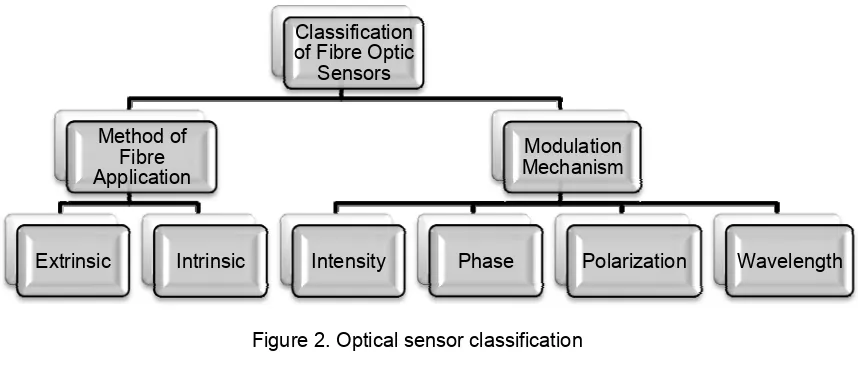
Fibre optic sensors can be classified based on method of fibre application in sensor
system and modulation mechanism [8]. The classification is illustrated in Figure 2.
Figure 2. Optical sensor classification
Classification
of Fibre Optic
Sensors
Method of
Fibre
Application
Extrinsic
Intrinsic
Modulation
Mechanism
4.1. Classification Based on Fibre Application
Fibre optic sensors are categorised into intrinsic and extrinsic types.
4.1.1. Intrinsic Optical Sensors
In an intrinsic fibre optic sensor, light is restricted within the optical fibre and modulation
of the light signal is within the fibre [8, 63]; it is illustrated in Figure 3.
Light Source
Detector
Sample
Signal
Fibre Optic Cable
Figure 3. An Intrinsic Fibre Optic Sensor
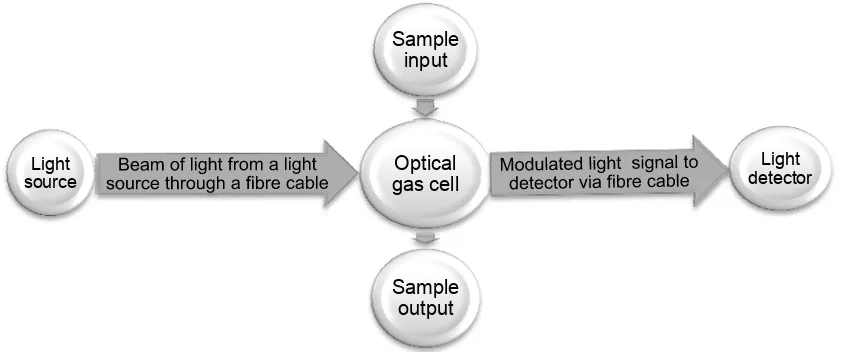
4.1.2. Extrinsic Optical Sensors
In an extrinsic sensor, interaction between light signal (i.e. light signal modulation) and
the sample to be measured takes place outside the optical fibre cable in a gas cell generally
referred to a cuvette [8, 64]. It is illustrated in Figure 4.
Figure 4. An Intrinsic Fibre Optic Sensor
4.2. Classification Based on Modulation Mechanism
In the application of light for sensing in fibre optic sensors, different characteristics of
light are modulated to achieve sensing. These characteristics include: intensity, phase,
polarization and wavelength [8]. Ozone gas measurement with optical absorption spectroscopy
is detected by light intensity modulation.
Optical
gas cell
Sample
input
Light detector
Sample
output
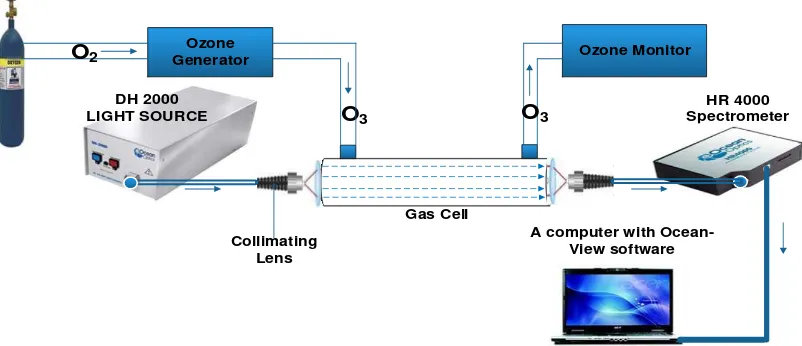
5. Basic Experimental Setup for Ozone Detection via Optical Absorption Spectroscopy
A typical absorption spectroscopic experimental setup is made up of the following
components: source of light radiation, a monochromator (except when light source is a laser).
Light sources can either be broadband or chromatic [65]. Light emanating from a broadband
light source must be propagated through a collimating lens to eliminate scattering effects. Light
coupler, waveguide (fibre, fibre bundle, planar wave guide), variable attenuator, lenses (optical),
cuvette (absorption cell or gas cell), light detection unit (spectrometer, photo detector), amplifier,
secondary filter, transducer, data acquisition unit, data processing unit, and display unit [1, 66].
Figure 5 is a typical experimental setup for ozone measurements using optical absorption
spectroscopy. It is the typical extrinsic setup.
HR 4000 Spectrometer Ozone
Generator
DH 2000 LIGHT SOURCE
A computer with Ocean-View software
Ozone Monitor
Gas Cell
Collimating Lens
O
3O
2O
3Figure 5. A basic layout of an optical absorption spectroscopy for ozone measurements
5.2. Classification of Gas Cells
The design of an optical gas cell in absorption spectroscopy is a major factor that
affects the overall system performance in the form of sensitivity and speed of response.
Authors of reference [9] have classified gas cells based on the principles of light transmission.
The classification includes transmission type, reflective type, slow light and refractive index
periodic change. More information on this can be obtained from reference [9].
6. Beer-Lambert Law
Absorption spectroscopy is the quantification of the energy that molecules absorb and
and is translated to the bending and stretching of the bonds between the atoms in the molecules
[67]. The working principle of gas cells in optical gas sensor is based on the Beer- Lambert law.
According to Beer and Lambert, the concentration of a sample can be determined by detecting
the intensity of the output light. Beer-Lambert law describes the relation of the input light and the
output light that are affected by the measuring gas.
Beer’s law: it states that the fraction of the incident light absorbed is proportional to the
number of the absorbing molecules in the light-path and will increase with increasing
concentration or sample thickness [10].
Lambert’s law: it states that the fraction of monochromatic light absorbed by a
homogeneous medium (sample) is independent of the intensity of the incident light and each
successive unit layer absorbs an equal fraction of the light incident on it [10].
ε
(1)
Where:
ε
= molar absorption coefficient (m
2mol
-1)
c = sample concentration (mol m
-3) and
= optical path length in (m)
In an experimental scenario, measurements are obtained in the form of transmittance T
defined as:
(2)
The ratio is defined as the transmittance T:
From equation 2, absorbance A can also be defined as:
A ln
= Optical density (D),optical depth (69) or optical thickness (70)
(3)
7. Absorption of Light by Ozone
Ozone gas detection via optical absorption spectroscopy is generally accepted [71].
This method has an inherent advantage to measure ozone absolutely without the requirement
for consumables to operate or calibrate [7]. Whereas, ozone measurement with the method of
chemiluminescence is not absolute, it has to be frequently calibrated. Chemiluminescence
technique requires to be calibrated every 1 to 60 minutes [43]. Ozone absorbs light in the
Hartley band (200–310 nm) [72], the Huggins band (310–375 nm), the Chappius band (375–603
nm), and the Wulf band (beyond 700 nm). It has peak absorption at 253.65nm (
..
/molecule
) (73) and 603nm (
.
/molecule
) (64).
7.1. The Absorption Cross Section of Ozone
Error free measurement of ozone gas is dependent upon ozone gas absorption cross
section [74]. Hence, lots of research efforts are devoted to investigate the accurate value of
ozone absorption cross section [64, 75-78]. Spectralcalc.com simulator has been used in this
review to show the effect of temperature on absorption cross section in the Hartley band. Figure
6 shows absorption cross section of ozone gas obtained by simulation with spectralcalc.com at
temperatures of 200 K and 300 K respectively. Ozone gas absorption cross section at 253.65
(actual spectral line is 253.6526 nm) is
.
/molecule
and
.
/
molecule
at temperatures of 200 K and 300 K respectively. Absorption cross section decreases
with increase in temperature from 200 K to 300 K. The percentage decrease is 0.95 % at a
measurement wavelength of 253.6 nm. Malicet et al reported a decrease of 1 % in absorption
cross section for a temperature rise from 218 K to 295 K [79]. Similarly, Serdyuchenko et al
reported a slight decrease in absorption cross section with temperature increase in the Hartley
band [80]. The result thus obtained is in good agreement with previous works.
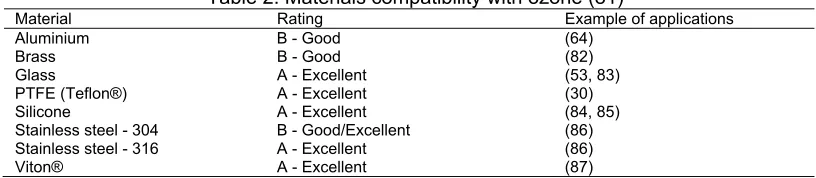
8. Materials Compatibility with Ozone
Not all materials are compatible with ozone gas. Ozone gas compatibility with common
materials used for ozone sensing in literature is compared in Table 2.
Figure 6. Spectralcalc.com simulation of ozone absorption cross section at 200K and 300K
Table 2. Materials compatibility with ozone (81)
Material Rating Example of applications
Aluminium B - Good (64)
Brass B - Good (82)
Glass A - Excellent (53, 83)
PTFE (Teflon®) A - Excellent (30)
Silicone A - Excellent (84, 85)
Stainless steel - 304 B - Good/Excellent (86) Stainless steel - 316 A - Excellent (86)
Viton® A - Excellent (87)
9. Research Challenges
Recent research activities on ozone gas sensing with optical absorption spectroscopy
include sensitivity enhancement through optical path length and ozone gas absorption cross
section optimization [88] and effect of noise reduction on absorption cross section of ozone gas
in the visible spectrum [89]. Redefinition of the value of ozone gas absorption cross section in
the UV for accurate measurements of ozone gas [90] and preservation of linearity of
Bear-Lamberts law by measuring ozone gas concentration at an alternate sampling wavelength of
279.95 nm [85, 91]. Ozone gas measurement in the visible spectrum using LED as a light
source at 605 nm [92] and sensitivity enhancement through light propagation at incident angle
[93]. Temperature and pressure dependence of ozone gas absorption cross section in the UV
and visible spectrums [80, 94]. Performance indicators/metrics of ozone sensors and sensors in
general include selectivity, sensitivity, accuracy, resolution, response time, fabrication cost,
dynamic range, precision and linearity [58, 95-99]. Sensor requirements either in performance,
physical, or cost, are application dependent [100]. Research activities on sensors in general
and ozone sensors in particular, are aimed towards meeting recent sensing requirements,
strengthening and upgrading some or all of the aforementioned parameters [11, 12, 49].
10. Conclusions
The review paper summarises necessary information. It is a ready reference material
for new researchers in the field of absorption spectroscopy for ozone sensor application. Issues
discussed include basic operating principles of optical sensors and its mechanism. Optical
sensors as well as optical gas cells were classified. Specific properties of ozone gas were also
highlighted. Recent research activities have been enumerated. Spetralcalc.com simulation
software was used to demonstrate possibility of obtaining preliminary results before experiments
are conducted.
240 260 280 300 320 340 360
10-24
10-22
10-20
10-18
10-16
wavelength (nm)
A
b
s
o
rp
ti
o
n
cr
o
s
s se
ct
io
n
(
lo
g10
cm
2/m
o
lec
ul
e) 300 K
200 K Hartley
Band
Acknowledgements
The authors would like to thank Universiti Teknologi Malaysia (UTM) for sponsoring this
publication under Research University Grant (RUG) Scheme, grant no: 05J60 and 04H35. The
Ministry of Higher Education (MOE) Malaysia is acknowledged for provision of Fundamental
Research Grant Scheme (FRGS) grant no: 4F317 and 4F565. The Nigerian Education Trust
Fund (ETF) is also acknowledged for the financial support giving inform of Tertiary Education
Trust Fund (TET-Fund).
References
[1] Otto SW. Fibre Optic Chemical Sensors and Biosensors Volume I. CRC Press Boca Raton Ann Boston London. 1991: 2 & 26.
[2] Department of Chemistry. Beer-Lambert Law. The University of Adelaide Australia http://wwwchemistryadelaideeduau/external/soc-rel/content/beerslawhtm Accessed online on 12th February, 2013.
[3] Ebdon L, Evans EH. An introduction to analytical atomic spectrometry. John Wiley & Sons. 1998. [4] Fifield F, Kealey D. Analytical Chemistry: principles and practice. Blackwell Science, Ltd.: Malden,
MA; Fifth Edition. 2000: 270.
[5] Mulrooney J, Clifford J, Fitzpatrick C, Chambers P, Lewis E, editors. Detection of carbon dioxide emissions from a land transport vehicle using a mid-infrared optical fiber based sensor. Optics East 2006; 2006: International Society for Optics and Photonics.
[6] Gaddari A, Berger F, Amjoud M, Sanchez J, Lahcini M, Rhouta B, et al. A novel way for the synthesis of tin dioxide sol–gel derived thin films: Application to O 3 detection at ambient temperature. Sensors and Actuators B: Chemical. 2013; 176: 811-7.
[7] Gomez A, Rosen E. Fast response cavity enhanced ozone monitor. Atmospheric Measurement Techniques. 2013; 6(2).
[8] Yu M. Fiber Optic Sensor Technology. Sensors and Actuators Laboratory, Department of Mechanical Engineering, University of Maryland, USA https://wwwgooglecom/#q=Fiber+Optic+Sensor+Technology+Miao+Yu. 2008.
[9] Zhao Y, Bai L, Zhang YN, Hou W, Wang Q. Review On Structures And Principles Of Gas Cells In The Absorption Spectrum–Based Optical Fiber Gas Sensor Systems. Instrumentation Science & Technology. 2012; 40(5): 385-401.
[10] Singh D, Deshwal B, Kumar VS. The absorption laws and measurement of absorption intensity. Comprehensive Engineering Chemistry. IK International Publishing House, New Delhi. 2008: 259. [11] Fang J, Park SC, Schlag L, Stauden T, Pezoldt J, Jacobs HO. Localized Collection of Airborne
Analytes: A Transport Driven Approach to Improve the Response Time of Existing Gas Sensor Designs. Advanced Functional Materials. 2014.
[12] Colindres SC, Aguir K, Cervantes Sodi F, Vargas LV, Salazar JAM, Febles VG. Ozone Sensing Based on Palladium Decorated Carbon Nanotubes. Sensors. 2014; 14(4): 6806-18.
[13] David M, Ibrahim MH, Idrus SM, Azmi AI, Ngajikin NH, Marcus TCE, et al. Progress in Ozone Sensors Performance: A Review. Jurnal Teknologi. 2015; 73(6).
[14] Janssen C, Simone D, Guinet M. Preparation and accurate measurement of pure ozone. Review of Scientific Instruments. 2011; 82(3): 034102.
[15] Von Sonntag C, Von Gunten U. Chemistry of Ozone in Water and Wastewater Treatment. IWA Publishing. 2012.
[16] Rubin MB. The history of ozone. The Schönbein period, 1839–1868. Bull Hist Chem. 2001; 26(1): 40-56.
[17] Brimblecombe P. Interest in air pollution among early Fellows of the Royal Society. Notes and records of the Royal Society of London. 1978; 32(2): 123-9.
[18] Roscoe HK, Clemitshaw KC. Measurement techniques in gas-phase tropospheric chemistry: A selective view of the past, present, and future. Science. 1997; 276(5315): 1065-72.
[19] Udhayakumar G, Rashmi M, Patel K, Ramesh G, Suresh A. Supply Power Factor Improvement in Ozone Generator System Using Active Power Factor Correction Converter. International Journal of Power Electronics and Drive Systems (IJPEDS). 2015; 6(2).
[20] David M, Marcus TCE, Yaacob M, Salim MR, Hussin N, Ibrahim MH, et al. A New Ozone Concentration Regulator. TELKOMNIKA Indonesian Journal of Electrical Engineering. 2015; 13(2). [21] Facta M, Salam Z, Buntat Z. A New Type of Planar Chamber for High Frequency Ozone Generator
System. Advanced Materials Research. 2014; 896: 726-9.
[22] Facta M, Sutikno T, Salam Z. The Application of FPGA in PWM Controlled Resonant Converter for an Ozone Generator. International Journal of Power Electronics and Drive Systems (IJPEDS). 2013; 3(3): 336-43.
[24] Kumharn W, Sudhibrabha S. Study of ozone and sulfur dioxide using Thailand based Brewer Spectrophotometers. Advances in Space Research. 2014; 53(5): 802-9.
[25] Li YL. Experimental Investigation on Ozone Mass Transfer Coefficient Enhanced by Electric Field in Liquid Phase. Advanced Materials Research. 2014; 864: 2139-44.
[26] Costagliola MA, Murena F, Prati MV. Exhaust emissions of volatile organic compounds of powered two-wheelers: Effect of cold start and vehicle speed. Contribution to greenhouse effect and tropospheric ozone formation. Science of the Total Environment. 2014; 468: 1043-9.
[27] Lefohn AS, Emery C, Shadwick D, Wernli H, Jung J, Oltmans SJ. Estimates of background surface ozone concentrations in the United States based on model-derived source apportionment.
Atmospheric Environment. 2014; 84: 275-88.
[28] Guo WQ, Yin RL, Zhou XJ, Du JS, Cao HO, Yang SS, et.al. Sulfamethoxazole degradation by ultrasound/ozone oxidation process in water: Kinetics, mechanisms, and pathways. Ultrasonics sonochemistry. 2015; 22: 182-7.
[29] López-Higuera JM. Optical sensors: Ed. Universidad de Cantabria; 1998.
[30] O'Keeffe S, Dooly G, Fitzpatrick C, Lewis E, editors. Optical fibre sensor for the measurement of ozone. Journal of Physics: Conference Series. 2005: IOP Publishing.
[31] Arshak K, Hickey G, Forde E, Harris J, editors. Development of novel room temperature ozone sensors for health and safety applications. Electronics Technology, 30th International Spring Seminar on; 2007: IEEE.
[32] Degner M, Damaschke N, Ewald H, Lewis E, editors. High resolution LED-spectroscopy for sensor application in harsh environment: A sensor system based on LED-light sources and standard photodiode receiver is shown as an example of this sensor concept for in-situ gas measurements down to the ppb range. 2010 IEEE International Instrumentation and Measurement Technology Conference, I2MTC 2010, May 3, 2010 - May 6, 2010; 2010; Austin, TX, United states: IEEE Computer Society.
[33] Reynolds CS. Measuring black hole spin using x-ray reflection spectroscopy. The Physics of Accretion onto Black Holes: Springer; 2015. p. 277-94.
[34] Garcia JA, Dauser T, Steiner JF, McClintock JE, Keck ML, Wilms J. On Estimating the High-Energy Cutoff in the X-ray Spectra of Black Holes via Reflection Spectroscopy. arXiv preprint arXiv:150503616. 2015.
[35] Cavalli E, Angiuli F, Belletti A, Boutinaud P. Luminescence spectroscopy of YVO 4: Ln 3+, Bi 3+(Ln 3+= Eu 3+, Sm 3+, Dy 3+) phosphors. Optical Materials. 2014; 36(10): 1642-8.
[36] Coda S, Thompson AJ, Kennedy GT, Roche KL, Ayaru L, Bansi DS, et al. Fluorescence lifetime spectroscopy of tissue autofluorescence in normal and diseased colon measured ex vivo using a fiber-optic probe. Biomedical optics express. 2014; 5(2): 515-38.
[37] Zarzana KJ, Cappa CD, Tolbert MA. Sensitivity of Aerosol Refractive Index Retrievals Using Optical Spectroscopy. Aerosol Science and Technology. 2014; 48(11): 1133-44.
[38] Del Rosso T, Sánchez J, Carvalho R, Pandoli O, Cremona M. Accurate and simultaneous measurement of thickness and refractive index of thermally evaporated thin organic films by surface plasmon resonance spectroscopy. Optics express. 2014; 22(16): 18914-23.
[39] Darby SB, Smith PD, Venables DS. Cavity-enhanced absorption using an atomic line source: application to deep-UV measurements. Analyst. 2012; 137(10): 2318-21.
[40] Gomez A, Rosen E. Fast response cavity enhanced ozone monitor. Atmospheric Measurement Techniques Discussions. 2012; 5(5): 7223-41.
[41] Washenfelder R, Wagner N, Dube W, Brown S. Measurement of atmospheric ozone by cavity ring-down spectroscopy. Environmental science & technology. 2011; 45(7): 2938-44.
[42] Ermel M, Oswald R, Mayer JC, Moravek A, Song G, Beck M, et al. Preparation methods to optimize the performance of sensor discs for fast chemiluminescence ozone analyzers. Environmental Science and Technology. 2013; 47(4): 1930-6.
[43] Zahn A, Weppner J, Widmann H, Schlote-Holubek K, Burger B, Kühner T, et al. A fast and precise chemiluminescence ozone detector for eddy flux and airborne application. Atmospheric Measurement Techniques. 2012; 5(2): 363-75.
[44] Eastman JA, Stedman DH. A fast response sensor for ozone eddy-correlation flux measurements. Atmospheric Environment (1967). 1977; 11(12): 1209-11.
[45] Bottger S, Kohring M, Willer U, Schade W. Off-beam quartz-enhanced photoacoustic spectroscopy with LEDs. Applied Physics B: Lasers and Optics. 2013; 113(2): 227-32.
[46] Gondal MA, Dastageer A, Yamani ZH. Laser-induced photoacoustic detection of ozone at 266 nm using resonant cells of different configuration. Journal of Environmental Science and Health - Part A Toxic/Hazardous Substances and Environmental Engineering. 2009; 44(13): 1457-64.
[48] Mastelaro VR, Zílio SC, da Silva LF, Pelissari PI, Bernardi MI, Guerin J, et al. Ozone gas sensor based on nanocrystalline SrTi< sub> 1-x</sub> Fe< sub> x</sub> O< sub> 3</sub> thin films.
Sensors and Actuators B: Chemical. 2013.
[49] Gao R, Ballard J, Watts L, Thornberry T, Ciciora S, McLaughlin R, et al. A compact, fast UV photometer for measurement of ozone from research aircraft. Atmospheric Measurement Techniques. 2012; 5(9): 2201-10.
[50] Diemeer M, Trommel E. Fiber-optic microbend sensors: sensitivity as a function of distortion wavelength. Optics letters. 1984; 9(6): 260-2.
[51] Kohring M, Willer U, Bottger S, Pohlkotter A, Schade W. Fiber-coupled ozone sensor based on tuning fork-enhanced interferometric photoacoustic spectroscopy. IEEE Journal on Selected Topics in Quantum Electronics. 2012; 18(5): 1566-72.
[52] Mao X, Zhou X, Zhai L, Yu Q. Dissolved Gas-in-Oil Analysis in Transformers Based on Near-Infrared Photoacoustic Spectroscopy. International Journal of Thermophysics. 2014: 1-7.
[53] Wu RJ, Chiu YC, Wu CH, Su YJ. Application of Au/TiO 2–WO 3 material in visible light photoreductive ozone sensors. Thin Solid Films. 2015; 574: 156-61.
[54] Chen MH, Lu CS, Wu RJ. Novel Pt/TiO2-WO3 materials irradiated by visible light used in a photoreductive ozone sensor. Journal of the Taiwan Institute of Chemical Engineers. 2014; 45(3): 1043-8.
[55] Wang Z, Qiu X, Tang R, Oiler J, Zhu J, Huang H, et al., editors. Ozone senosr using ZnO based film bulk acoustic resonator. 2011 16th International Solid-State Sensors, Actuators and Microsystems Conference, TRANSDUCERS'11, June 5, 2011 - June 9, 2011; 2011; Beijing, China: IEEE Computer Society.
[56] Wang CY, Becker R, Passow T, Pletschen W, Köhler K, Cimalla V, et al. Photon stimulated sensor based on indium oxide nanoparticles I: wide-concentration-range ozone monitoring in air. Sensors and Actuators B: Chemical. 2011; 152(2): 235-40.
[57] Dakin JP, Chambers P. Review of methods of optical gas detection by direct optical spectroscopy, with emphasis on correlation spectroscopy. Optical Chemical Sensors: Springer. 2006: 457-77. [58] Da Silva LF, Catto AC, Avansi Jr W, Cavalcante LS, Andres J, Aguir K, et al. A novel ozone gas
sensor based on one dimensional (1D) α-Ag 2 WO 4 nanostructures. Nanoscale. 2014.
[59] Yu JH, Yang HJ, Mo HS, Kim TS, Jeong TS, Youn CJ, et al. Sensing mechanism and behavior of sputtered ZnCdO ozone sensors enhanced by photons for room- temperature operation. Journal of Electronic Materials. 2013; 42(4): 720-5.
[60] Thirumalairajan S, Mastelaro VR, Escanhoela Jr CA. In-Depth Understanding of the Relation between CuAlO2 Particle Size and Morphology for Ozone Gas Sensor Detection at a Nanoscale Level. ACS applied materials & interfaces. 2014; 6(23): 21739-49.
[61] Korotcenkov G, Cho B. Ozone measuring: What can limit application of SnO 2-based conductometric gas sensors? Sensors and Actuators B: Chemical. 2012; 161(1): 28-44.
[62] Chambers P. A study of a correlation spectroscopy gas detection method: University of Southampton; 2005.
[63] Tracey PM. Intrinsic fiber-optic sensors. IEEE Transactions on Industry Applications. 1991; 27(1): 96-8.
[64] O’Keeffe S, Fitzpatrick C, Lewis E. An optical fibre based ultra violet and visible absorption spectroscopy system for ozone concentration monitoring. Sensors and Actuators B: Chemical. 2007; 125(2): 372-8.
[65] Fein H, Liu SY. Chemical sensing techniques employing liquid-core optical fibers. Google Patents. 2000.
[66] O'Keeffe S, Fitzpatrick C, Lewis E. Ozone measurement in visible region: an optical fibre sensor system. Electronics Letters. 2005; 41(24): 1317-9.
[67] Hardiman R, Mckee D, Kimmerle K. Qualitative Comparison of Cavity Ring-Down vs. Direct Measurement Absorption Spectroscopy of Determining ppb Moisture Levels in UHP Gases. Gases and Technology. 2004; 3(3).
[68] Denney RC. Dictionary of spectroscopy. Willey 2nd Edition. 1982: 119-20.
[69] En Marcus TC, David M, Yaacob M, Salim MR, Ibrahim MH, Ngajikin NH, et al. Absorption Cross Section Simulation: a Preliminary Study of Ultraviolet Absorption Spectroscopy for Ozone Gas Measurement. Jurnal Teknologi. 2013; 64(3).
[70] Larsen ML, Clark AS. On the link between particle size and deviations from the Beer–Lambert– Bouguer law for direct transmission. Journal of Quantitative Spectroscopy and Radiative Transfer. 2014; 133: 646-51.
[71] Köhring M, Willer U, Böttger S, Pohlkötter A, Schade W. Fiber-Coupled Ozone Sensor Based on Tuning Fork-Enhanced Interferometric Photoacoustic Spectroscopy. IEEE Journal of Selected Topics in Quantum Electronics. 2012; 18(5): 1566-72.
[73] Hearn A. The absorption of ozone in the ultra-violet and visible regions of the spectrum. Proceedings of the Physical Society. 1961; 78(5): 932.
[74] Bogumil K, Orphal J, Homann T, Voigt S, Spietz P, Fleischmann O, et al. Measurements of molecular absorption spectra with the SCIAMACHY pre-flight model: instrument characterization and reference data for atmospheric remote-sensing in the 230–2380 nm region. Journal of Photochemistry and Photobiology A: Chemistry. 2003; 157(2): 167-84.
[75] Griggs M. Absorption coefficients of ozone in the ultraviolet and visible regions. The Journal of Chemical Physics. 1968; 49: 857-9.
[76] Inn EC, Tanaka Y. Absorption coefficient of ozone in the ultraviolet and visible regions. JOSA. 1953; 43(10): 870-2.
[77] Vigroux E. Contribution à l'étude expérimentale de l'absorption de l'ozone, par Ernest Vigroux: Masson; 1953.
[78] Brion J, Chakir A, Daumont D, Malicet J, Parisse C. High-resolution laboratory absorption cross section of O< sub> 3</sub>. Temperature effect. Chemical physics letters. 1993; 213(5): 610-2. [79] Malicet J, Daumont D, Charbonnier J, Parisse C, Chakir A, Brion J. Ozone UV spectroscopy. II.
Absorption cross-sections and temperature dependence. Journal of atmospheric chemistry. 1995; 21(3): 263-73.
[80] Serdyuchenko A, Gorshelev V, Weber M, Chehade W, Burrows J. High spectral resolution ozone absorption cross-sections–Part 2: Temperature dependence. Atmospheric Measurement Techniques. 2014; 7(2): 625-36.
[81] Solutions O. Material Compatibility with Ozone.
http://wwwozoneapplicationscom/info/ozone_compatible_materialshtm. 2015.
[82] Marcus TCE, David M, Yaacob M, Salim MR, Ibrahim MH, Ngajikin NH, et al. Interchangeable Range of Ozone Concentration Simulation for Low Cost Reconfigurable Brass Gas Cell. Jurnal Teknologi. 2014; 69(8).
[83] Yu J, Yang H, Mo H, Kim T, Jeong T, Youn C, et al. Sensing Mechanism and Behavior of Sputtered ZnCdO Ozone Sensors Enhanced by Photons for Room-Temperature Operation. Journal of electronic materials. 2013; 42(4): 720-5.
[84] Acuautla Mn, Bernardini S, Bendahan M. Ozone Sensor on Flexible Substrate by ZnO Nanoparticles. Key Engineering Materials. 2014; 605: 163-6.
[85] Marcus TC, David M, Yaacob M, Salim MR, Hussin N, Ibrahim MH, et al. Alternative wavelength for linearity preservation of Beer–Lambert Law in ozone concentration measurement. Microwave and Optical Technology Letters. 2015; 57(4): 1013-6.
[86] Teranishi K, Shimada Y, Shimomura N, Itoh H. Investigation of Ozone Concentration Measurement by Visible Photo Absorption Method. Ozone, Science & Engineering. 2013; 35(3): 229-39.
[87] Kondo T, Sakai K, Watanabe T, Einaga Y, Yuasa M. Electrochemical detection of lipophilic antioxidants with high sensitivity at boron-doped diamond electrode. Electrochimica Acta. 2013; 95: 205-11.
[88] Marcus TCE, Ibrahim MH, Ngajikin NH, Azmi AI. Optical path length and absorption cross section optimization for high sensitivity ozone concentration measurement. Sensors and Actuators B: Chemical. 2015; 221: 570-5.
[89] David M, Ibrahim MH, Idrus SM. Sampling frequency effect on the absorption cross section of ozone in the Visible Spectrum. Journal of optoelectronics and advanced materials. 2015; 17(3-4): 403 -8.
[90] Viallon J, Lee S, Moussay P, Tworek K, Petersen M, Wielgosz R. Accurate measurements of ozone absorption cross-sections in the Hartley band. Atmospheric Measurement Techniques. 2015; 8(3): 1245-57.
[91] Marcus TC, David M, Yaacob M, Salim MR, Hussin N, Ibrahim MH, et al. Erratum for: Alternative wavelength for linearity preservation of Beer–Lambert law in ozone concentration measurement.
Microwave and Optical Technology Letters. 2015; 57(7): 1768-.
[92] Jodpimai S, Boonduang S, Limsuwan P. Inline ozone concentration measurement by a visible absorption method at wavelength 605nm. Sensors and Actuators B: Chemical. 2015.
[93] David M, Marcus TCE, Yaacob M, Salim MR, Hussin N, Ibrahim MH, et al., editors. Incident Angle Approach to Sensitivity Enhancement for Ozone Sensor. Applied Mechanics and Materials; 2015: Trans Tech Publ.
[94] Marcus TCE, David M, Yaacob M, Salim MR, Hussin N, Ibrahim MH, et al., editors. Pressure Dependence of Ozone Absorption Cross Section. Applied Mechanics and Materials; 2015: Trans Tech Publ.
[95] Proffitt MH, McLaughlin RJ. Fast‐response dual‐beam UV‐absorption ozone photometer suitable for use on stratospheric balloons. Review of scientific instruments. 1983; 54(12): 1719-28.
[97] Sarfraz J, Ihalainen P, Määttänen A, Gulin T, Koskela J, Wilén C-E, et al. A printed H< sub> 2</sub> S sensor with electro-optical response. Sensors and Actuators B: Chemical. 2014; 191: 821-7.
[98] Tsitron J, Kreller CR, Sekhar PK, Mukundan R, Garzon FH, Brosha EL, et al. Bayesian decoding of the ammonia response of a zirconia-based mixed-potential sensor in the presence of hydrocarbon interference. Sensors and Actuators B: Chemical. 2014; 192: 283-93.
[99] Liu H, Li M, Voznyy O, Hu L, Fu Q, Zhou D, et al. Physically Flexible, Rapid‐Response Gas Sensor Based on Colloidal Quantum Dot Solids. Advanced Materials. 2014.