Model of Risk Gas Pipeline Management
to Determine Maintenance Strategy
Yulita Veranda Usman
*, M. Yudi M. Sholihin
*, Asrul Harun Ismail
+, Rini Prasetyani
**+
Department of Industrial Engineering University of Pancasila, Jakarta Selatan, Indonesia
{yuli_ta, myudims, arinprasetyani}@yahoo.com +
Abstract
—
Piping system failure often does not occurs in accordance with the technical life of the pipe. The failure is caused by the specific content of the gas passing through the pipeline. The risk management system is designed on the model of the gas pipeline risk management that can estimate the level of risk to next five years which is the function of the probability and consequence of failure. The probability of failure is obtained based on the corrosion rate of the wall thickness of the pipe while the impact is determined based on the significance value of 0.3. Maintenance strategy will be determined based on the results of inspections conducted on each of three years and failure of attributes component.Key words – gas pipeline, risk management, pipline inspection
I. INTRODUCTION
Piping system failure often occurs due to leakage of gas pipeline that is not in accordance with the technical life of the pipe that had been planned at the time of installation. The part of pipeline that often leak is in the elbow. This happens because of erosion of the pipe caused by the specific content of the gas, such as CO2, H2S, and H2O passing through the
pipeline. It leads to a decrease in the number of planned gas production and financial losses, including costs to recover it when gas pipelines pass through public areas. This of course would threaten the safety of people and damage a variety of public and private facilities.
Therefore this research problem is how to make a model (formula) that can be used for decision making in which the model is resulted based on the analysis of risks to the operation of the gas piping system by taking into account technical and operational, security, and financial aspects of risk. The resulting model is expected to have an impact on the corrosion rate with regard to the reliability of the pipe material, security along the pipeline areas, and the operational and maintenance cost savings. The objectives of this research are to asses the condition of the gas pipeline risk in each section of the gas pipeline to design a risk management model that describes the function of the failure of probability and consequence along gas with recpect to inspection schedule. The time of inspection will determine the maintenance strategy of gas pipeline.
II. METHODOLOGY
This study used secondary data obtained by carrying out a review of technical and operational documents of gas pipeline to the results of previous research and other relevant standards, such as: API 5L and ASME B31.8. In addition, to ensure that the actual field conditions also conducted a survey by observation as well as interviews with community along the gas pipeline that crosses the territory of Tegal Gede, Cikarang to Citarik, Subang, West Java and gas pipelines Cimanggis to Cinere, Depok. The survey focused on the pipeline section (critical point) that have been identified based on the results of a preliminary analysis of the general overview map of the region through which both the pipeline. The pipeline section consist of housing residents, rice field, river, highway or street housing, and railroads. Verification is performed external verification, especially for pipe wall thickness.
The mathematical model of a gas pipeline risk management developed to anticipate the risk of pipe damaged by leakage at the five years. Predictions in five years were analyzed by linear regression equation that shows the relationship corrosion rate (Cr) to the time years, pipe wall thickness, and remaining life by considering the value of significance factor. Furthermore, from the results of linear regression analysis determined the equation of probability of failure (Pof) which is influenced by the level of the probability of damage is caused by the corrosion process on gas pipelines, and pipe material strength. The consequences of failure (Cof) is determined by the value of a significance factor based on the length of operating time.
III. RESULT AND DISCUSSION
Risk may have a positive or negative impact. Risk can be defined as the chance of something happening that will have an impact on objectives [1], [2]. Risk level measured based on the probability of failures (lkelihood)) and the impact of an event (consequence of failures). The general model of risk management as:
Risk = A function of (consequence and likelihood)
This can be shown mathematically as (1).
Risk = Pof x Cof. (1)
Page 289 of 436
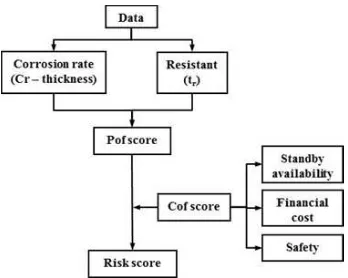
where Pof is a function of probability of damage and resistant and Cof is a function of dari standby availability, finansial cost and safety along the gas pipeline. Thus risk pipeline management model could be explained in Fig. 1.
Fig.1 Diagram of risk pipeline management model
A. Probability of Failure
Pof is a function of the probability of damage (Pod) and the resistance, where Pod is a function of exposure and mitigation has been done (already existing) while the resistance is a function of load and material strength. The load is a function of pressure and the diameter of pipe, in this case the pipe diameter is 24inch. In this study Probability of damage determined by external test measured by corrosion rate indicated by the pipe wall thickness is 16,45mm.
The equation corrosion rate can be determined according to the NBIC ANSI/NB 23, 1992 as follow [3], [4].
. (2)
where tactual (ta) is the pipe wall thickness based on the results
of measurement and tdesain (tr) is the pipe wall thickness by
design showed resistant of the pipe material. Using (3) and (4) was obtained tr is 0,56inch or 14,25mm.
. (3)
S = Ts / 3. (4)
The explaination as follow:
- P is the design pressure. Based on hydrotest of Ø24" pipe, the pressure for 15 seconds is equal to 1290psig [5], in order to obtain the value of P = 1290 x 1.4 = 921,43psig [6].
- D is pipe diamter (24inch).
- S is the strength of pipe. Based on test results B4T Bandung was obtained 473000mpa (47300psi), then S = 15766,67psi refer to the standard, as in [5] .
- F is the design factor of location (setting value of 0.8 is more corrosive because of density of population around the pipeline).
- E is the joint efficiency factor or longitudinal connection pipe. Value of 1.0 refer to standard pipe without folds, as in [5].
- T is the temperature derating factor (value of 1.0 is the design temperature less than 250oF).
The corrosion rate using high level of scale based on NACE standard is equal to 0,25mm [7]. The corrosion rates over years are predicted by the significant factor of each year in a row that will affect the pipe wall thickness and the remaining life of pipe.
TABLE I
PREDICTION OF CORROSION RATE,WALL THICKNESS OF PIPE, AND
REMAINING LIFE
Year Significant Factor Corrosion Rate Pipe Wall Thickness Remaining Life
0 0 0.250 16.450 8.798
1 0.1 0.2750 15.900 5.999
2 0.15 0.3125 15.200 3.039
3 0.3 0.3875 14.125 (0.324)
4 0.4 0.4875 12.550 (3.488)
5 0.5 0.6125 10.325 (6.409)
Note: Remaining life value in bracket is equal to 0.
Risk gas pipeline management model for the risk to the next five years is predicted from the result of correlation analysis of corrosion rate of the pipe wall thickness, time and the remaining life of pipe as shown on fig. 2, 3 and 4.
Fig.2 Correlation between Corrosion Rate and Time-year
Fig.3 Correlation between Corrosion Rate and Pipe Wall Thickness
Page 290 of 436
Fig.4 Correlation between Corrosion Rate and Remaining Life
B. Consequence of Failure
Cof is a function of standby availability, financial and location along the pipeline. Standby availability is the disruption of the flow of production due to the leakage of gas pipeline. Financial costs refers to the amount of the costs or losses arising from the leakage of gas pipeline. The location in this case would represent the effect of leakage of gas pipeline to the community and ecosystem (safety).
Value of significant factor will represent how significant the impact caused by the corrosion rate of the gas pipeline. High value showed the impact of damage occurring gas pipeline will be very significant. These conditions can lead to the shutdown of production (standby availability is low), increased costs, and have a high risk to the safety of population and the surrounding ecosystem.
The highest value of the significant factor is 0.5, it means if the design life of pipeline was 20 years then on the high critical level (significant factor), planning inspections will be made at least 10 years. The significant factor will affect the level of impact caused by the corrosion rate over time. The longer the operation of the pipeline the significant factor value will be higher so that an inspection of the gas pipeline will be done faster [3]. Table 1 shows the remaining life of the gas pipe (RL) is in the 3rd year with a significant factor of 0.3 so that in this study Cof value is 0.3.
C. Risk Model
External corrosion where the probability of failure can be determined based on the remaining life of the gas pipeline which is influenced by the corrosion rate and the pipe wall thickness. It is shown by (5).
Pof = (ta– tr) / Cr = RL. (5)
using Cof = 0,3, then risk pipeline management equation turn into (6).
Risk = 0,3 (ta– tr) / Cr. (6)
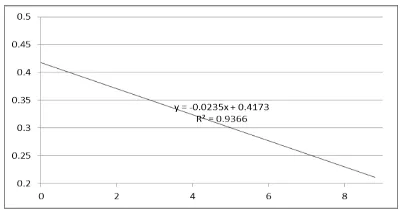
The analysis of correlation of corrosion rate of the pipe wall thickness, remaining life and time using linear regression (see Fig. 2, 3, and 4) is resulted highest coefficient correlation (R2) is shown by the correlation between corrosion rate and the pipe wall thickness (R2 = 0.998) and the equation as follows:
Y = -0,06X + 1,24 or Cr = -0,06ta +1,24. (7)
Using equation (7), the risk pipeline management model will be as follows:
Risk = 0,3 (ta– tr) / (-0,06ta +1,24) or
Risk = (0,3ta– 0,3tr) / (-0,06ta + 1,24). (8)
Maintenance strategy and planning supervision of the pipeline is a risk mitigation program based on hazard identified in each section of the pipeline and the level of risk. In this study showed that the inspections should be done every three years to ensure whether there is a leakage of pipeline that require specific action. Action plans that could be determined to the gas pipeline affected by the failure of attributes component.
IV. CONCLUSIONS
Model of pipeline risk management is obtained with formulations based on the corrosion rate of the pipe wall thickness to take into account the remaining life of pipeline, while the significant impact was set at 0.3. Furthermore, the maintenance strategy and planning supervision of the pipeline will be determined based on the results of inspections conducted on each of three years depends on the failure of attributes component.
The pipeline risk management is expected to anticipate the corrosion rate happened in order to save costs, both the operational cost and the failure cost in case of damage to the pipeline and its impact on the surrounding environment.
REFERENCES
[1] Standards Australia and New Zealand, Handbook Risk Management Guidelines companion to AS/NZS 4360:2004 (HB 436:2004), Sydney: Standards Australia International Ltd., 2005
[2] Standards Australia and New Zealand, Risk Management, AS/NZS 4360:2004, Sydney: Standards Australia International Ltd., 2004 [3] M. Yudi M. Sholihin, Analisa Umur Pakai, Sistem Pemipaan Produksi
Minyak dan Gas Menggunakan Metode RBI, Risk Management Book Series 1, Jakarta: UI Press, 2003
[4] M. Yudi M. Sholihin, Analisis Laju Korosi Dalam Kaian Terhadap Tingkat Kekritisan Sistem Pemipaan Pada Area Proses Produksi Minyak dan Gas, Unpublished paper, Jakarta, 2008
[5] American Petroleum Institute, Specification for Line Pipe, API Spesification 5L, Forty-Second Edition, January, 2000
[6] American National Standard, ASME B318-2007, Gas Transmission and Distribution Piping Systems, ASME Code for Pressure Piping, B31, USA 2007
[7] _____, Risk Assessment for Unburied Korinci Pipeline (Bare Pipe) to Korinci Gas Plant in RAPP, Laporan Akhir, Kalila limited dan Pusat kajian & Terapan Keselamatan dan Kesehatan Kerja FKM UI, 2009